United States October CPI inflation preview
Continuing with my previews of key economic events, my attention now turns to the US’ October CPI report. Within this piece, I will explain the key things to understand, what to look out for, and what to expect.
1) The US’ M2 Money Supply is FALLING
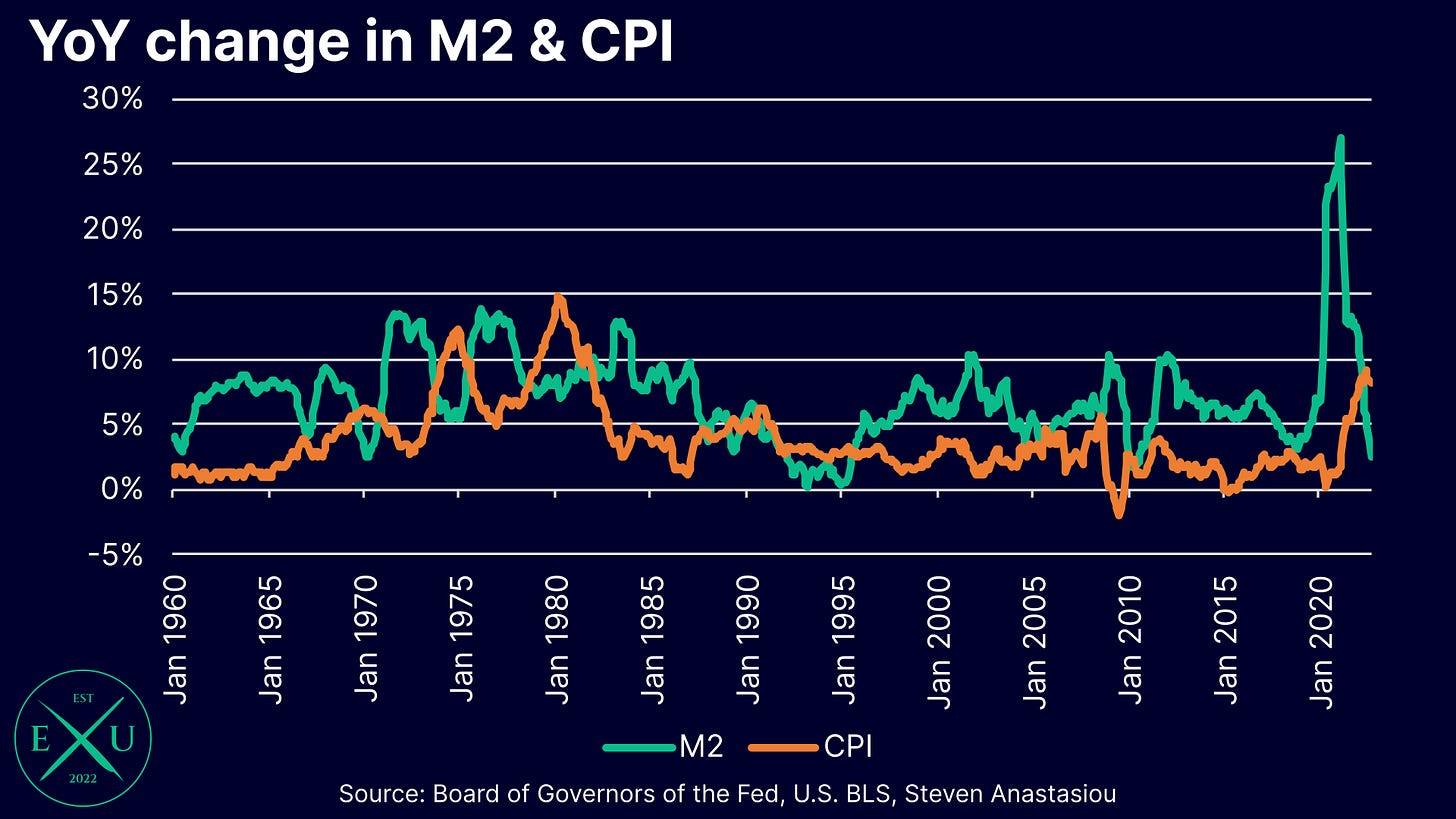
In order to understand the outlook for inflation, the first thing one should check is the rate of change in the money supply. If it has been artificially increased (i.e. YoY M2 growth of >10% in the US), then one can expect inflation to rise significantly over the next year or two. If YoY growth in M2 is <10%, one can generally expect inflation to be relatively contained. If the Fed is conducting significant tightening, and money supply growth is being significantly constrained, then one should expect a major deceleration in inflation. Depending on how significant the constraint on the money supply is, the potential for deflation exists.
After an EXTREME surge in the M2 money supply in 2020 (the second highest annual average growth in the US’ post-Civil War history), a reduced federal government deficit, and significant tightening from the Fed, has resulted in a MAJOR deceleration in the YoY growth rate of the US’ M2 money supply.
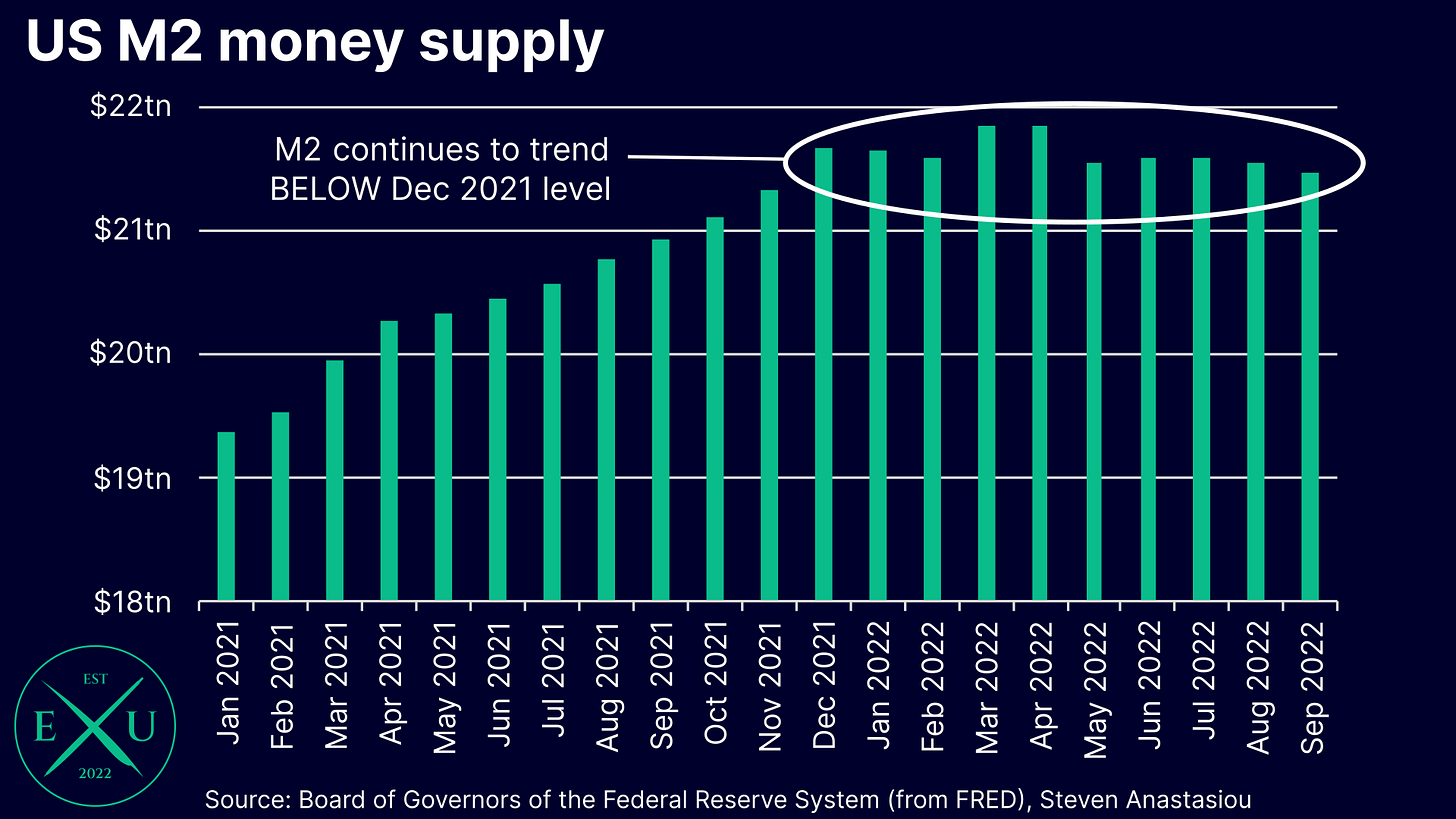
The extent of the tightening is so stark, that the US’ M2 money supply has recently been DECLINING. The YoY growth rate in M2 is thus likely to turn NEGATIVE by December. This would be the first time that the YoY change in the M2 money supply turned negative in at least 60 years (prior to 1959 we only have annual average data available - the last time M2 turned negative on an annual average basis was in 1938). Negative money supply growth is a VERY unusual event for a fiat currency and fractional reserve banking system. It is usually indicative of VERY tight financial conditions, and which could promote a SEVERE recession if the tightening is applied for long enough. As opposed to inflation, this breeds the necessary conditions for deflation to occur.
This means two things: 1) June was the likely peak in the CPI and 2) it is now a matter of how fast inflation falls, NOT if it will fall. Now that we are sufficiently grounded with the necessary knowledge to know the general direction in which inflation will head in the future, we now turn to analysing the CPI.
2) The divergent rates of change between goods (durables) and services prices
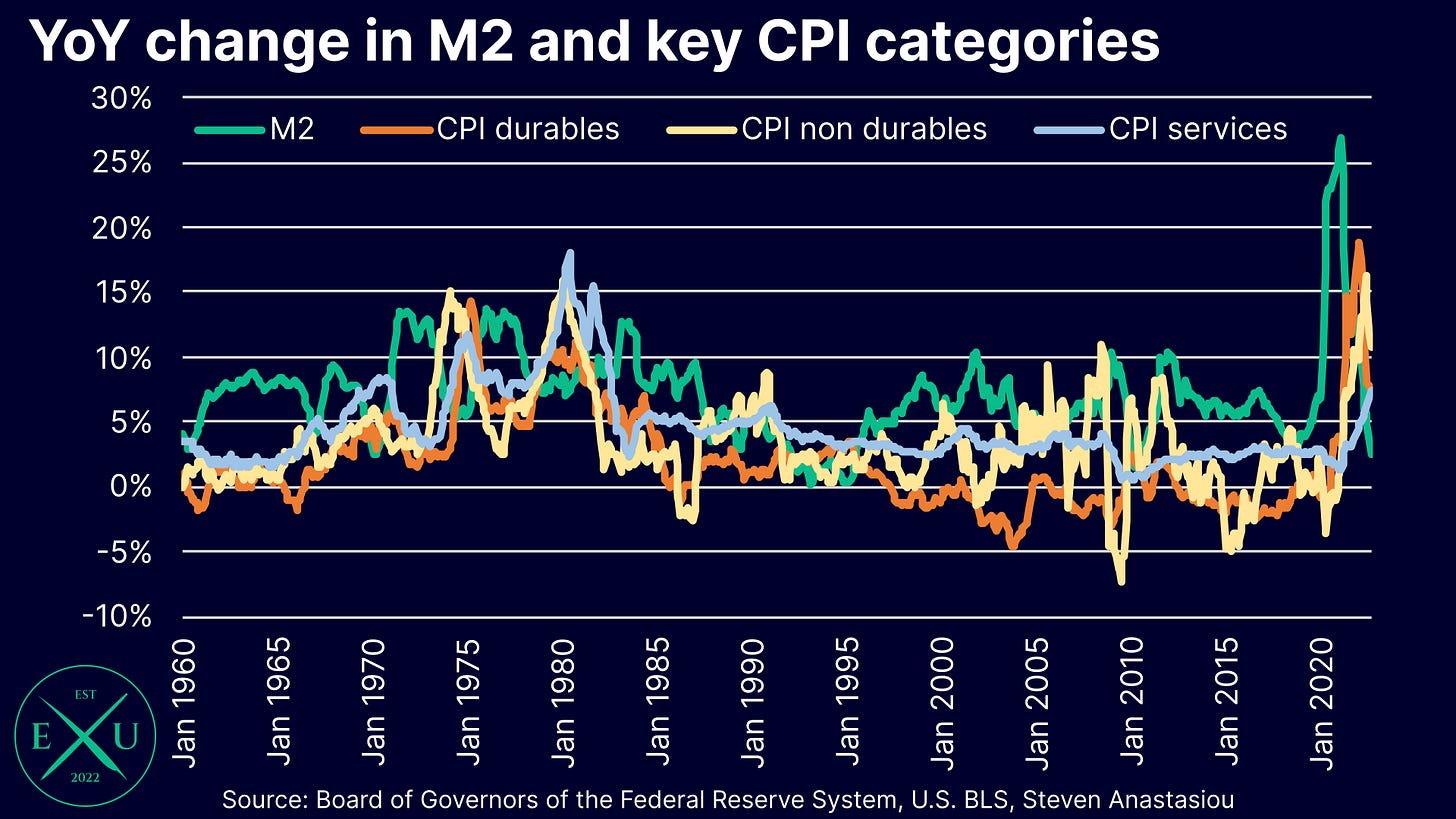
In addition to having called June as the peak in the CPI for some months, I have also been calling out that the current high inflation cycle has been marked by drastically different rates of price growth amongst key categories. This has had the effect of COMPRESSING overall measured CPI growth as different categories saw peaks at different times. So whilst some may point out that the correlation between M2 and CPI was much weaker this time than in the 1970s/80s, one can see that the correlation was much stronger when the key categories were looked at individually.
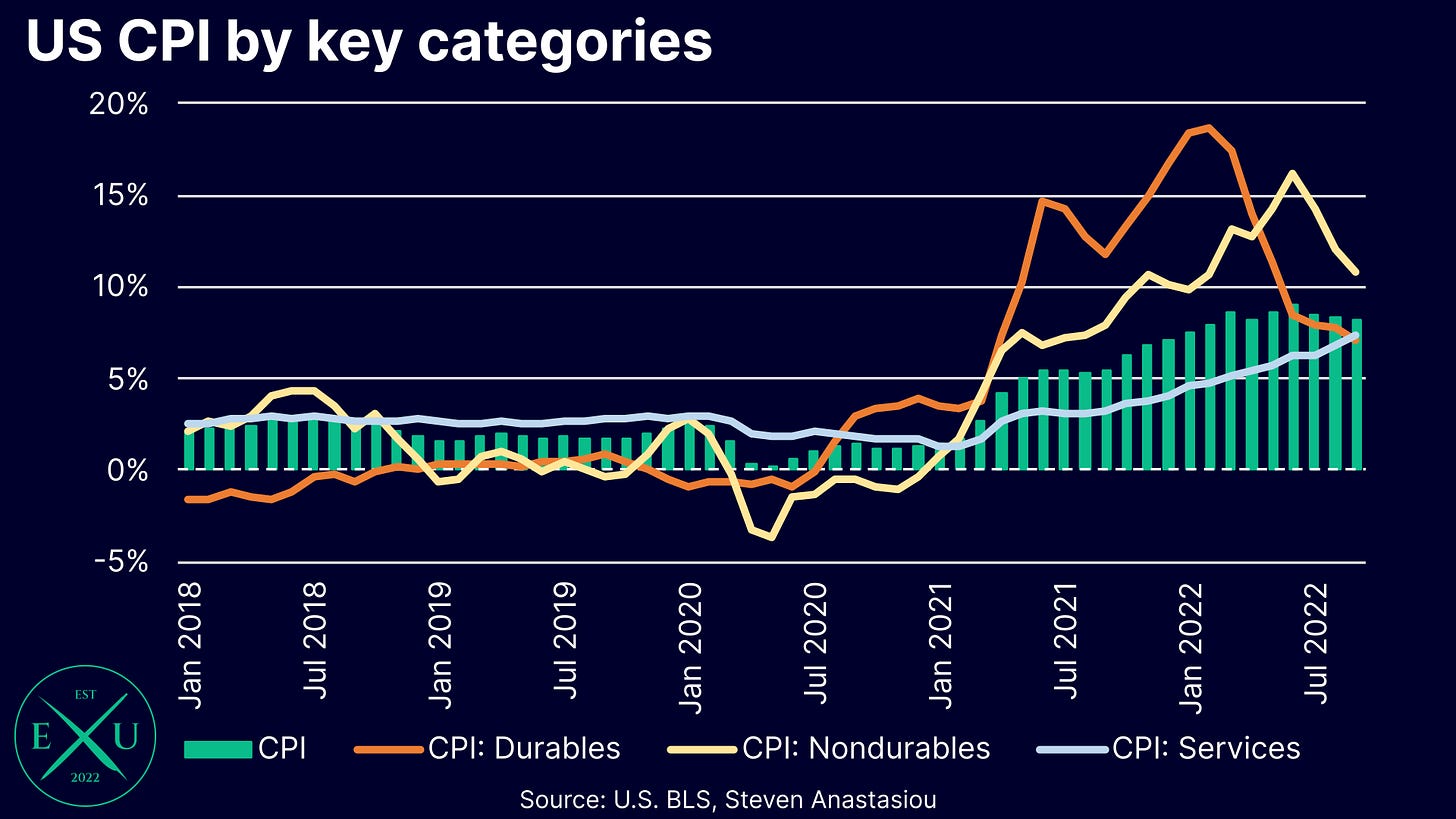
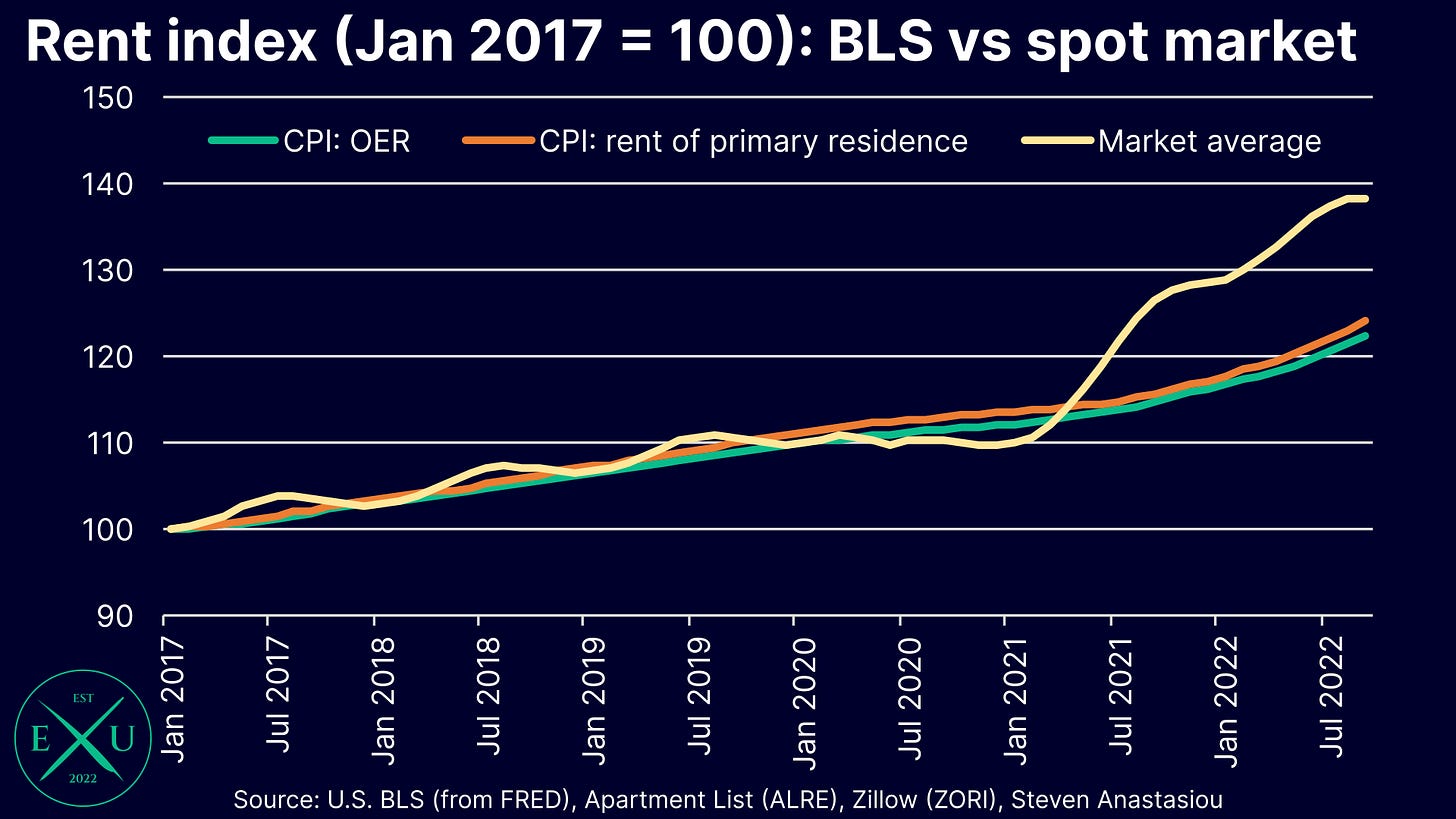
Durables price growth peaked at 18.7% and nondurables at 16.2%. Current services price growth of 7.4% is its current peak, though as we will analyse later, the services figure is impacted by the lagging/smoothed manner in which rents are recorded - spot market rental growth peaked >17% on both Apartment List and Zillow rent indexes.
Zooming in to the most recent period, we can see more clearly how the three key categories diverged from each other during the current high-inflation cycle, and the key trends that are currently in place.
Key things to note are: 1) durables led the current high inflation cycle as individuals who were locked up in their homes & flush with stimulus checks bought heaps of material items; 2) nondurables followed as movement gradually returned to normal and demand for commodities like gasoline rose; 3) services were the last category to see price growth given that it was the last category to see the new influx of printed money, as this was the area most impacted by COVID restrictions; and 4) the change in services prices was also HEAVILY delayed as a result of the lagging/smoothed nature of CPI rental measurement, which has SIGNIFICANTLY suppressed services price growth since May 2021.
Critically for the inflation outlook, one can see that just as durables led inflation higher, it has decelerated SIGNIFICANTLY after peaking in February 2022. While more unpredictable, nondurables are also showing signs of a peak in June. This is likely to herald the beginning of a return to lower levels of inflation, with the lagging services index the likely main impediment to achieving significantly lower rates of CPI growth in the months ahead - let’s now break it all down.
3) Expect another month of decelerating durables prices
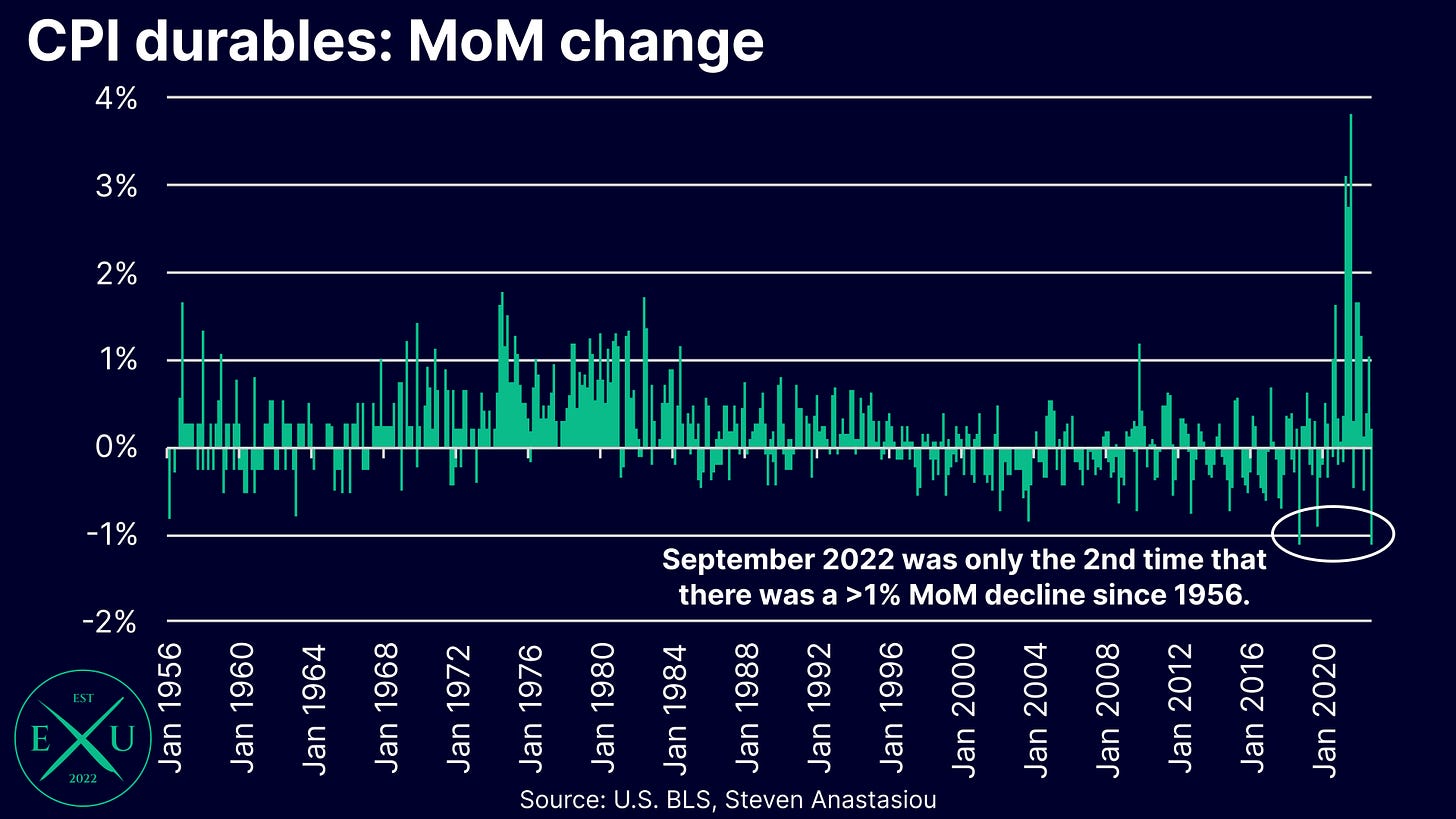
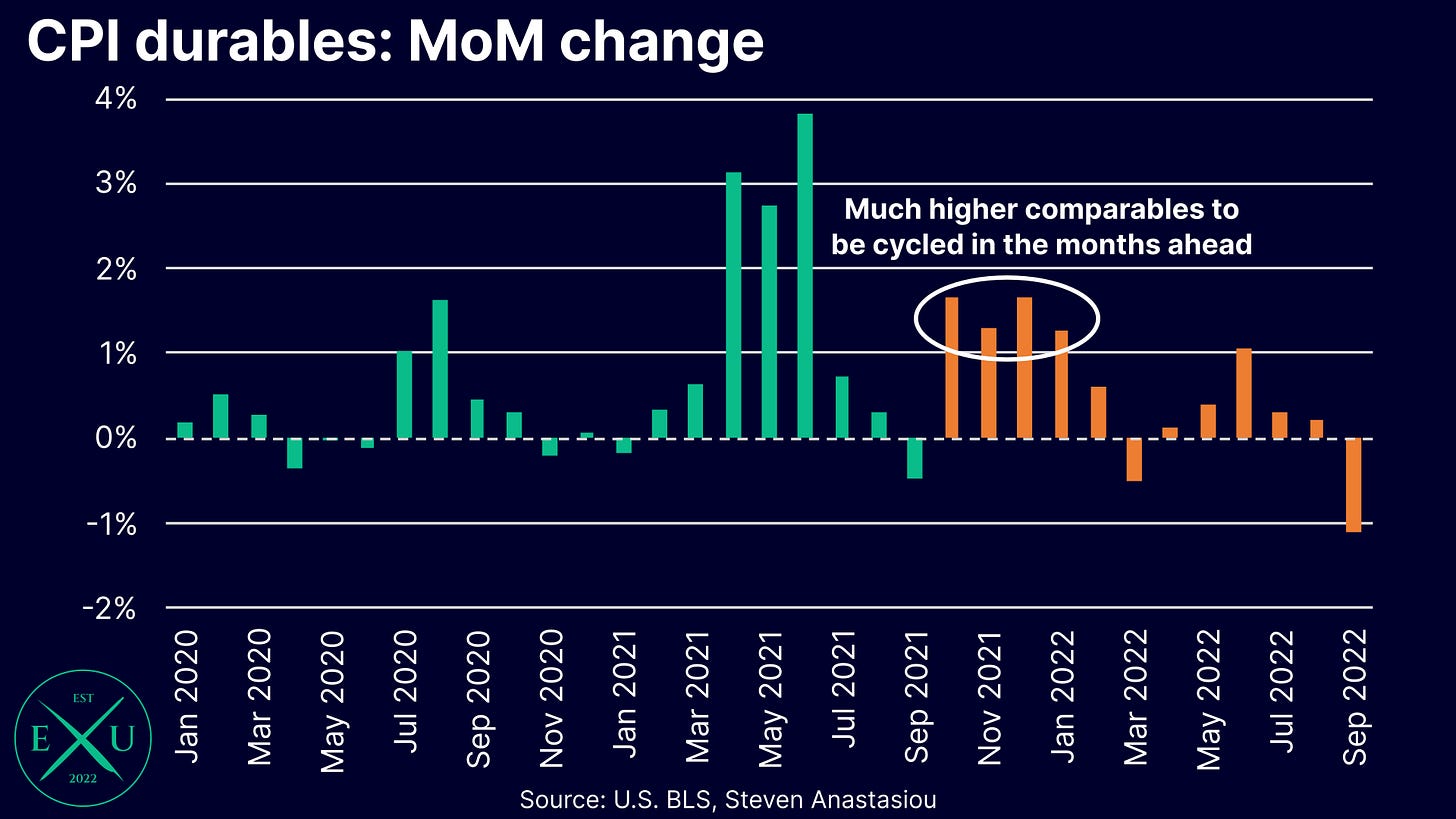
After peaking in February, durables prices have MASSIVELY decelerated. The extent of the decline in durables price growth is perhaps best illustrated by what happened in September - a MoM decline of 1.1%. This was the 2nd biggest decline EVER recorded for the CPI durables index, for which the BLS has recorded monthly prices for OVER 65 years! Therefore, not only has there been a significant decline in the pace of durables price growth, but the signs are that the pace of this decline is INCREASING.
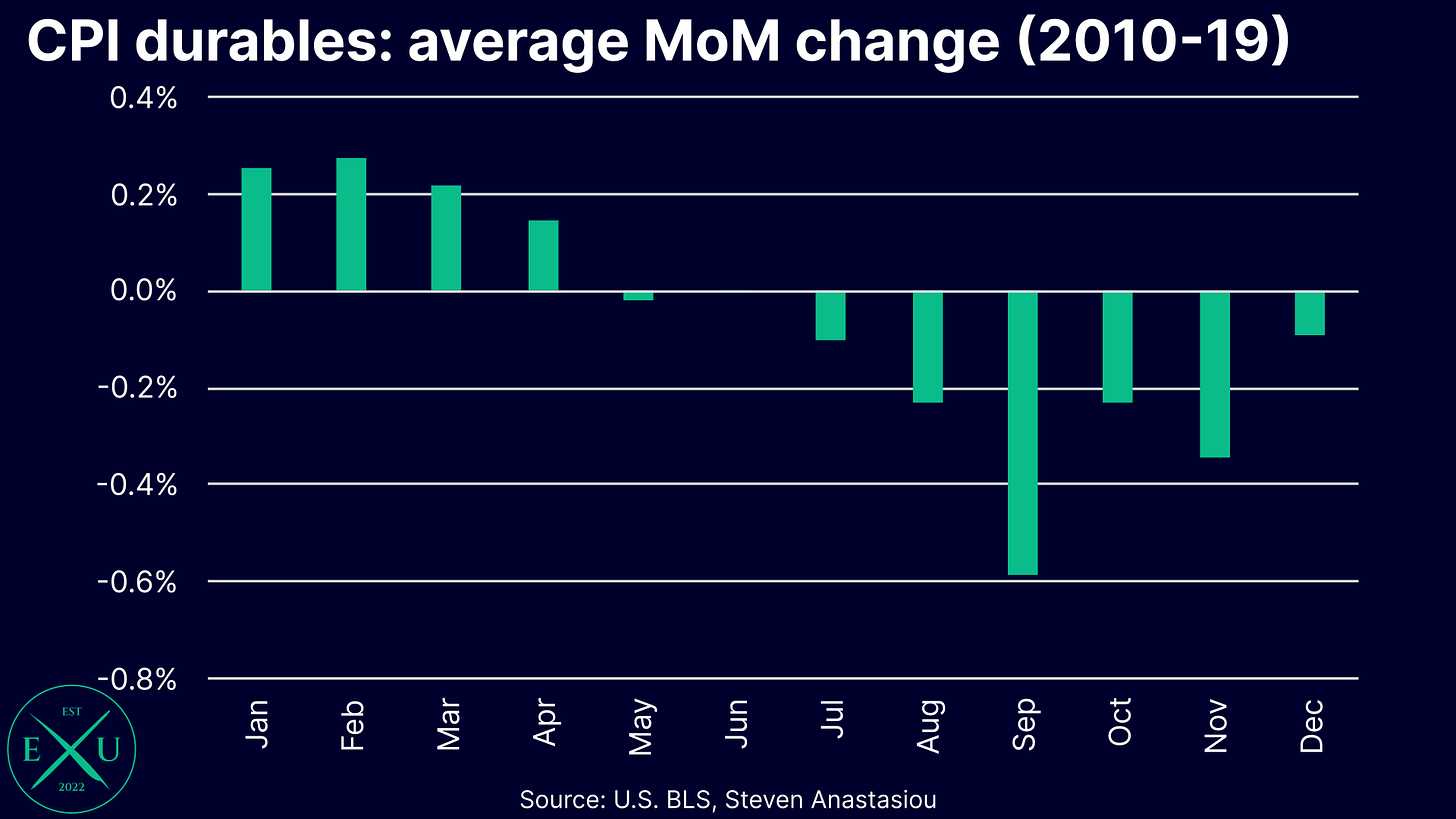
With 1) significant seasonality in durables prices suggesting that MoM price changes could be low across October-December, and 2) the cycling of relatively high comparables from October-January, YoY durables price growth could fall to LESS than 2% by January 2023.
4) The first MoM rise in gasoline prices in three months, but the potential for decelerating food prices
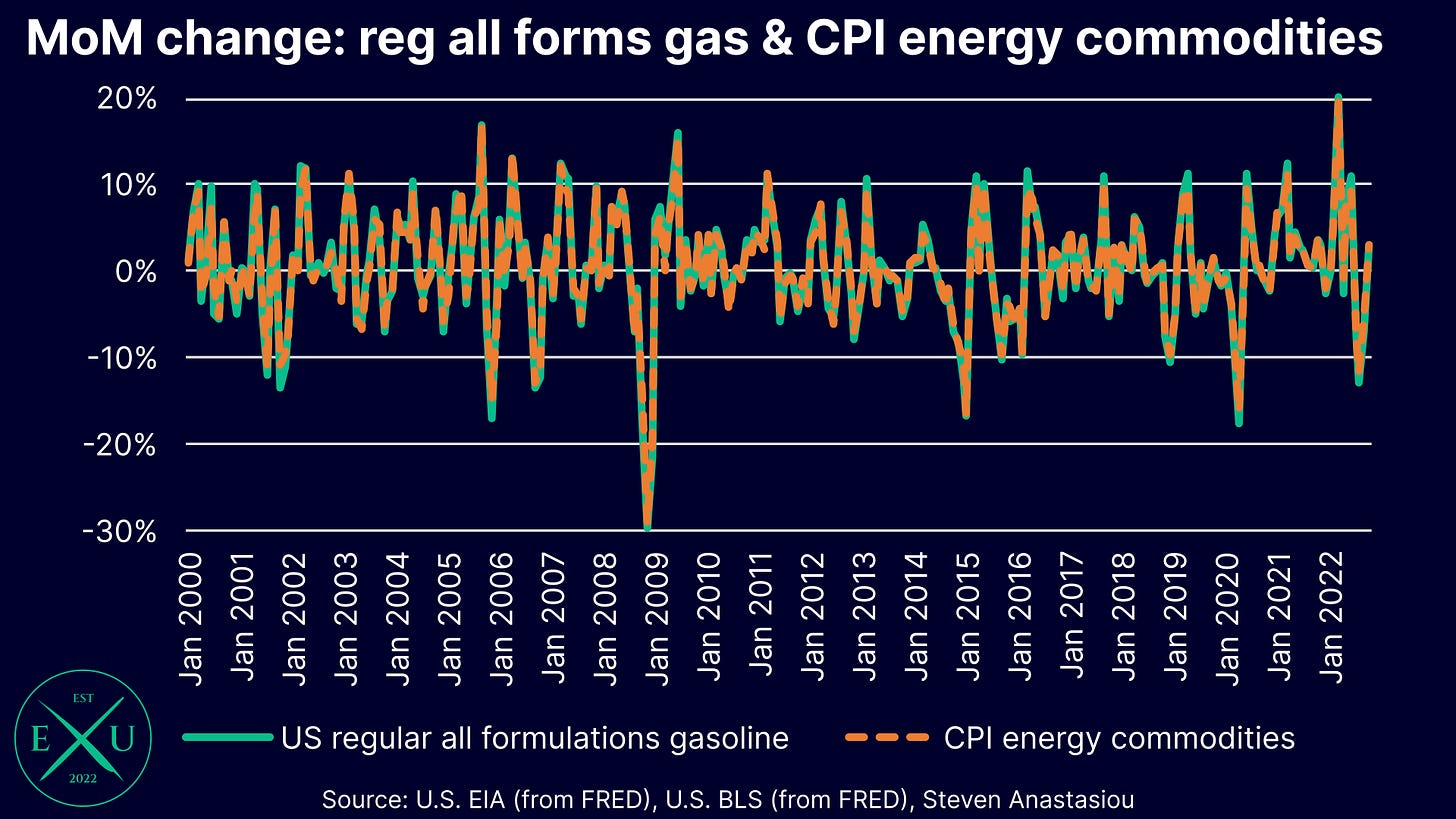
After reducing price pressures in the CPI over the past 3 months, US regular all formulations gasoline prices were on average, 3.1% higher in October according to weekly EIA data. This will be largely reflected in the CPI’s energy commodities index.
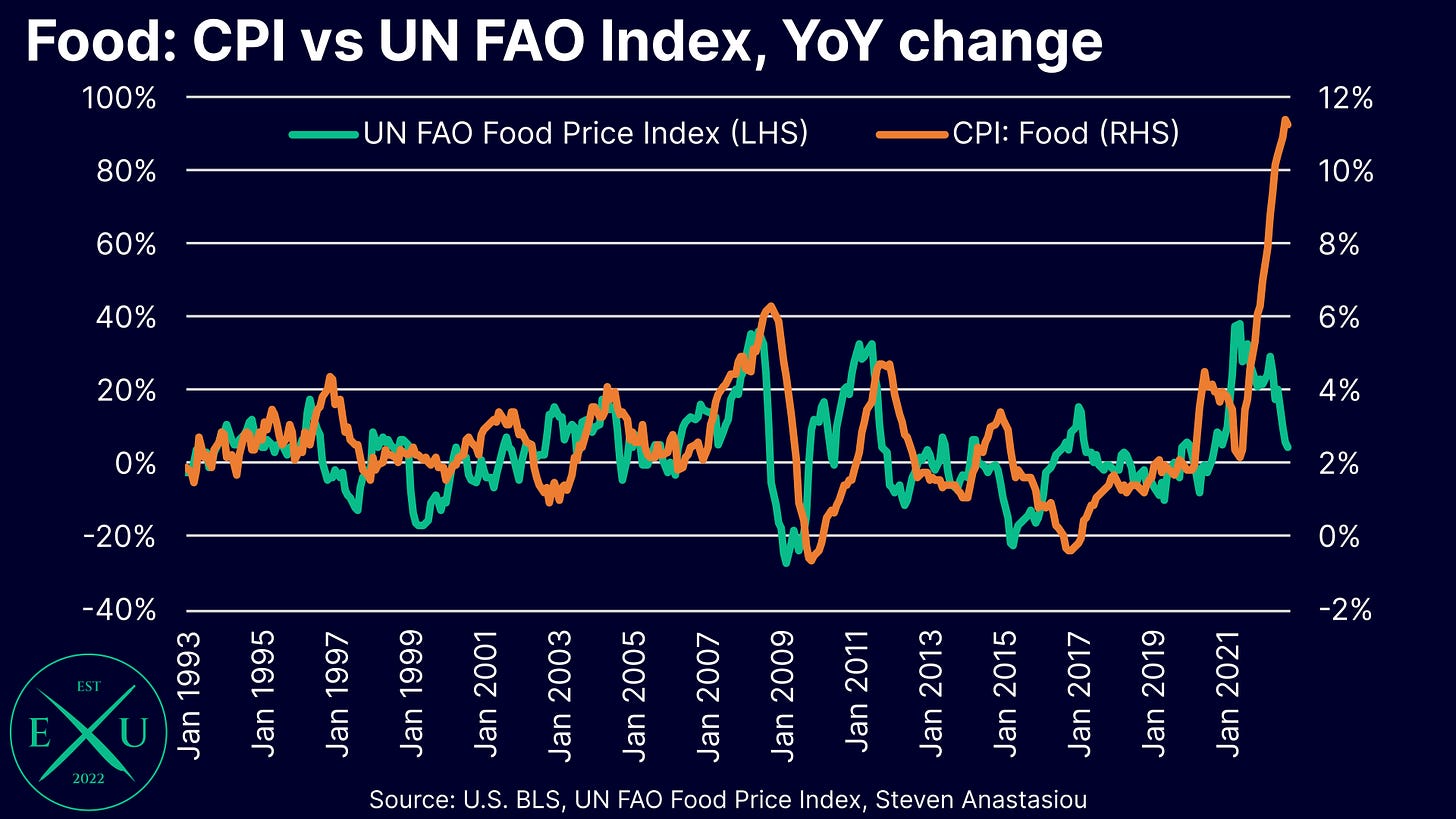
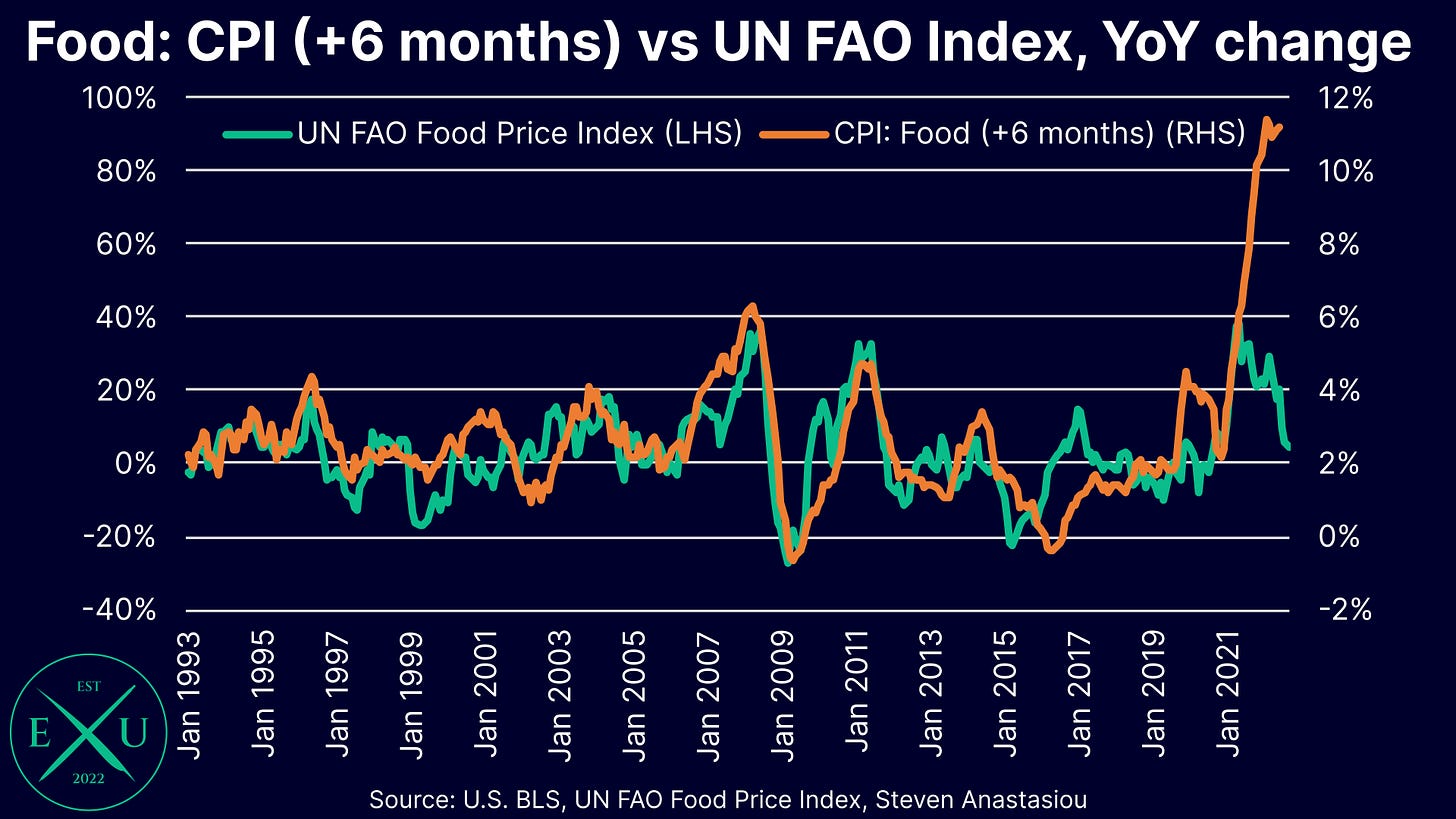
Whilst higher gasoline prices will add to MoM nondurables price pressure, following 7 straight months of declines in the UN FAO’s Food Price Index, I remain on the lookout for a material deceleration in food prices as measured by the CPI. This expectation makes logical sense given that as the prices of primary food commodities fall, one would expect this to be reflected in consumer food items over time. The fact that seven months have passed since the initial drop in UN FAO’s Food Price Index is critical, as the BLS’ CPI Food Index is MUCH more strongly correlated with a 6-month lag.
Given that food is >50% of the total nondurables category, a potential deceleration in food prices will be a HUGE tailwind for a deceleration in the overall CPI in the month’s ahead. After not seeing signs of any major deceleration in September, I will thus be watching this data point closely in October, knowing that a pivot to smaller MoM food price growth should be relatively imminent.
5) Continued strong growth in CPI shelter costs are likely
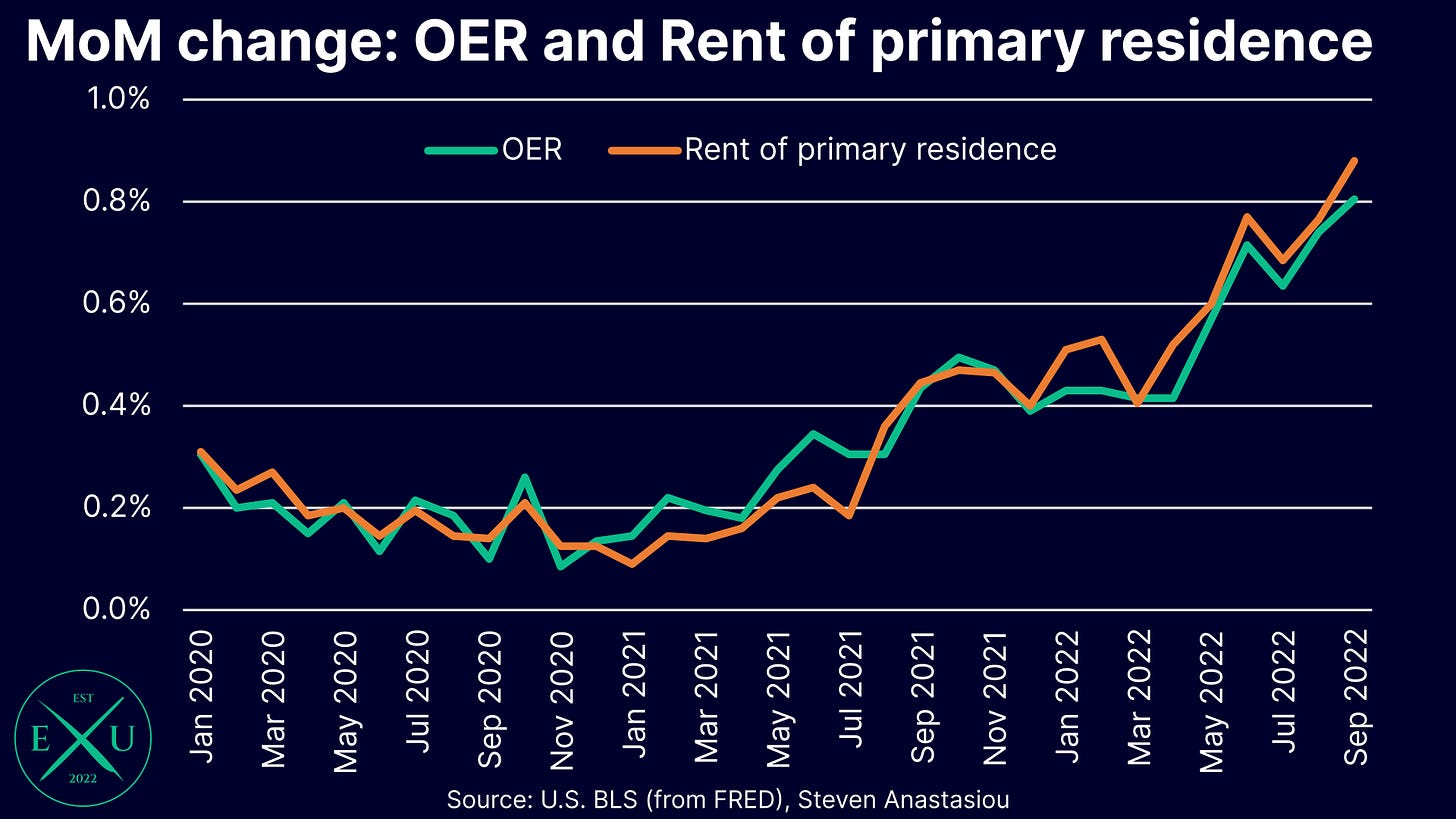
While Apartment List’s measure of spot market rents saw its second consecutive month of declines, the lagging nature of rental cost measurement in the CPI means there is likely to be another month of strong growth recorded in CPI shelter costs.
Taking the average of Apartment List’s and Zillow’s rental indexes, the extent to which spot market rents have exceeded the CPI’s owners’ equivalent rent (OER) is 12.9% (using a January 2017 base).
This means that continued high MoM growth in BLS rent measurements is likely as more and more leases in the BLS sample expire and have their rents reviewed (for more info on the manner in which the CPI measures rents, see my previous research piece here).
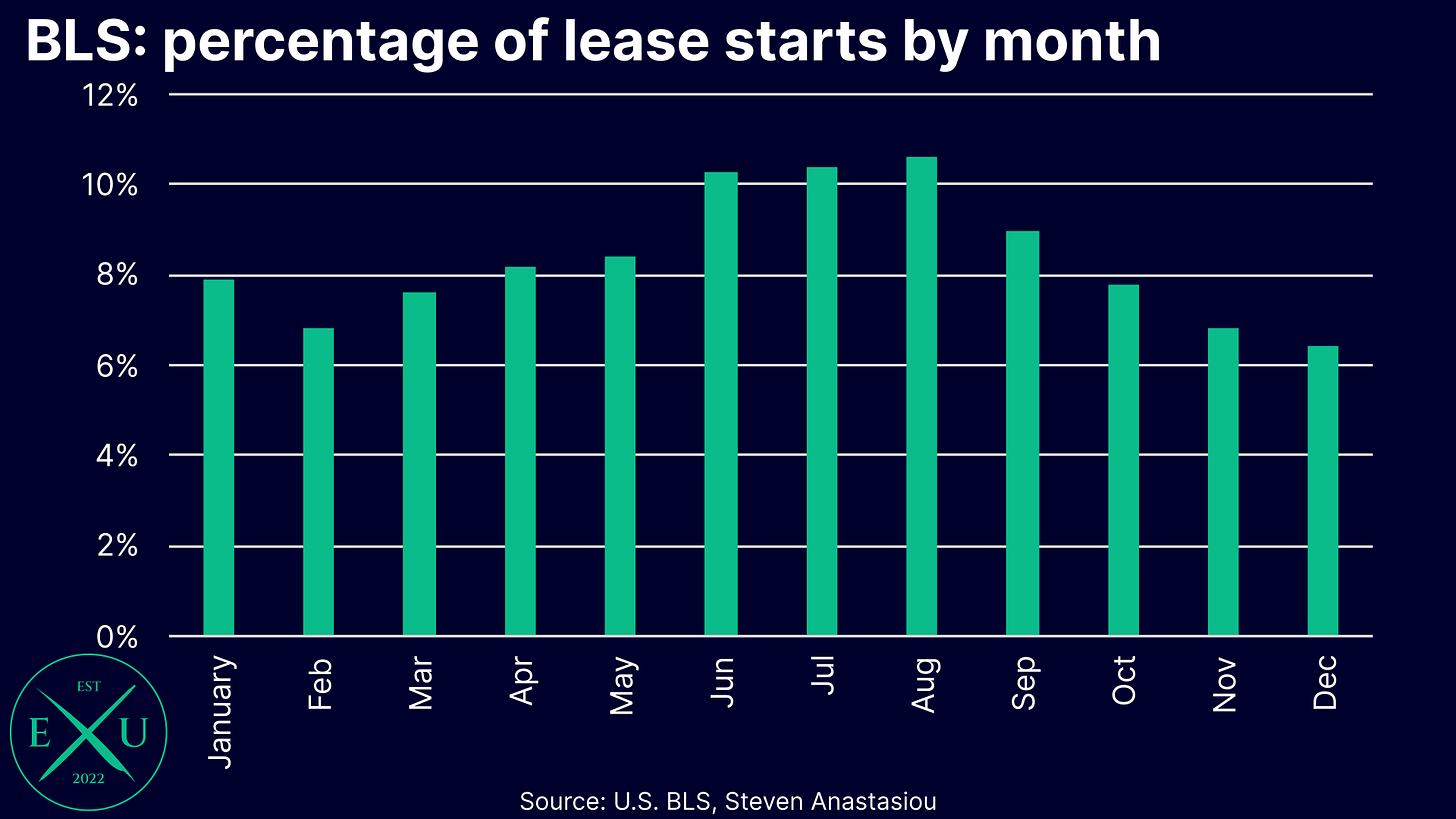
One factor that is likely to be little known by most, and which COULD see a moderation in MoM CPI rental price growth, is that the BLS typically observes a decline in new leases being started in November-February, with the summer months instead typically being the busiest. While not as low as the months ahead, given that a smaller portion of leases are likely to be reviewed in October vs previous months, and that rental prices declined in October according to Apartment List, there would appear to be scope for a somewhat lesser, but still significant, MoM increase in the CPI’s rental measurements. This factor is only likely to grow in November and December.
6) Expecting continued high services price growth, but awaiting signs of a pivot
Turning now to the rest of the services index, and remembering that services prices were the last to see the influx of newly printed money in the current COVID impacted high-inflation cycle. This means that services are also likely to be the last area of the economy to see price decelerations.
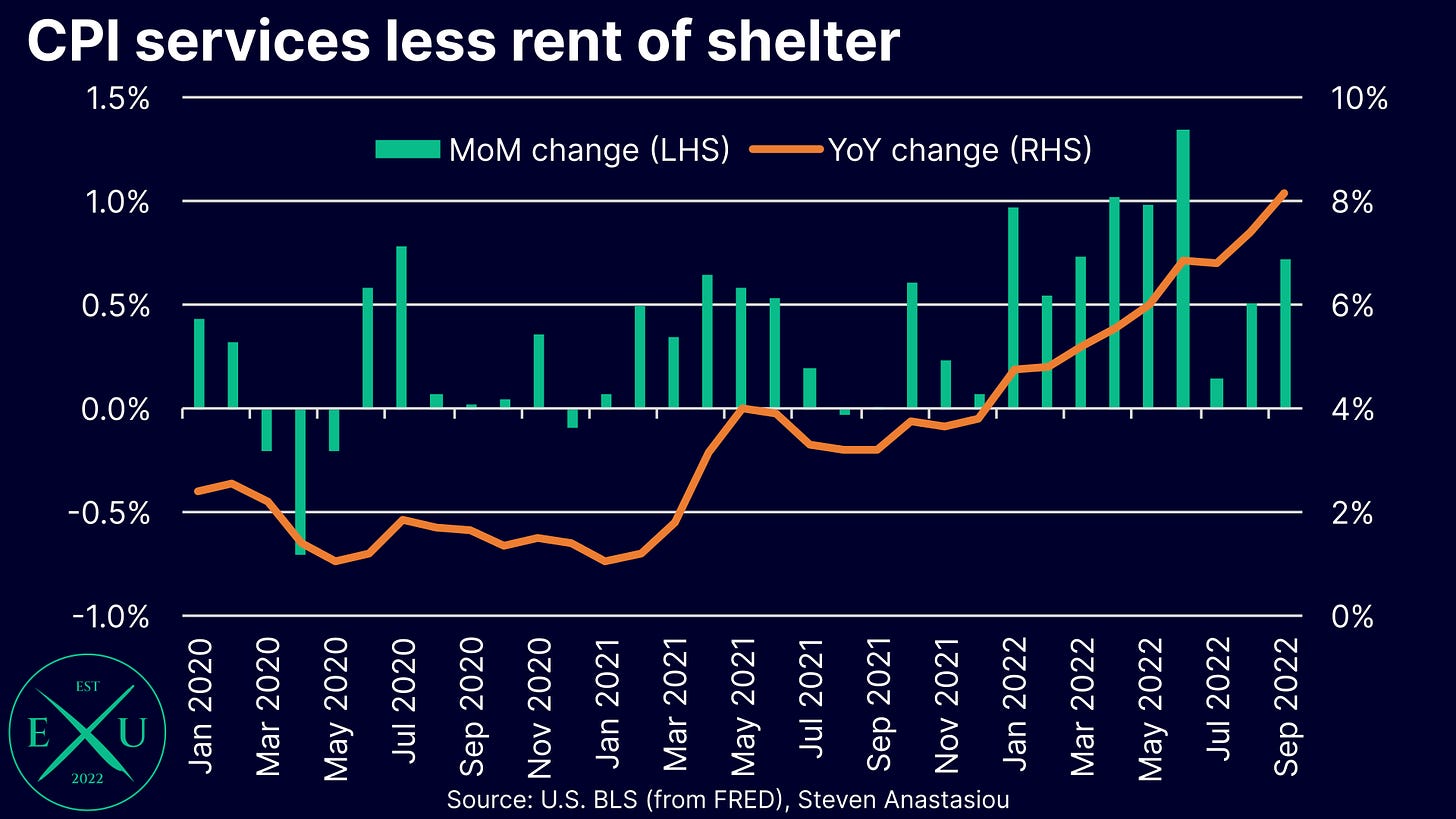
This correlates to the CPI data, where whilst MoM price growth has moderated from the levels seen across April-June, MoM price growth has reaccelerated in the past two months, once again moving beyond 0.7% in September. Given the decline in M2 and the associated impact that this will have on real demand, I am anticipating services price growth to rollover, but exactly when this occurs is uncertain. It is likely to be some months before we can grow confident that services price growth has properly rolled over, given that I would want to see at least 2-3 months of lower MoM services price growth to indicate the beginning of a broader trend.
7) Putting it all together: a likely moderation in YoY CPI as a high comparable is cycled
To summarise we have the following factors at play:
a MAJOR deceleration in YoY M2 money supply growth, with M2 DECLINING in recent months;
significantly decelerating durables price growth;
a MoM increase in gasoline prices, but signs that food prices could begin to decelerate;
another month of high CPI shelter price growth is likely; and
no strong evidence that services prices ex rent of shelter are decelerating.
Putting all of this together, what does this mean for the CPI in October?
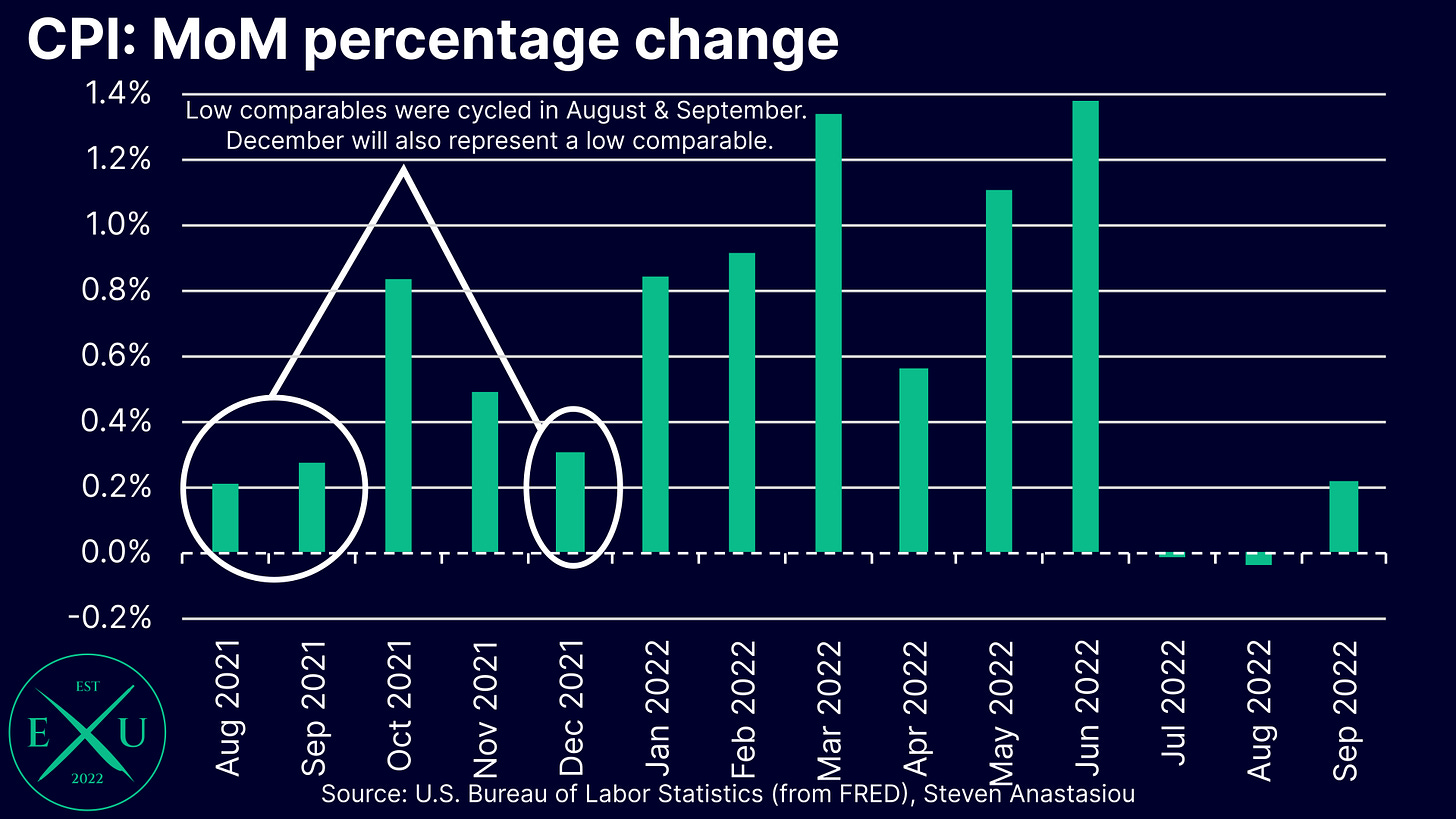
Current market consensus is for a MoM increase in the CPI of 0.6%. The Cleveland Fed’s Inflation Nowcast is forecasting MoM growth of 0.8% (0.76%). Based on my forecasts and analysis, I am a little more inclined to side closer towards the consensus forecast of 0.6% than a reading of 0.8%.
Importantly for the YoY CPI picture, is that unlike in the past two months, October is cycling a high comparable of 0.8%. This means that a MoM increase of 0.6% would result in the CPI declining to less than 8% on a two decimal place basis, to 7.95%. This would be the first time that this has occurred since February 2022. While some may see this as reason for a market rally, such an inflation rate would remain uncomfortably high for the Fed, meaning its aggressively hawkish monetary policy stance is unlikely to change in the near future.
I hope you enjoyed this latest piece. If you would like to help support my work, please subscribe, and help me spread the word by sharing this article.
As the readership of Economics Uncovered continues to grow, please feel free to also leave questions & comments below - I intend to nourish & build a community whereby we can all improve our knowledge and understanding of the important economic issues that impact our day-to-day lives. A healthy debate & conversation is the best way to help achieve that.
Thank you for continuing to read and support my work.


