Shelter and the CPI: everything you need to know
How does the CPI calculate rents? Why does it lag? How big is the lag? How much does this impact the overall CPI? Read on to find the answers to all of these questions and more!
What is included in the CPI’s shelter index?
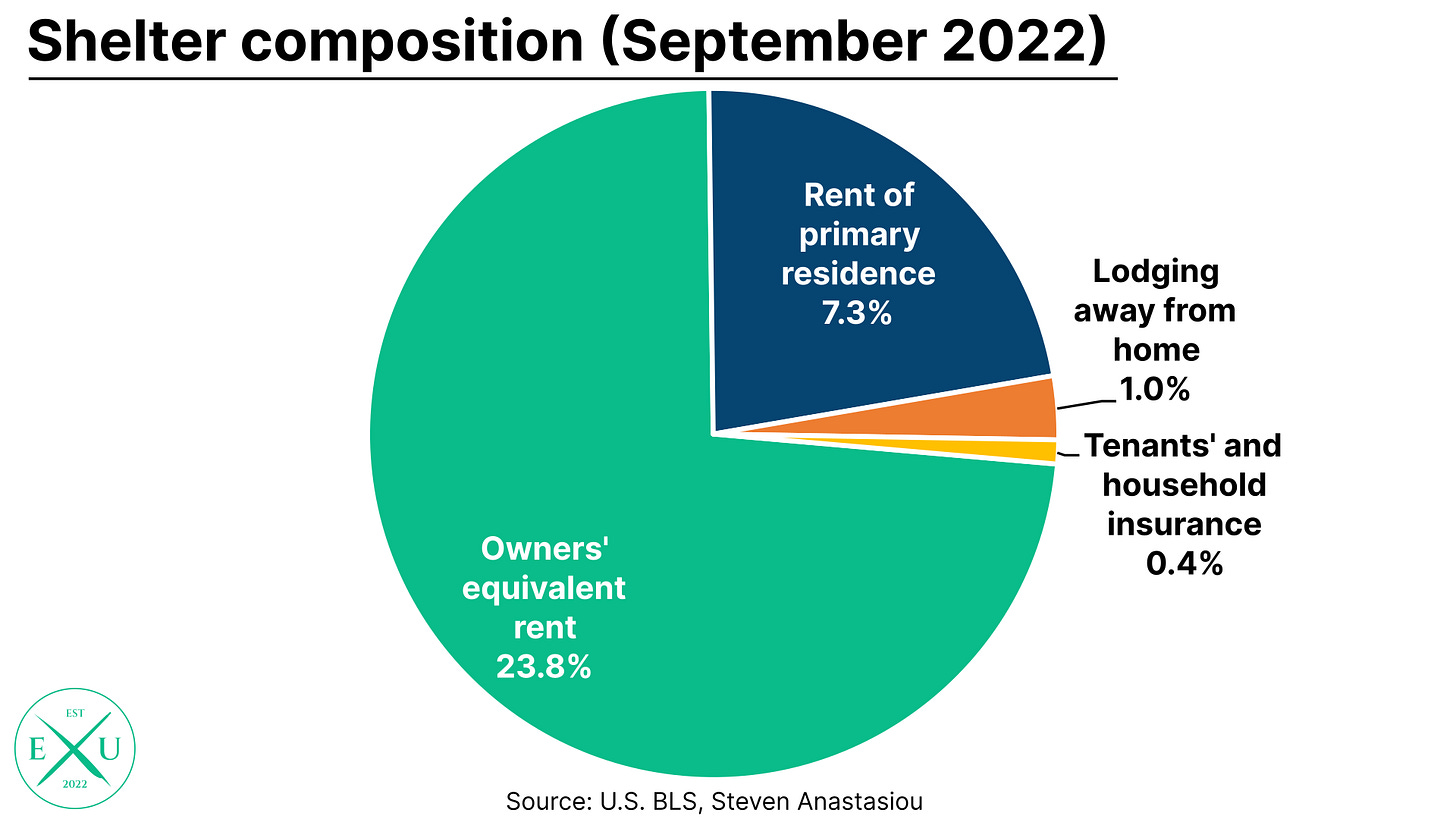
The shelter index is composed of four separate line items, being: owners’ equivalent rent (OER); rent of primary residence; lodging away from home; and tenants’ and household insurance.
The shelter index was equivalent to over 32% of the total CPI in September.
The two most critical components of the shelter index by far are the OER (>23% CPI weighting) and rent of primary residence (>7% CPI weighting) components. Given that they are easily the two most crucial components of the shelter index, this article will focus on OER and the rent of primary residence items.
How is OER and rent of primary residence calculated?
In order to calculate these two components, the U.S. Bureau of Labor Statistics (BLS) collects the rents paid on a sample of homes in a specific area. Each area is broken up into 6 separate panels, with the BLS collecting rent data from a given panel every 6 months. Rents for panel 1 will be collected in January, panel 2 in February and so on, with panel 1 resampled again in July. This means that the BLS collects updated rental data every month, but each specific housing unit is sampled every 6 months.
Note here how the BLS only collects rental data. While this is directly attributable to the rent of primary residence index, this is not the case for the OER index. This is why the index for people that have purchased their home is known as owners’ equivalent rent, as the actual cost of purchasing a home isn’t measured by the BLS. Instead, the cost of the service that a home provides, being shelter, is inferred by the rents charged on comparable homes.
Why does this methodology result in a lag to spot market rents?
The main point of concern raised with the BLS’ measurement of rents, and one in which I share and often point out, is that it results in a lag between actual spot market rents.
The reason for this is that most of the housing sample in a given month that the BLS uses to determine rents, are continuing rents, meaning that the rents sampled were under a fixed lease agreement that often only changes once every 12 months. During periods where there is a drastic change in spot market rents (either upwards or downwards), there can be a significant variation between the rents calculated by the BLS (most of which are fixed for a period of time), versus rents that would be calculated if the BLS had only taken rents for newly signed agreements.
According to the BLS’ Housing Survey, only 31.8% of housing leases in the US are on a month-to-month basis, with the rest being locked in a lease agreement for at least some length of time. 12-month leases make up just under 60% of leased US housing.
This makes the BLS’ shelter index slow to reflect the current underlying rental market. Instead, the BLS’ measure indicates a mix of current rental conditions, as well as the rental conditions from the time at which a lease was signed, which could have been years prior! This can provide the impression that inflation is not increasing significantly whilst spot market rents may be drastically rising, whilst also suggesting that inflation remains high as the BLS’ sample is gradually moved in-line with spot market rents that rose drastically 6-12 months ago, but which are no longer increasing.
When are leases most likely to be started?
New leases in the US are most likely to be signed during its summer months of June - August, with over 30% of leases signed during these three months. November - February tends to result in fewer new leases, with the BLS’ surveys recording that 27.9% of leases start during these four months.
How much does the BLS’ lagged measure differ to spot market rents?
Given that rents do not generally exhibit extreme month-to-month price variations, generally there are not overly material differences between the CPI’s rental measures and the spot market measures from real-estate industry participants like Apartment List and Zillow.
This can be seen from 2017-2019, whereby the CPI and spot market based indexes generally moved in relatively close proportions, albeit with the CPI’s continuing lease component resulting in a much more smoothed measure versus the more volatile spot market measures (though Zillow’s Observed Rent Index is also smoothed via the use of a 3-month simple moving average).
Comparing the two market based measures, the CPI looks to be more closely correlated with the Apartment List index over 2017-19, with the CPI’s rent related indexes traveling through the peaks and troughs of Apartment List’s measure, whereas Zillow’s index remained above the CPI throughout this time period. This is a result of Zillow’s index not recording material declines, meaning that there was less of an ability for the lagging CPI to fully “catch-up” to the observed rents being seen by Zillow. In that sense, the comparison to the Zillow index better captures the lagging nature of the BLS’ rent measurement across 2017-19. Overall, the differences were generally not overly stark between the different measures over this time period.
Though as a result of the extreme post-COVID growth in the M2 money supply, which created a surge in demand and higher prices for many goods and services, rents rose sharply. This created a huge uptick in the spot market based measures of rent, and given the lagged nature of the BLS’ measurement approach, a big divergence opened up between the market based measures of rent versus the CPI’s measures.
Despite increasing MoM rises in the BLS’ rent related indexes over recent months, the BLS’ rent related indexes continue to remain a long way off fully incorporating the post-COVID growth seen in the spot rental market.
How long will it take for the CPI’s shelter index to catch up to spot market rents?
In recent months spot market rental growth has decelerated sharply. Apartment List’s index saw a MoM DECLINE in September, whilst Zillow’s index recorded a MoM gain of 0.3%. Taking the average of these two market based indexes, MoM growth rates have decelerated from 1.3% in June to 0.0% in September.
As a result of this deceleration, the CPI’s rent related indexes have begun to bridge the gap between the market based measures during the past two months.
Now that we can see that the CPI is beginning the process of catching up to market rents, how long can we expect it to take to more fully bridge the gap? While we cannot know this with certainty, we can gain a rough idea by extrapolating recent MoM growth rates.
First we need to make an assumption around future MoM changes in market rents. Given ongoing Fed tightening and the flatlining of M2, I believe that the recent deceleration in market rents is likely to be sustained. Therefore the first assumption that I will make is that M2 continues to be held flat, and rents continue to flatline for the foreseeable future (though given a likely further deceleration in the economy, I would not be surprised if market rents declined over coming months).
The second assumption we must make is the pace at which the CPI’s rental indexes will grow over the months ahead. Both the OER and rent of primary residence indexes recorded their largest MoM increases of the current high inflation cycle in September.
Over the past 6-months, the compound monthly growth rate has been 0.7% for rent of primary residence, and 0.6% for OER. While MoM growth rates have been trending higher over these past 6-months, it is important to remember that November - February represents the seasonal low period for new lease agreements, which may impact the speed of the catch-up over coming months.
Instead of taking the most recent growth rates, I will err on the side of caution and utilise the monthly compound growth rate over the past 6 months as the basis for the extrapolation.
This reveals a significant problem, in that NEITHER of the BLS’ rent based indexes will have fully caught up to the current spot market average of the Apartment List and Zillow indexes by the END of 2023.
If we instead focus just on the Apartment List index, which the BLS indexes tended to intersect over 2017-19, then a continued flatlining in the Apartment List index would see the BLS’ rent of primary residence index catch-up by September 2023, and the OER index by December 2023.
It is important to note that this extrapolation is NOT a concrete forecast. Instead, this extrapolation is more simply intended to paint a rough picture, and highlight that a SIGNIFICANT catch-up is required, and that this is likely to take many, many months to largely complete.
Moving forward several dynamics will likely play out which should be kept in mind, including a likely lessening of the pace of growth in the BLS indexes as they get closer to the spot market measures, as less and less of its sample will require a drastic re-adjustment to current spot market rents. As I previously noted, I also would not be surprised if spot market rents saw a material decline in the months ahead, which would help the BLS’ rent related indexes more quickly approach spot market rents.
What does this mean for Fed policy and the potential for policy mistakes?
In order to understand the potential ramifications for Fed policy, one should recall the Fed’s early lackadaisical approach to inflation. Most will remember the Fed’s persistent line of thought that inflation was not a major problem but was just “transitory” and did not require a significant policy response. One of the key reasons for this was likely to be that the CPI did not move much between May and September 2021, staying between 5.0%-5.4%. All the while, underlying inflation using spot market rents had increased from 6.1% to 9.2%.
Just as the lagging measurement of rent in the CPI likely contributed to the Fed being too lackadaisical about inflation as the CPI understated underlying market inflation, the inverse is now set to occur over coming months, risking significant overtightening from the Fed.
This is particularly true given that the Fed believes core measures are better indicators of underlying inflation, when in reality they simply exaggerate this very problem, as they are even more heavily weighted to shelter costs. The potential for significant overtightening drastically increases the chances that the US enters a severe recession.
The key unknown factor is whether or not the Fed looks to adopt an adjusted measure of inflation that accounts for the lagging nature of rents in the BLS measurement (and which also occurs in the BEA’s PCE Price Index), like the one I have provided above, so as to not continue tightening based upon outdated rent numbers, but instead act based upon current underlying conditions.
Clearly this is not going to happen imminently, as this is something that the Fed would likely begin telegraphing for some months in advance. Given that they failed to account for the lagging nature of rent increases as underlying inflation was rising, there is a key precedent in place that the Fed will also fail to take lagging rent measurements into account as the opposite scenario plays out.
What could force the Fed to adjust? A severe recession. The problem is, by that stage, it would be too late.
I hope that you enjoyed and found value in this research piece!
In order to receive my upcoming research as soon as it is published, please ensure that you subscribe to Economics Uncovered, and are following me on Twitter.
If you too believe that everybody deserves to have access to high-quality, institutional grade research, as opposed to just high net worth individuals, hedge funds & asset managers, then please consider sharing this latest article to help ensure that these important insights can be viewed by as many people as possible - thank you!