Why the latest US jobs report points to a recession and what it means for the Fed and financial markets
With the US jobs market weakening further, I have brought forward my expectations for when the US may enter a recession, with flow-on implications for my interest rate and financial market outlook.
In light of the elevated significance of the July jobs report, which showed a further material weakening of the US employment market and led to a significant financial market reaction, this warranted a larger than usual jobs report review.
This comprehensive 5,000+ word update covers the latest jobs report in extensive detail, including an analysis of potential weather related impacts, the Sahm Rule and an additional 15 key employment market indicators, many of which suggest that the US economy could already be in, or be nearing, a recession.
As a result of the latest jobs data, my expectations for interest rate cuts and the timing of a potential US recession have both shifted. Given these shifts, I have also provided updates on the potential outlook for financial markets.
This is one report that you won’t want to miss.
July employment summary
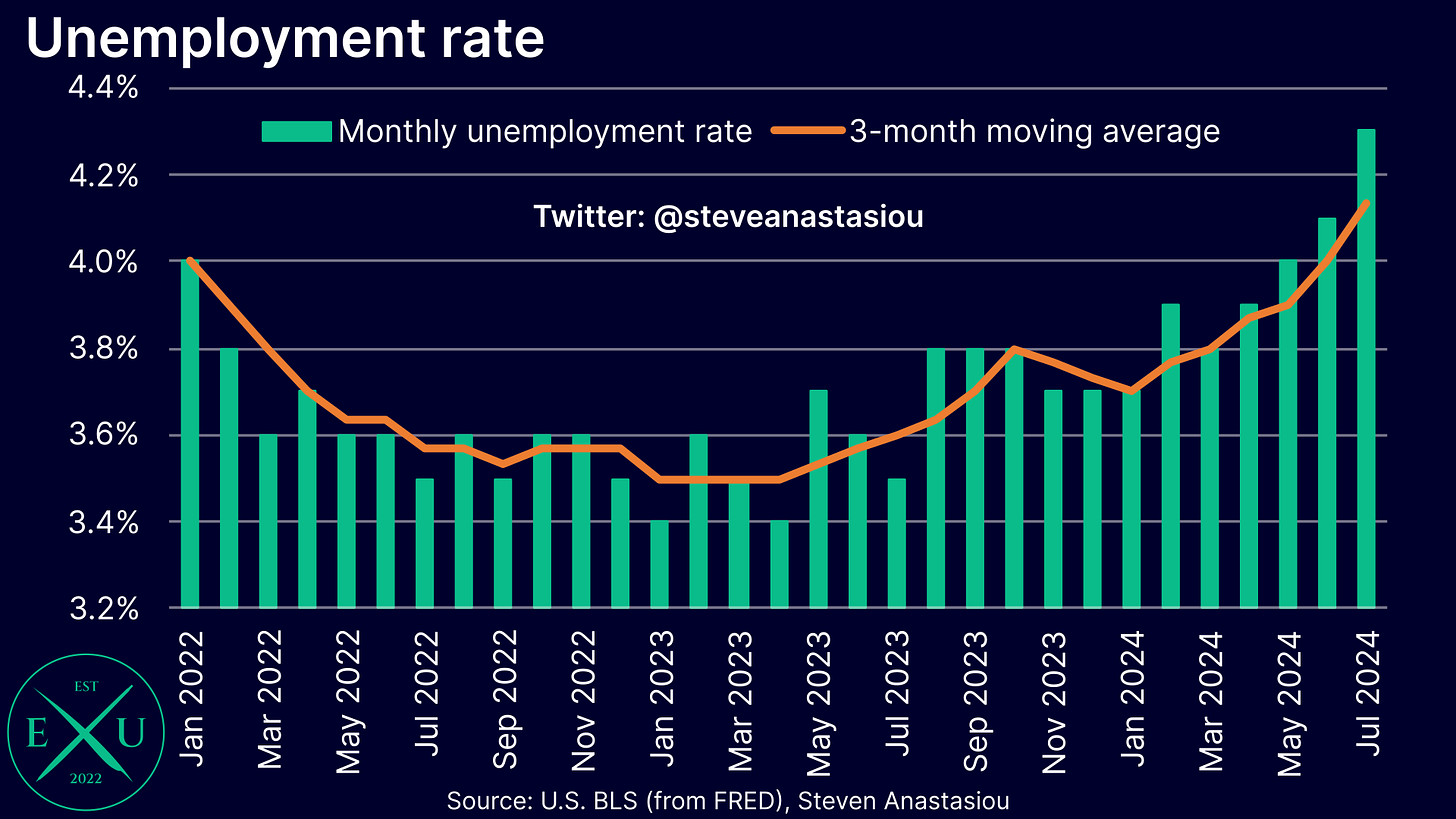
The unemployment rate jumped to 4.3% in July (from 4.1%), to its highest level since October 2021. This is 0.9 percentage points above the cycle trough recorded in April 2023. On a 3-month moving average basis, the unemployment rate rose to 4.1% (from 4.0%), which is also the highest level since October 2021. This is 0.6 percentage points above the April 2023 cycle trough.
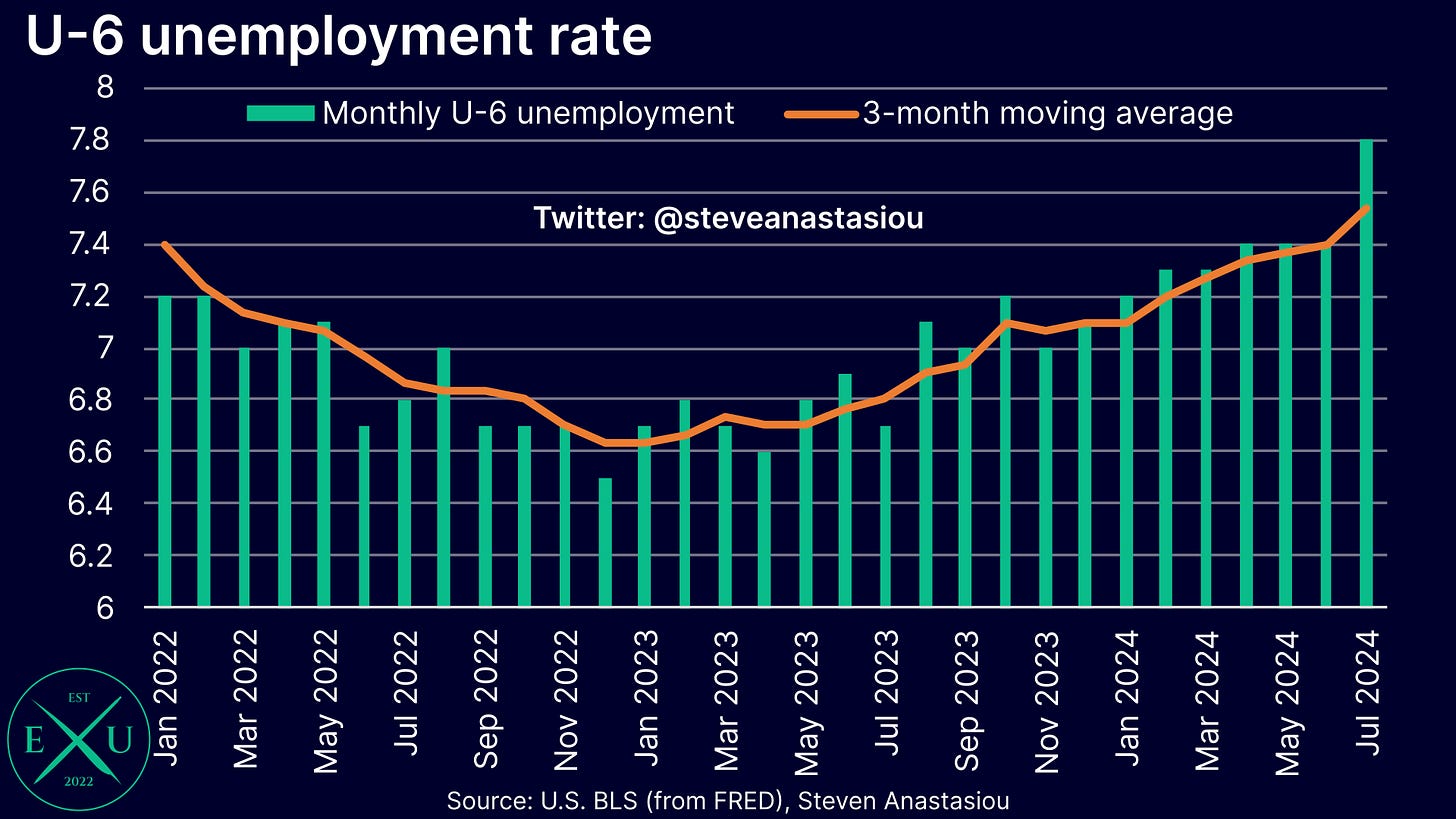
The U-6 unemployment rate, which also measures underemployment, surged to 7.8% (from 7.4%), which is also the highest level since October 2021. The U-6 unemployment rate is now 1.3 percentage points above its December 2022 cycle trough. On a 3-month moving average basis, the U-6 unemployment rate rose to 7.5%, which is 0.9 percentage points above its cycle trough and the highest level seen since December 2021.
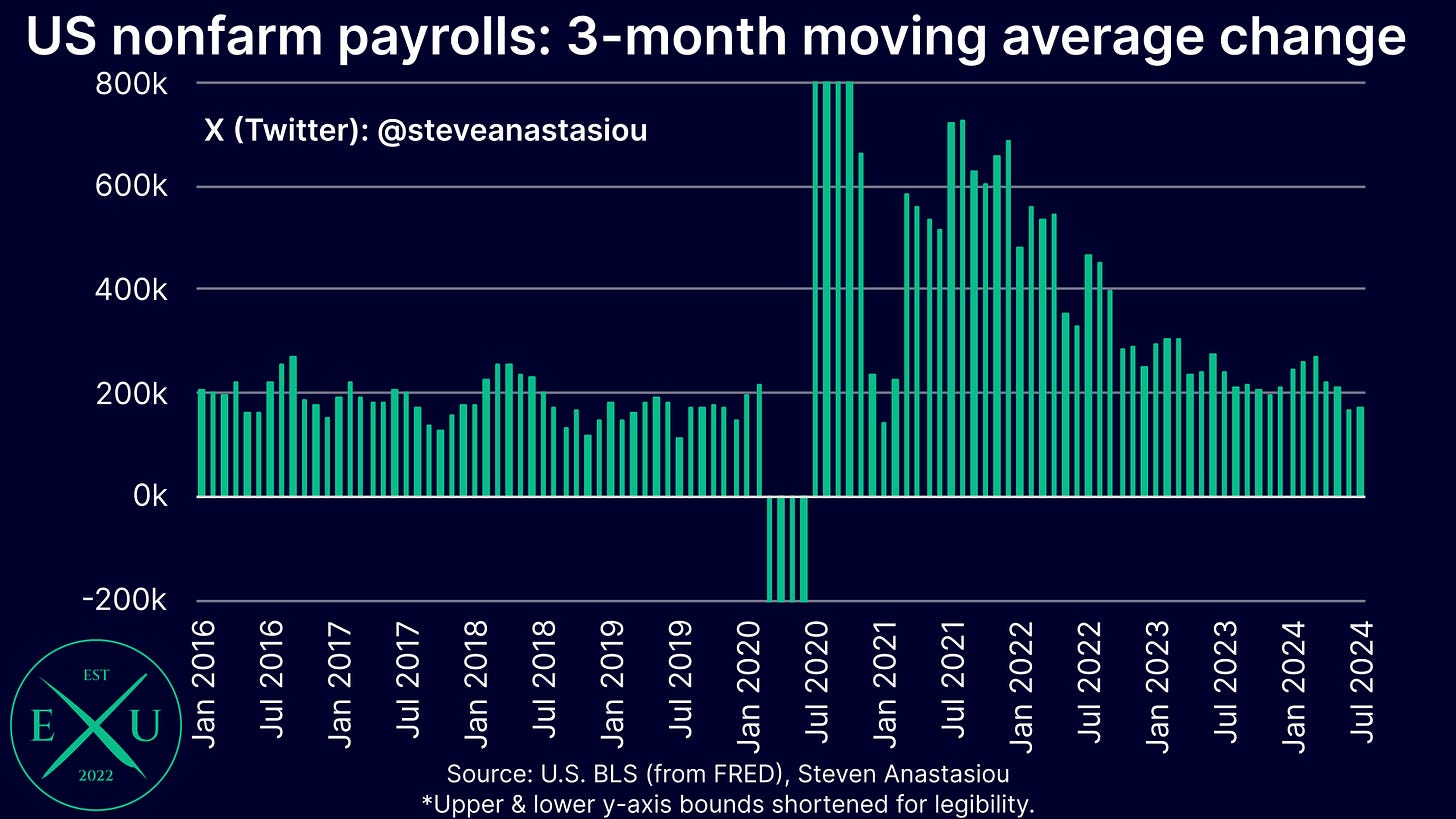
Nonfarm payrolls grew by 114k, the slowest pace of growth since April.
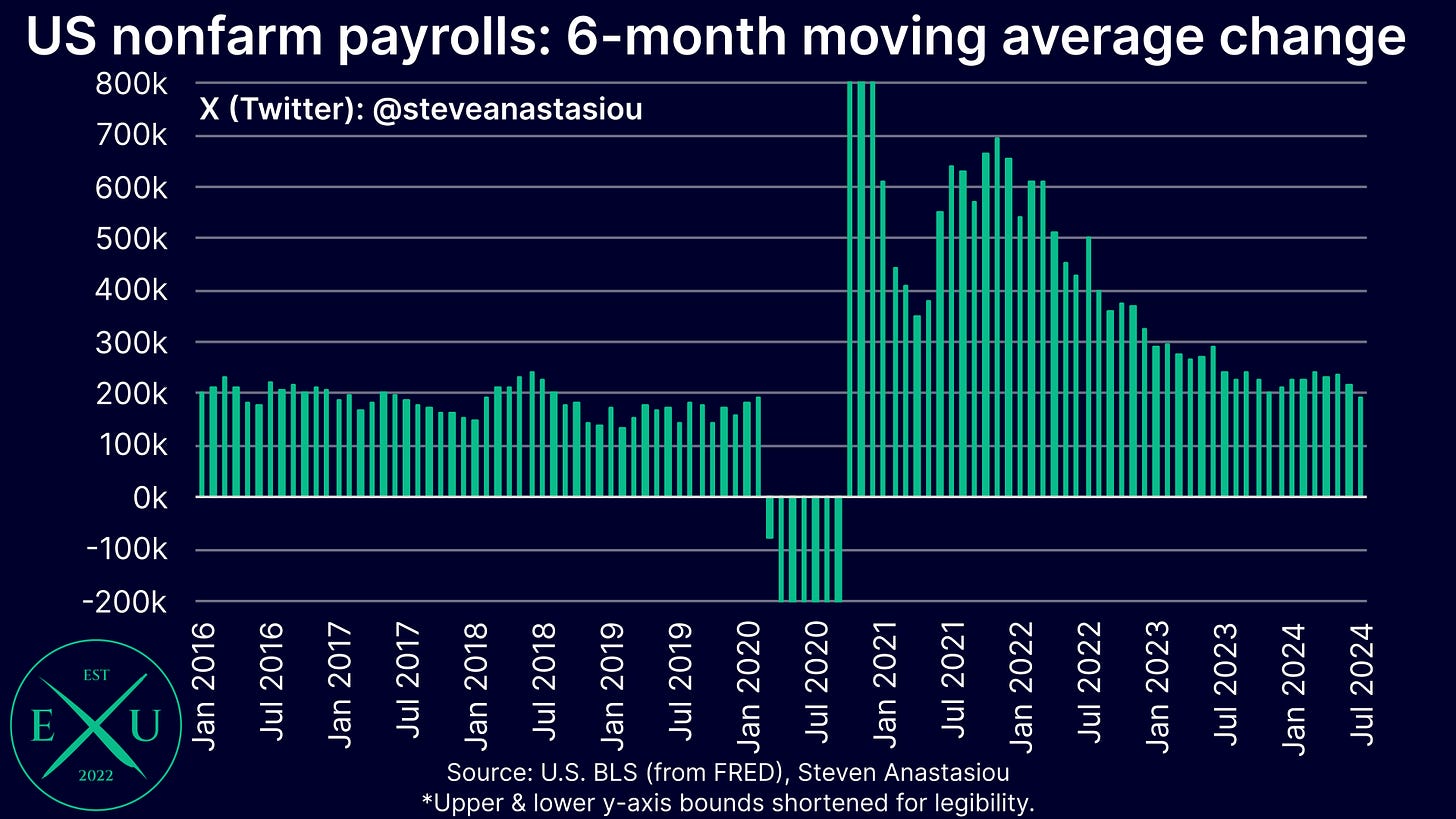
3-month moving average growth increased slightly, rising to 170k (from 168k), while 6-month moving average growth fell to 194k (from 218k), the lowest level since September 2020.
On a YoY basis, nonfarm payroll growth remained at 1.6%, which is only slightly below its 2015-19 average of 1.7%.
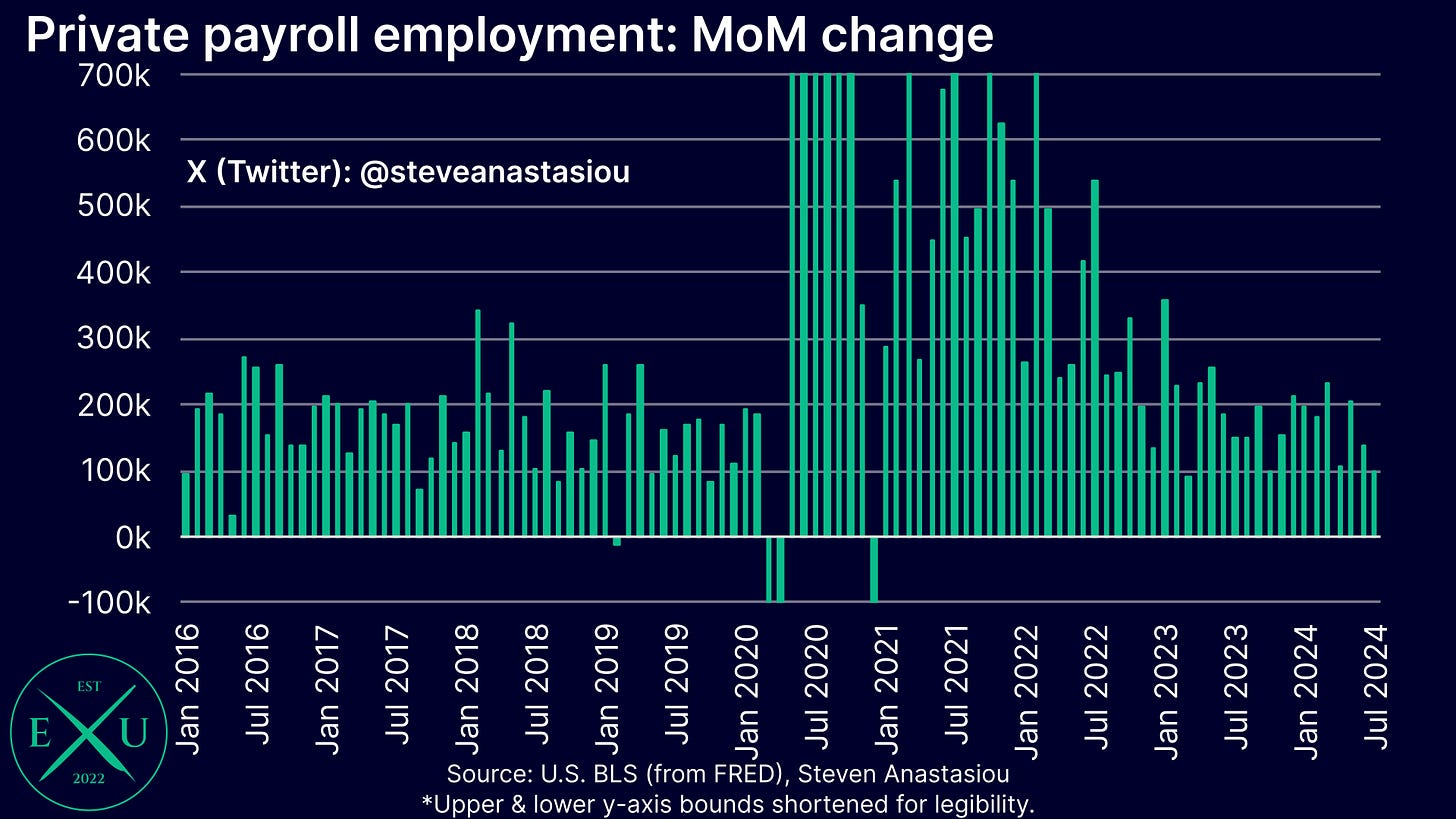
Focusing on the more cyclical private nonfarm payrolls, MoM growth of 97k was recorded, the slowest pace of growth that’s been seen since March 2023.
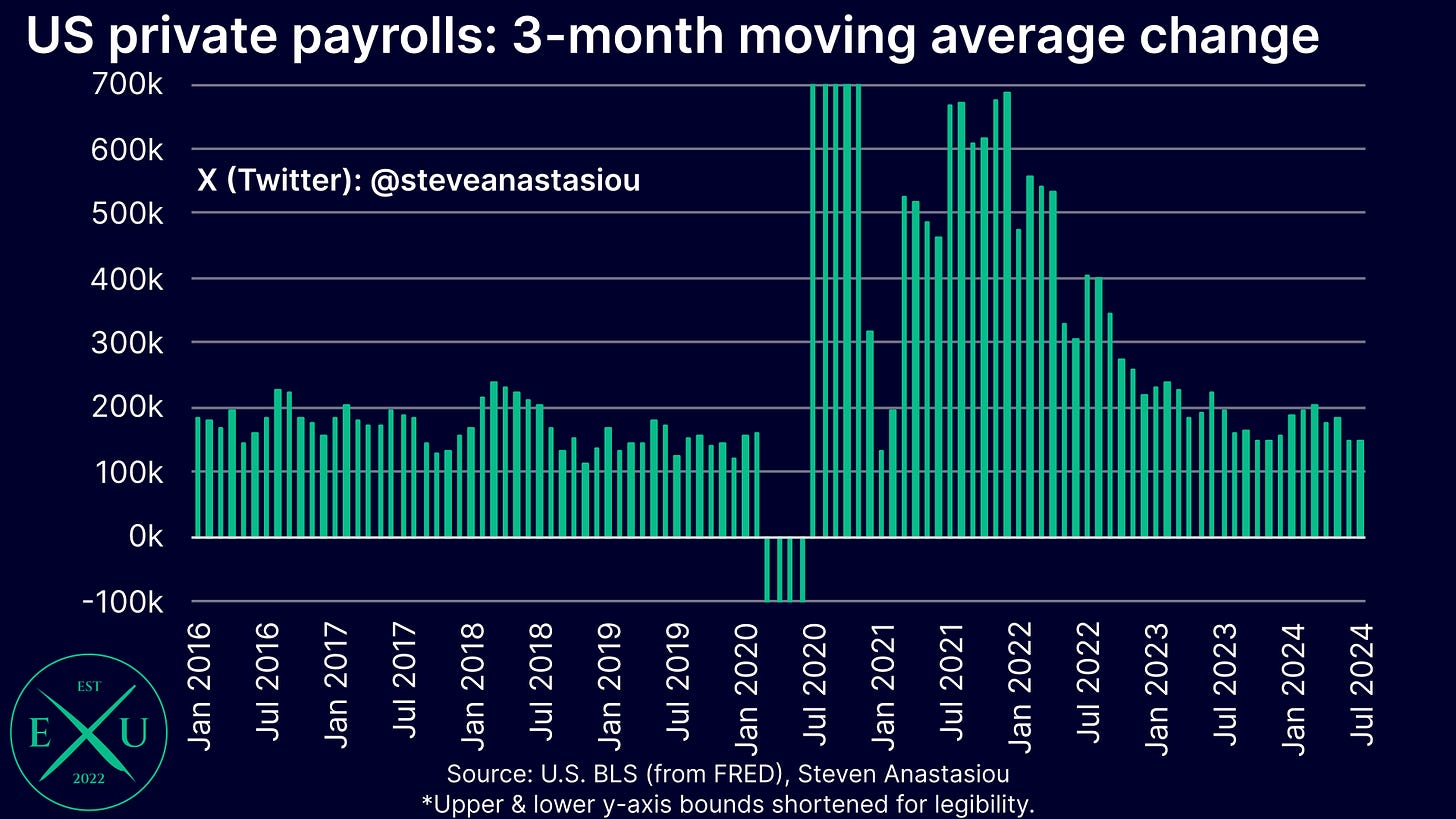
3-month annualised growth fell to 146k (from 150k), to its lowest level since January 2021. 6-month annualised growth fell to 160k (from 177k), to its lowest level since December.
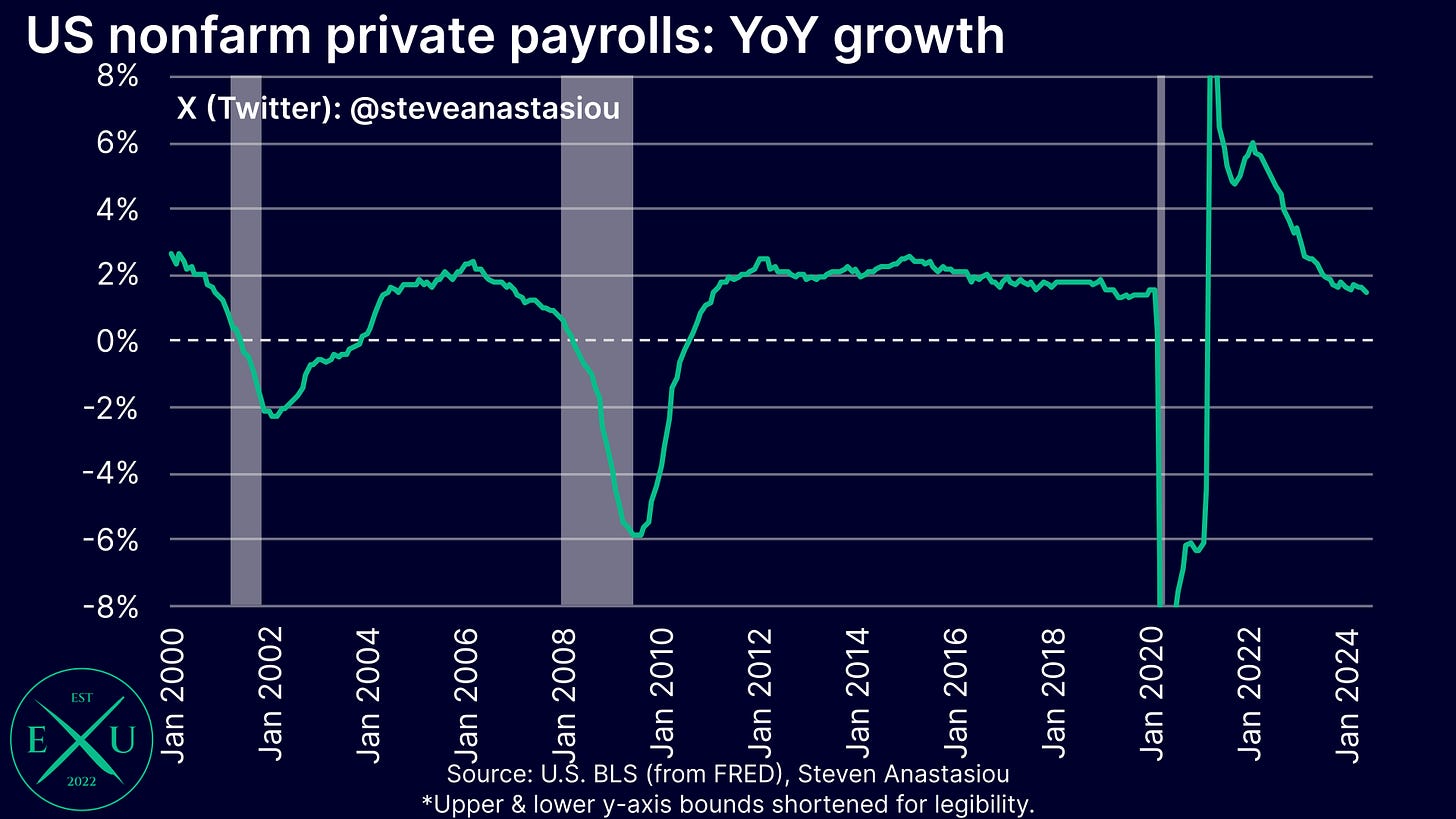
On a YoY basis, private nonfarm payroll growth has fallen to 1.4%, well below the 2015-19 average of 1.9%.
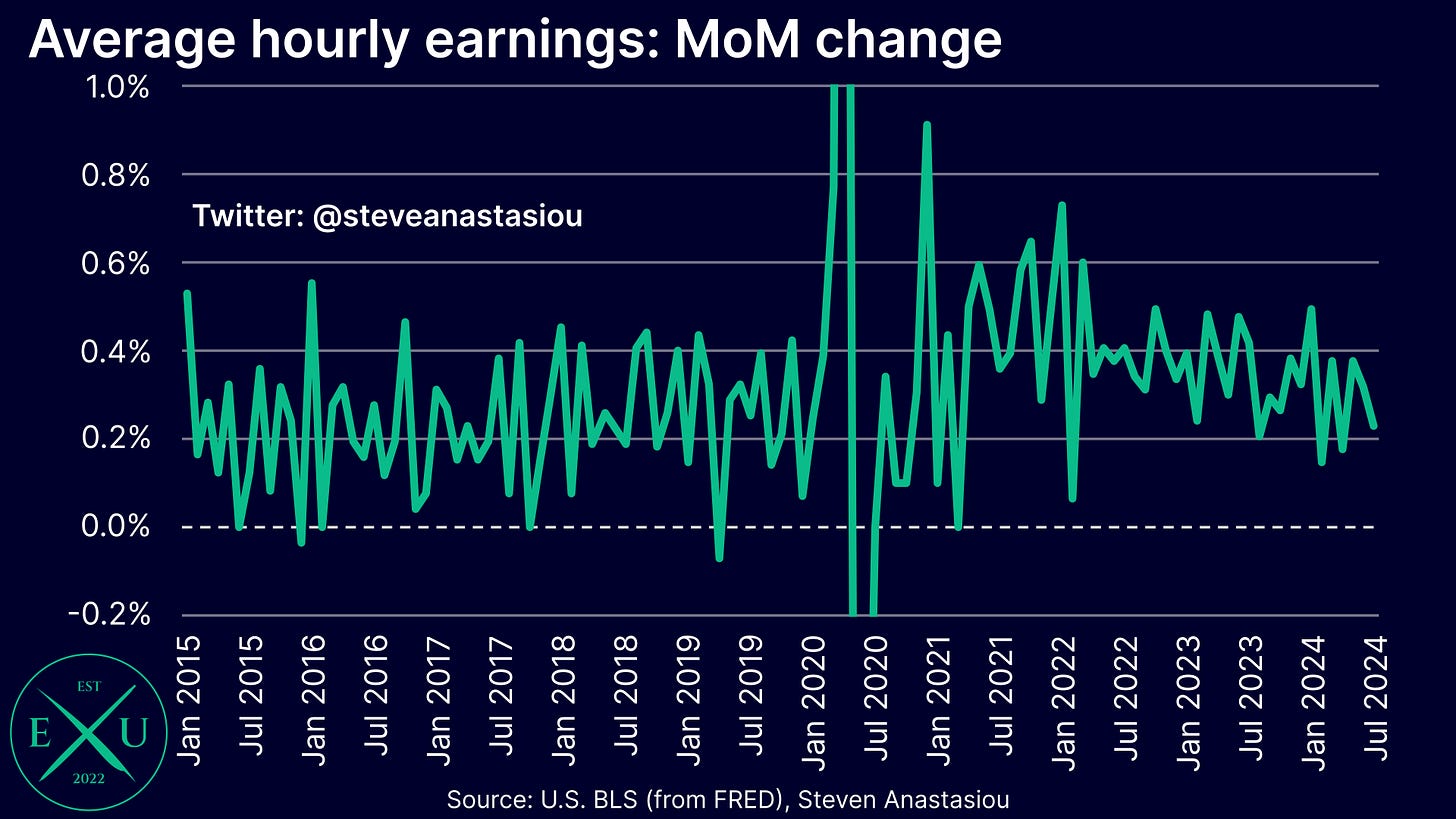
Wage growth also continued to slow in July, providing a further sign of growing labour market slack.
MoM growth was 0.23%, the slowest pace of growth since April.
While 3-month annualised growth rose to 3.7% (from 3.5%), 6-month annualised growth fell to 3.3% (from 3.8%) which is now largely in-line with its 2018-19 average of 3.2%. YoY growth fell to 3.6% (from 3.8%).
Analysing the potential weather related impact on July’s national employment figures
While there has been a significant broader discussion about the extent to which weather related factors (with Hurricane Beryl making landfall on the central coast of Texas on 8 July) may have been behind the significant additional weakening in July’s employment figures, a deeper analysis suggests that it may not have been overly material, with the BLS noting that “Hurricane Beryl had no discernible effect on the national employment and unemployment data for July”.
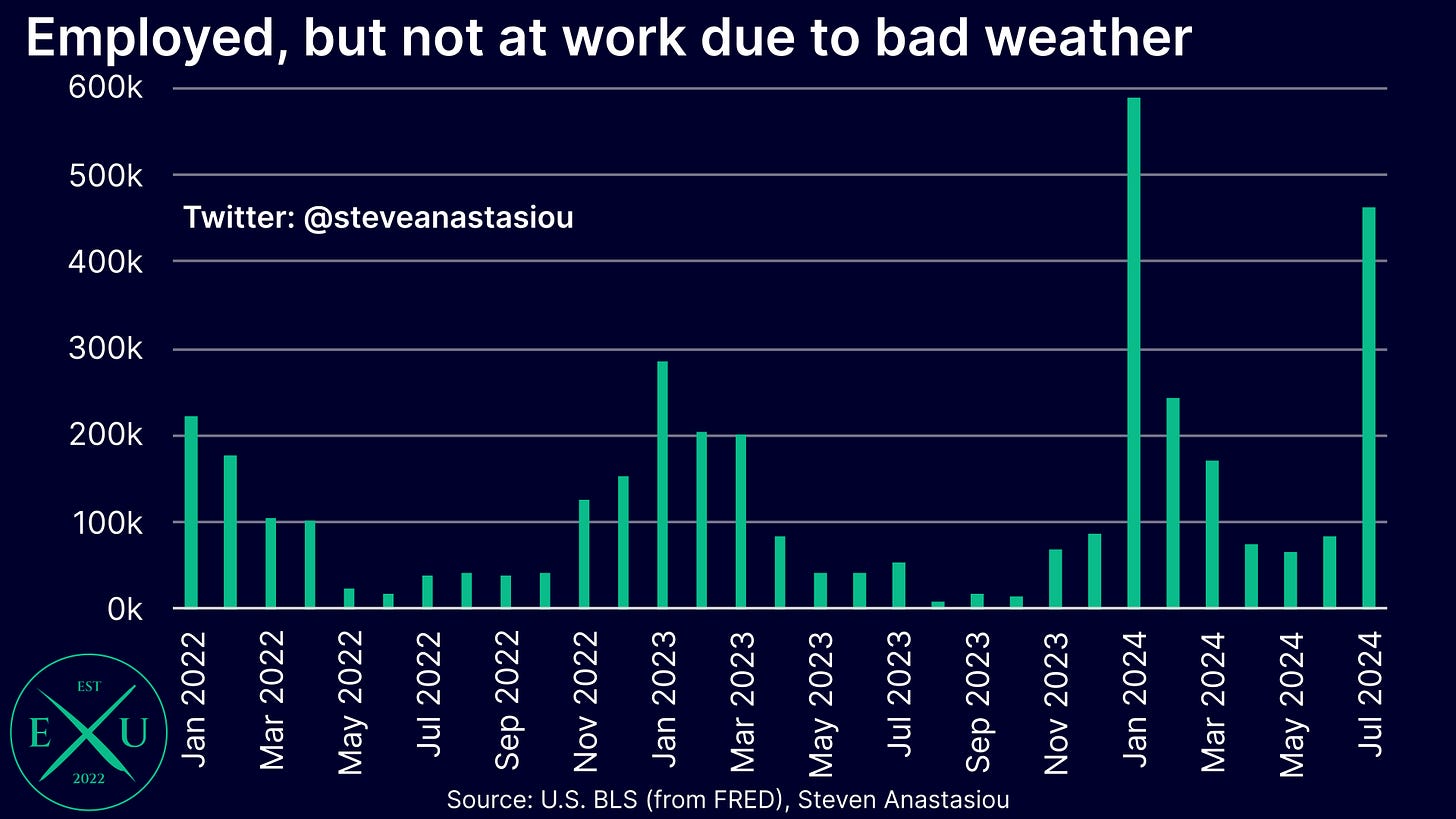
The focus on weather related impacts comes after the BLS reported that 461k individuals with a job were not at work during the July reference week, versus the 2014-2023 July average of just 37k.
The first key point to note in regards to this data point, is that the household survey — from which the unemployment rate is generated — counts these 461,000 individuals as employed.
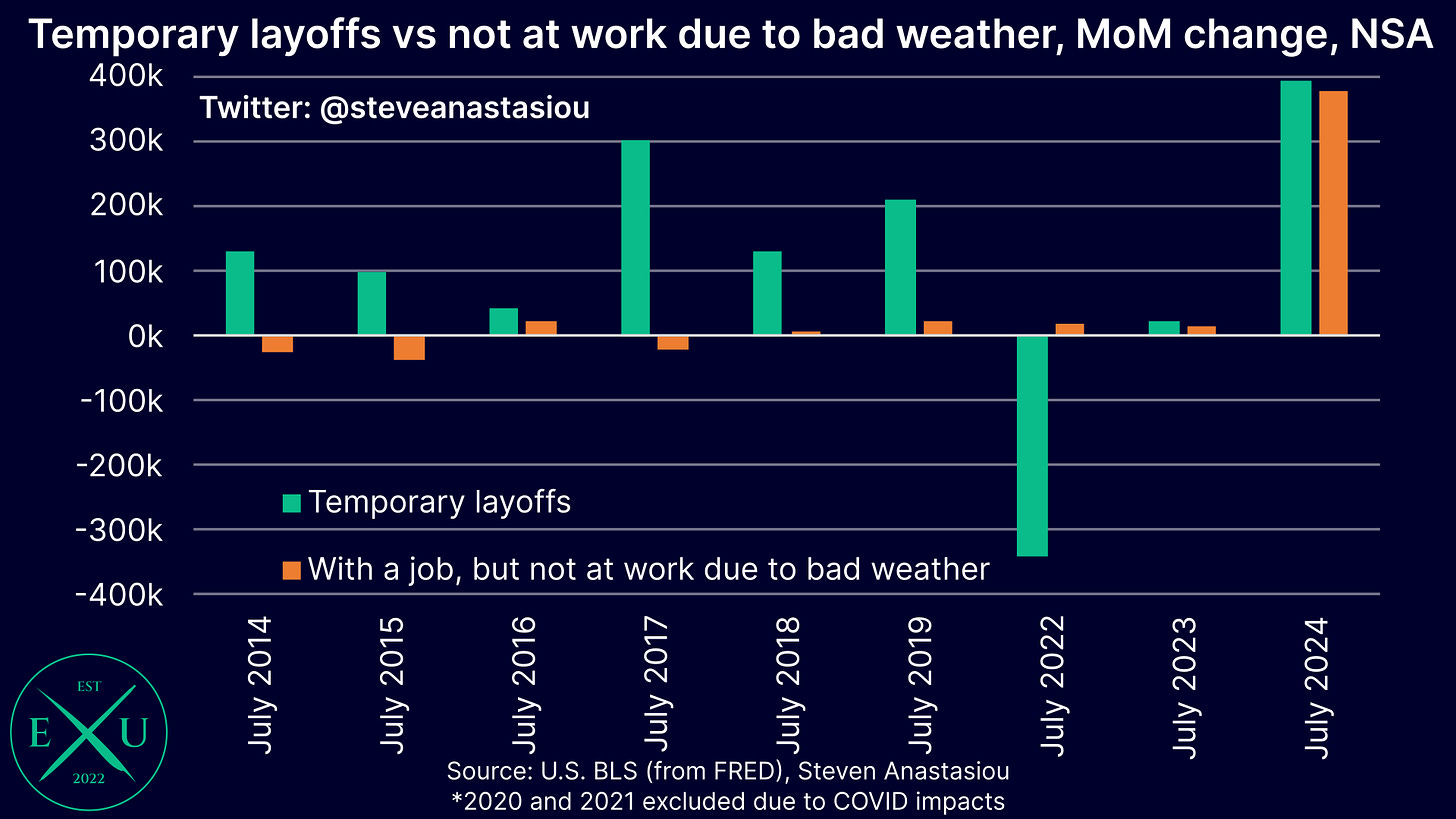
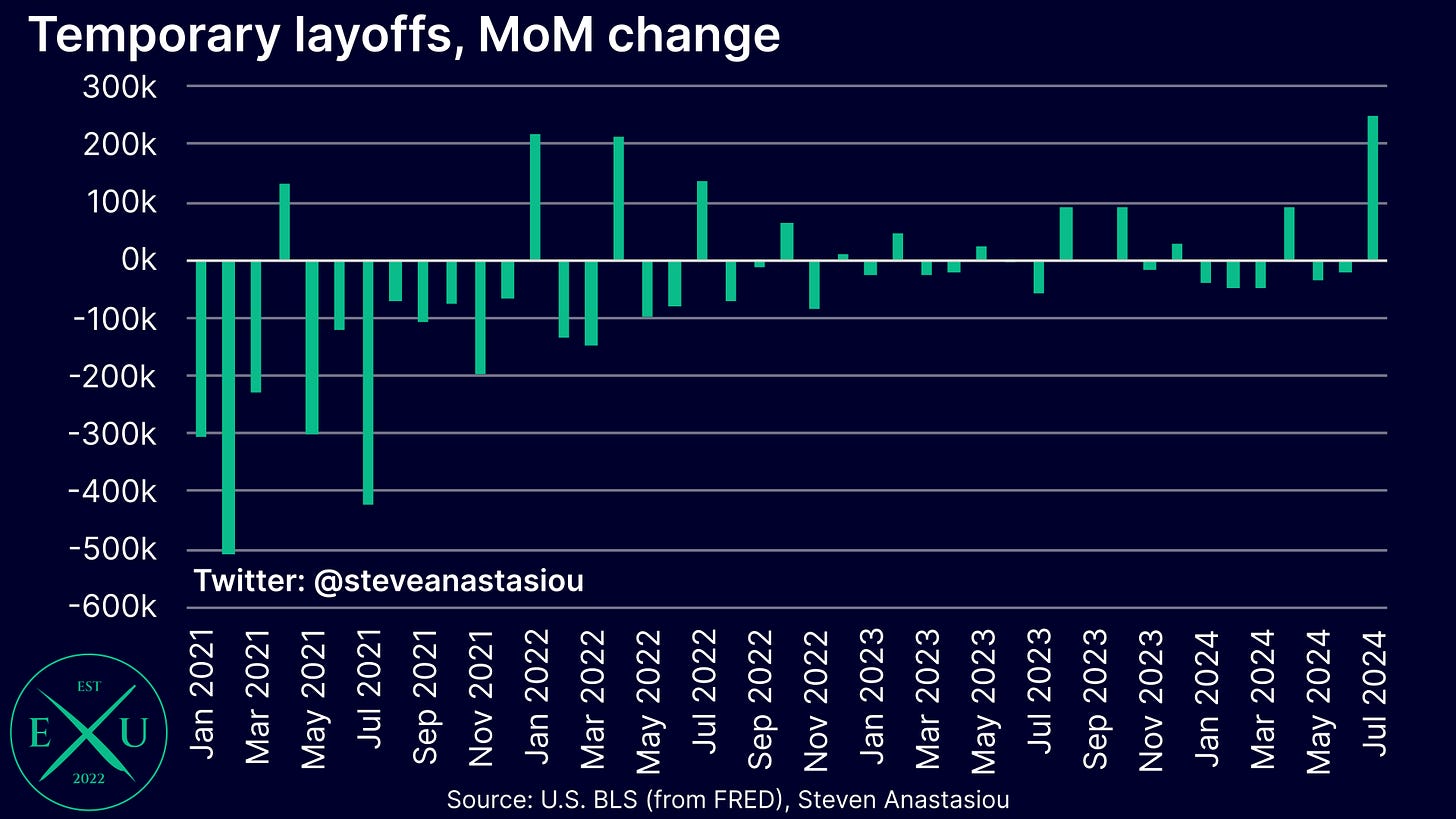
The potential upward impact on the unemployment rate from weather related impacts instead potentially stems from the increase in those that were temporarily laid off, which rose by 249,000 (393,000 non-seasonally adjusted) in July.
While this was a relatively large jump, indicating the potential for some weather related impacts, large MoM increases have been seen in July in prior years without large spikes in individuals not going to work for weather related reasons. In July 2017 and July 2019, temporary layoffs increased by 300k and 209k, respectively, without a significant increase in people not at work due to bad weather. While this doesn’t preclude bad weather driving the bulk of the increase in temporary layoffs in July 2024, it also serves to show that much of the increase in temporary layoffs may have also been caused by other factors.
Though the number of seasonally adjusted temporary layoffs does appear to have been unusually high in July, supporting arguments that it may have been driven by weather related impacts and that at least some of July’s increase may be unwound in August.
In regards to the impact on nonfarm payrolls, only 1 hour of pay needs to be received in the pay period that includes the 12th day of the month, for an individual to be counted as employed. Given that the BLS has previously reported that ~73% of employees (based on February 2023 data) are paid on a biweekly, semimonthly or monthly basis, it is the ~27% of employees that are paid weekly, that are the most likely subset to have potentially not been counted as employed in July.
Though given that many individuals may have received at least some of their usual weekly pay (perhaps either prior to the landfall of Hurricane Beryl or after it had dissipated), this may have acted to materially reduce the impact on national nonfarm payrolls.
As a result, while Hurricane Beryl may have had a material impact on employment data for Texas, it may not have been significant enough to have a material discernible impact on national nonfarm payroll data.
A key area in which Hurricane Beryl may have impacted the monthly employment data is instead in regards to average weekly hours, which fell to their lowest level since January. While not referring specifically to July’s employment data, the BLS notes that “the impact of severe weather on hours estimates typically, but not always, results in a reduction in average weekly hours”.
All-in-all, given the ultimate uncertainty of the extent to which weather events impacted the July employment data, it seems reasonable to take the BLS’ statement — that “Hurricane Beryl had no discernible effect on the national employment and unemployment data for July” — largely at face value, with the BLS having much more additional information at its disposable to make such a conclusion.
Recessionary indicators continue to pile up within the jobs data
While nonfarm payroll growth has clearly slowed and continues to trend lower, given that continued MoM growth is being recorded, at first glance, nonfarm payrolls are not sending a recessionary signal.
Though what must be critically noted, is that nonfarm payroll growth is being propped up by significantly above average population growth. As a result, instead of nonfarm payroll growth being relatively solid (which would have been the likely conclusion pre-COVID when the break-even nonfarm payroll growth rate was far lower), it is weak. This is clearly indicated by the major increases that have been recorded in the unemployment rate and the U-6 unemployment rate since 2H23, which shows that job growth is well below the level needed to account for population growth.
Given the major weakening that’s been seen in the US employment market — which I have been regularly calling out over the course of this year (see: “Signs of a significant weakening are now being seen in the US jobs market”, “A roaring economy and a recession, simultaneously: the latest US jobs data is all over the shop”, “The household survey is flashing a recession”, “Finely balanced”, “The latest US jobs report is not as strong as it may seem”, “US jobs report points to the growing risk of a recession”, “Key JOLTS indicators weaken further in June, raising recession concerns” and “Fed sets the stage for a September rate cut as more job market data shows growing weakness”) — the number of recessionary signals from the BLS’ employment market data are numerous and continue to grow.
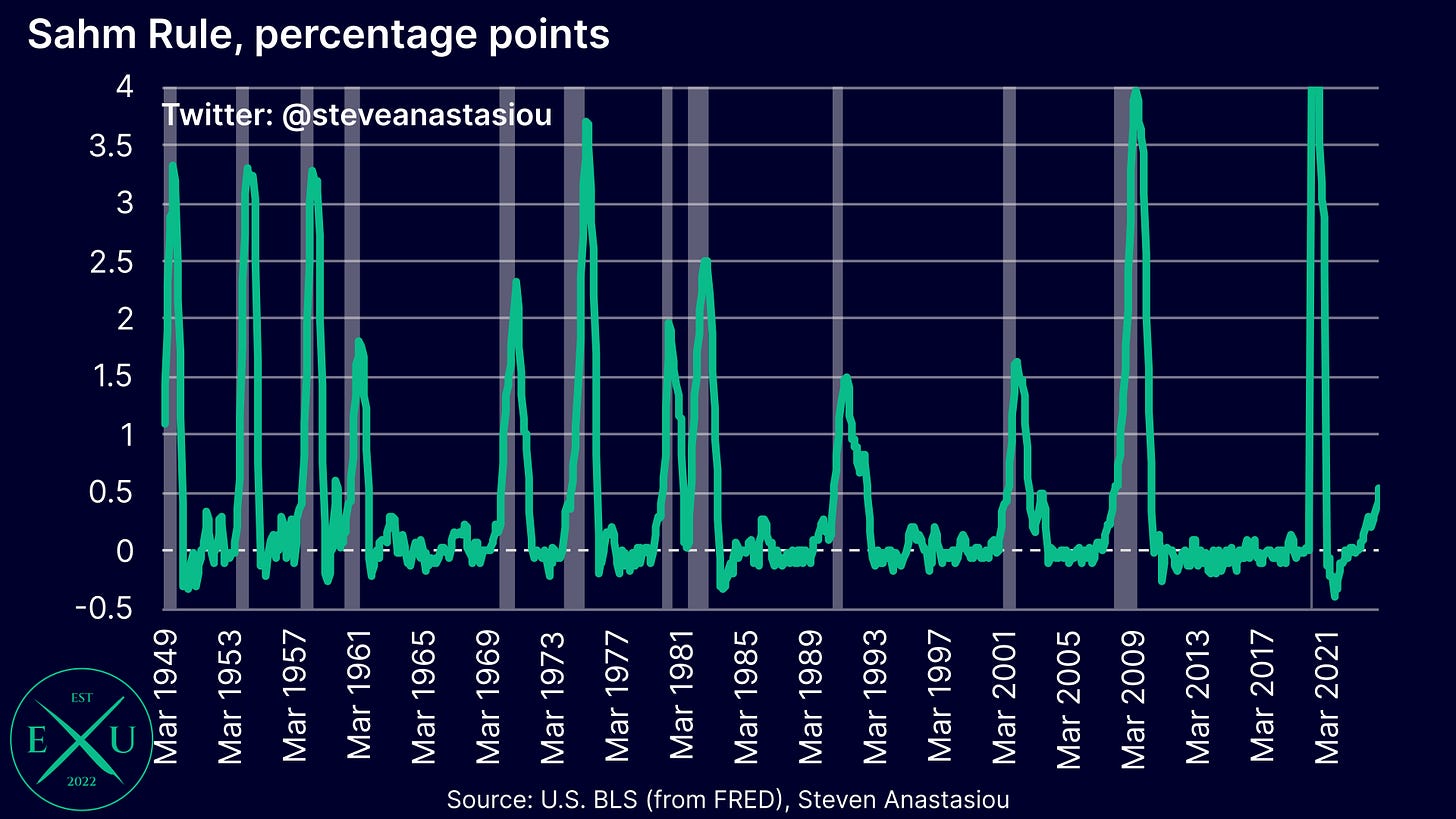
The latest one is the so-called “Sahm Rule” which compares the current 3-month moving average change in the unemployment rate to its trough over the past 12-months. Since 1949, when the 3-month moving average rises by more than 0.50 percentage points, the US economy has almost always been in a recession. In July, the Sahm Rule rose to 0.53 percentage points.
I say almost always, as while many take the Sahm Rule as a concrete “rule” that means the US must be in a recession, this is not the case. While a recession did occur relatively soon thereafter, the Sahm rule hit 0.60 percentage points in November 1959 and fell back to 0.03 percentage points in February 1960, with a recession not beginning until May 1960. The Sahm rule also hit 0.50 percentage points in July and August 2003 without a recession occurring — this is why I said more than 0.50 percentage points versus the generally accepted “rule” of 0.50 percentage points.
As Fed Chair Powell stated in his FOMC press conference (emphasis added): “We’re aware of [the Sahm] rule, which is really, you know, a statistical thing that has happened through history, a statistical regularity is what I’d call it. It’s not like an economic rule where it’s telling you something must happen.”
Despite not being a concrete rule, the very strong statistical regularity of this indicator means that individuals have rightly taken notice of it breaching 0.50 percentage points.
Its breaching of this level is made all the more significant by the fact that a wide-array of other statistical regularities (many of which I have been pointing out for many months) also suggest that a recession is potentially already underway, or not far away.
Below, I provide a list of 15 key indicators that suggest that either 1) the US economy is already in a recession; 2) the US economy is nearing a recession or 3) the US economy/jobs market has weakened materially:
1) Unemployment rate, seasonally/non-seasonally adjusted, YoY change, 3-month moving average
An alternative to the Sahm rule, is to simply look at the YoY change in the unemployment rate on a 3-month moving average basis — since 1949, when this indicator has risen by 6.5% or more on a seasonally adjusted basis, a recession has always occurred.
In July, the 3-month moving average of the unemployment rate had risen by 15.0%.


