US Jobs Report Review: a key recession indicator has been triggered
US cyclical employment growth ex-manufacturing has turned YoY negative - history says that a US recession may now only be months away.
Executive Summary
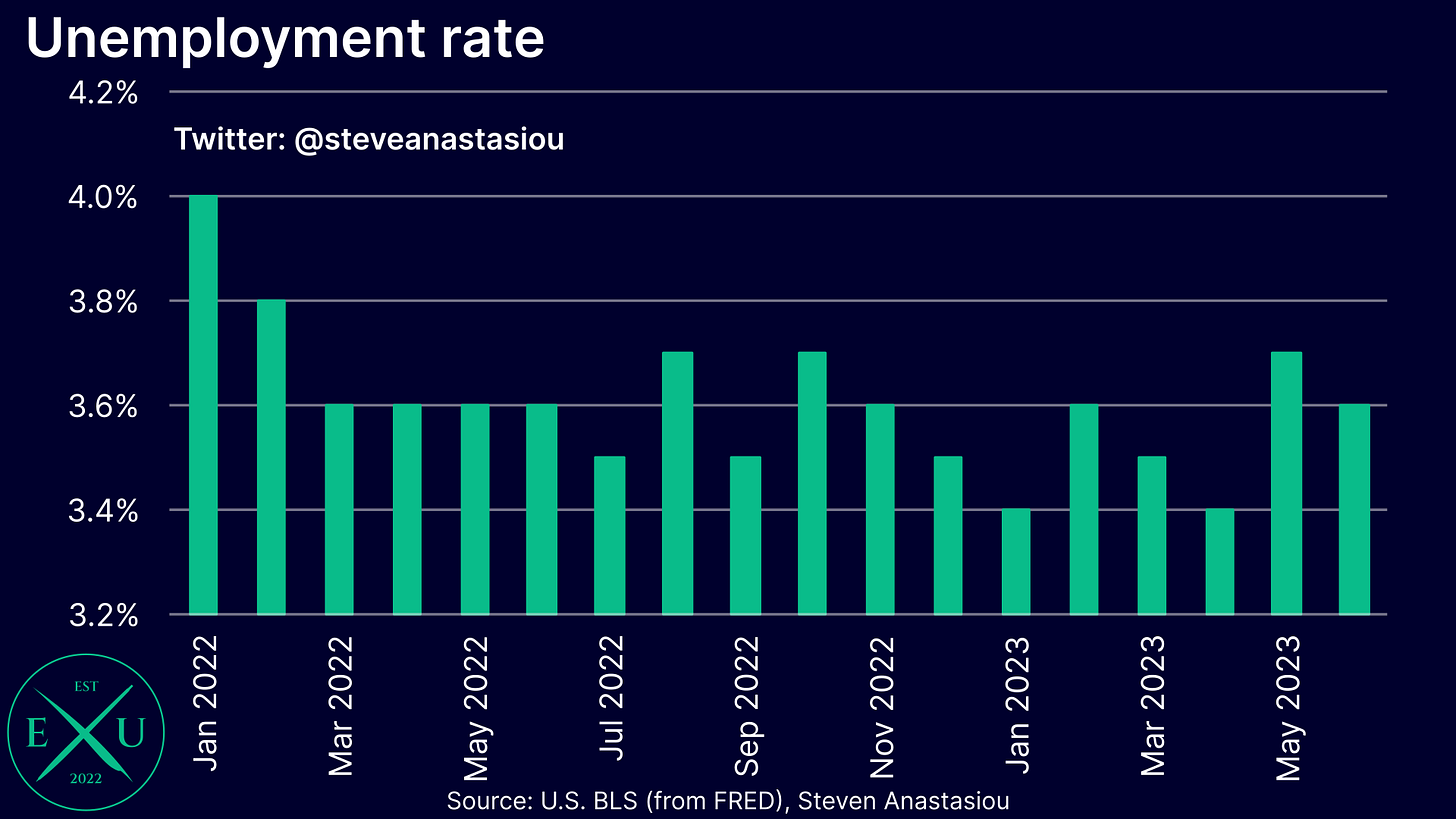
The US unemployment rate fell from 3.7% in May to 3.6% in June — this marks the third time since August 2022 that the US unemployment rate hit 3.7%, only to move lower in the following month.
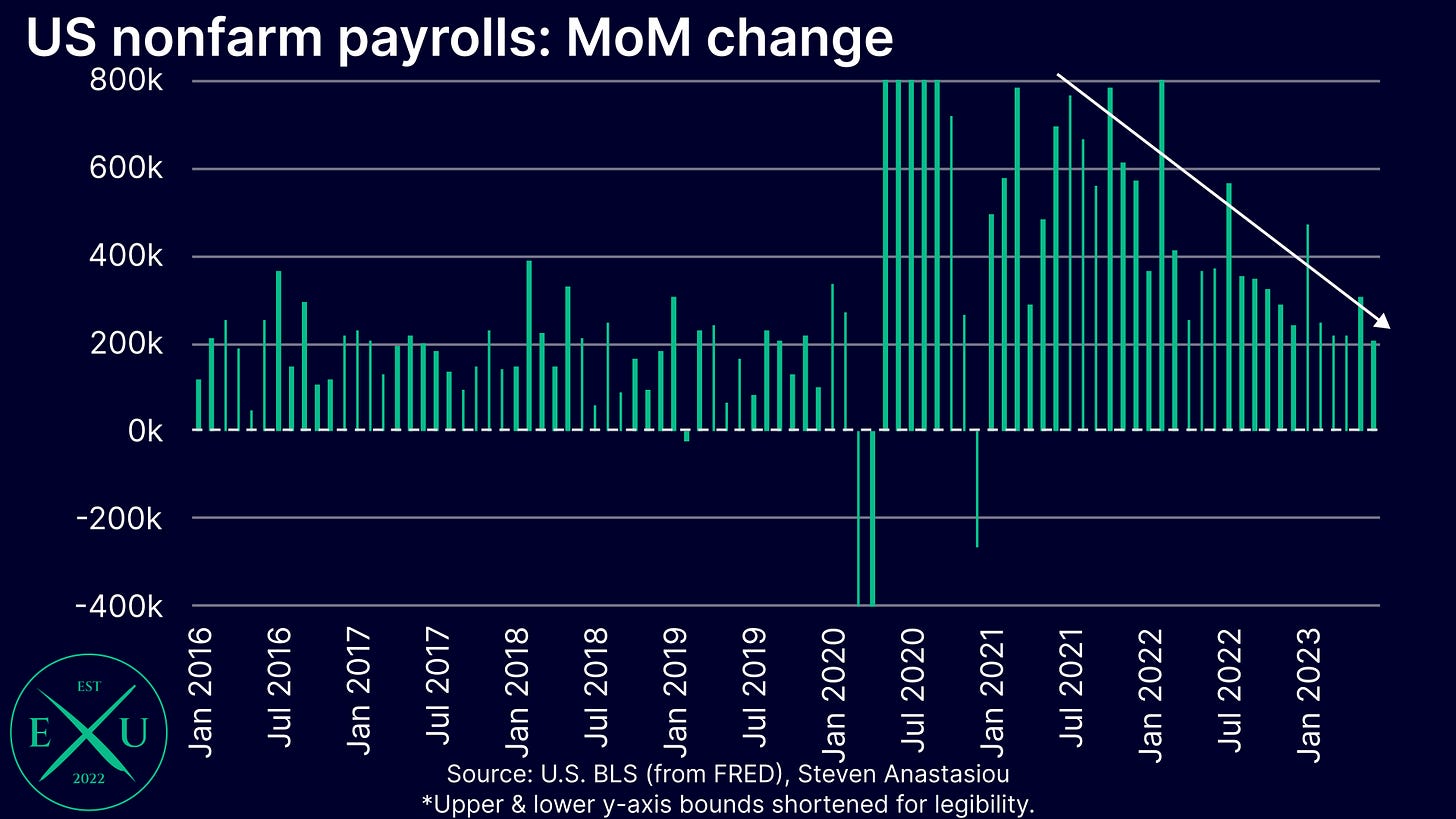
Total nonfarm payrolls grew at the slowest monthly pace since December 2020 in June.
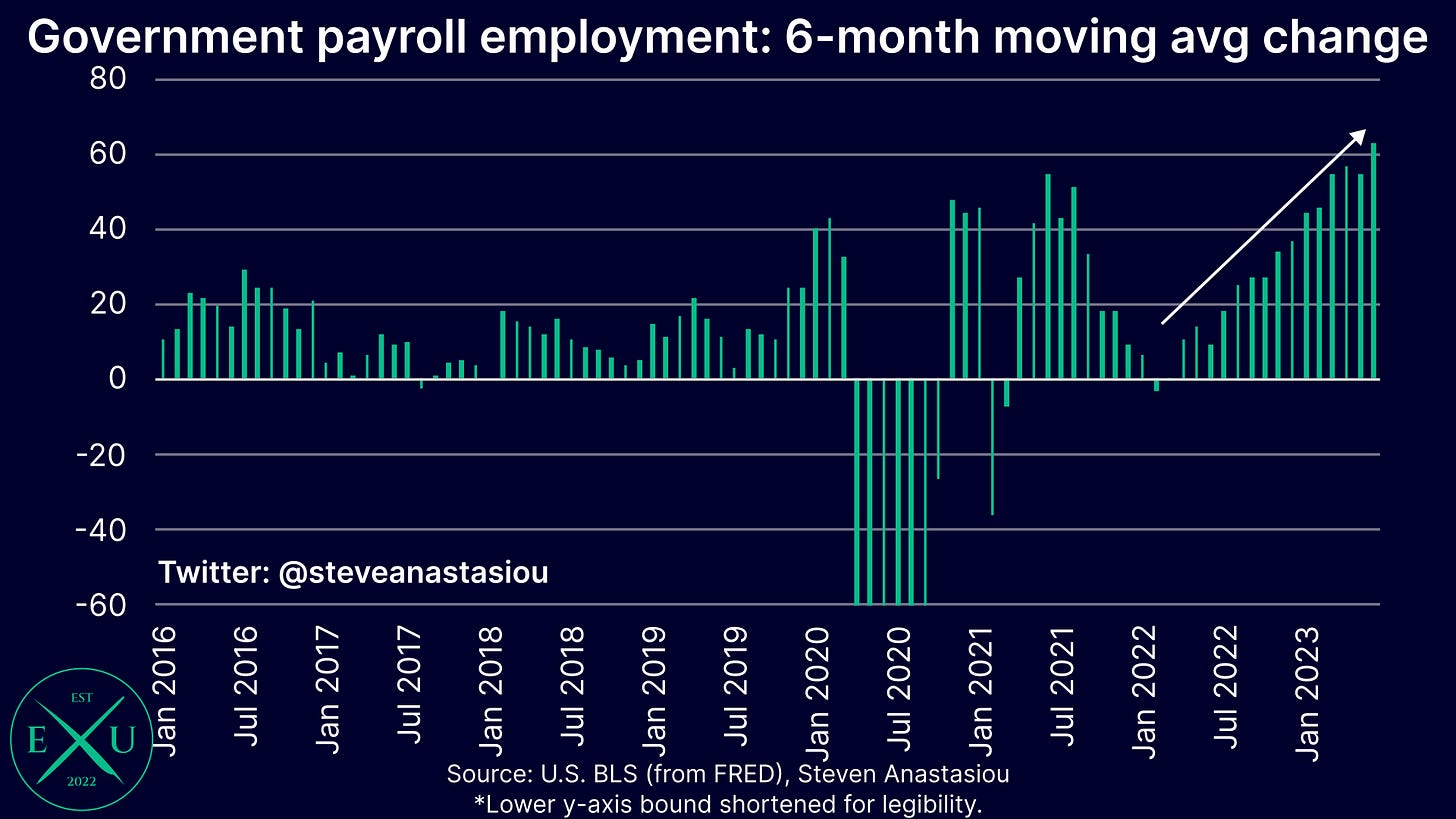
The extent of the recent moderation in job growth has been masked by government jobs, which on a 6-month moving average basis, grew at a record post-COVID pace in June.
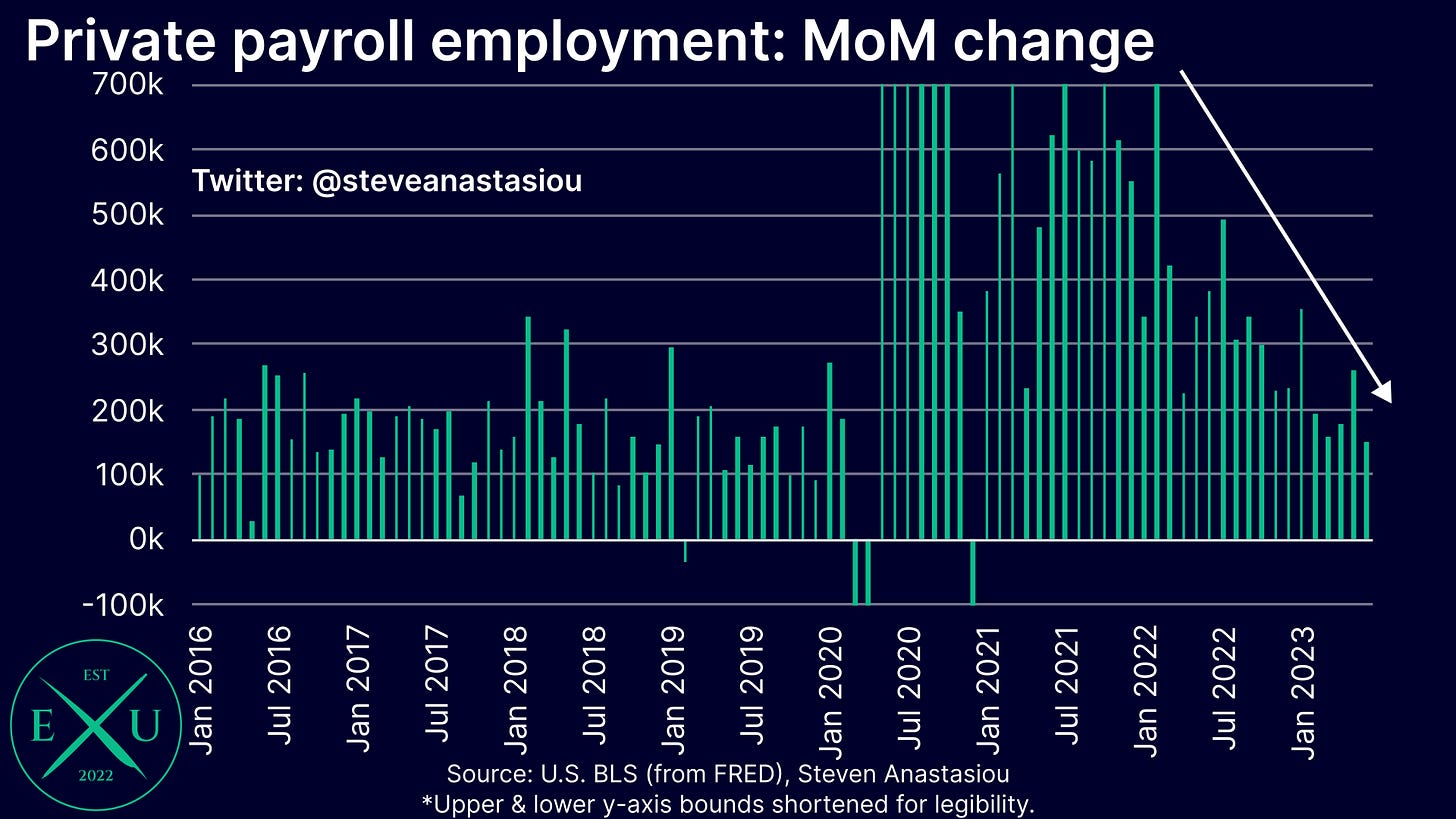
Monthly private payroll growth of 149k was the lowest since December 2020, and below the 2016-19 average of 168k.
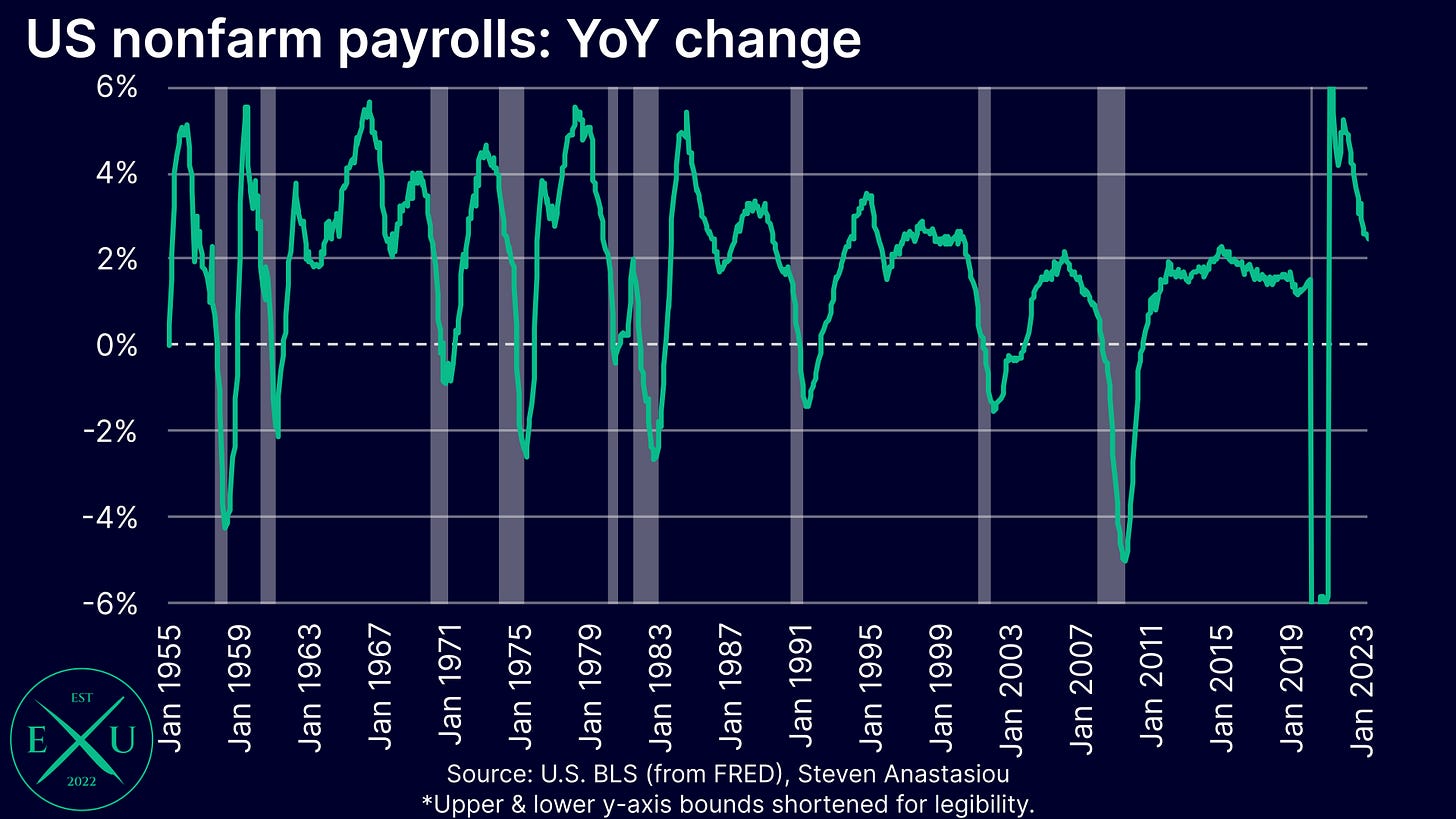
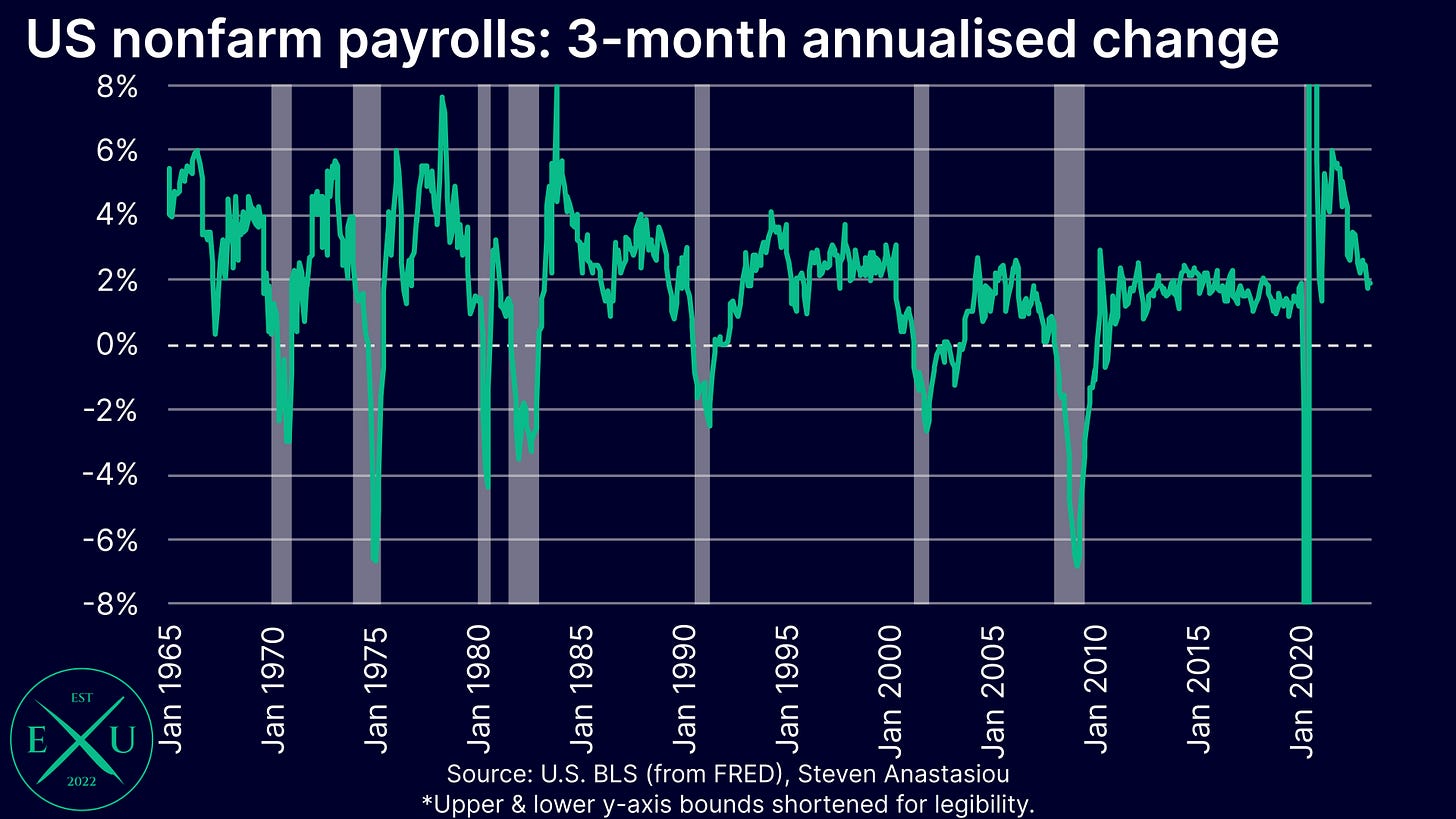
While annual nonfarm payroll growth of 2.4% is relatively robust, 3-month annualised growth has declined to 1.9%.
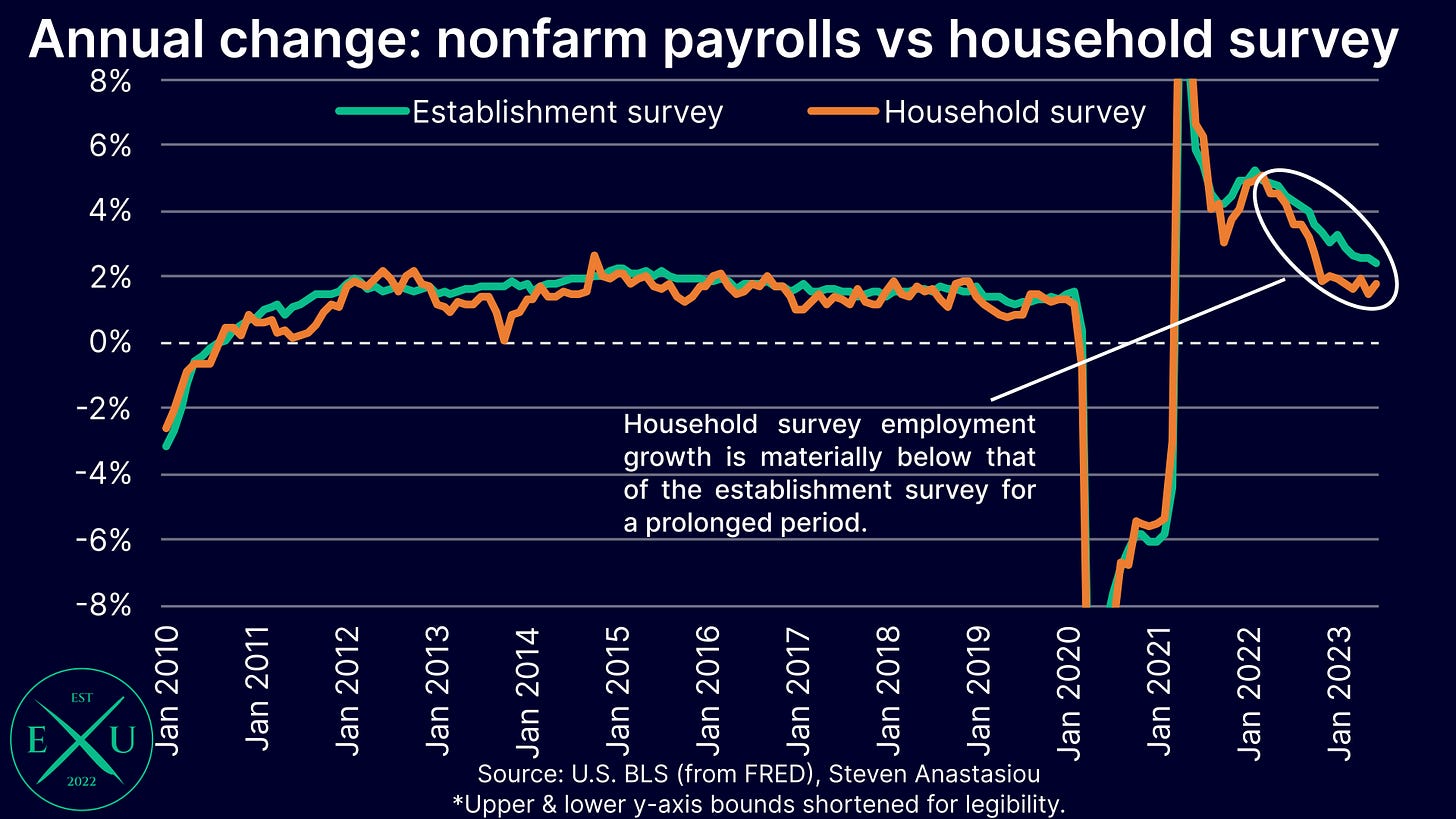
Annual nonfarm payroll growth (2.4%) continues to significantly exceed annual employment growth as measured by the household survey (1.8%), indicating that there could be an issue with the BLS’ business net birth-death estimates (which can occur around turning points in the economy, such as during a shift towards a recession).
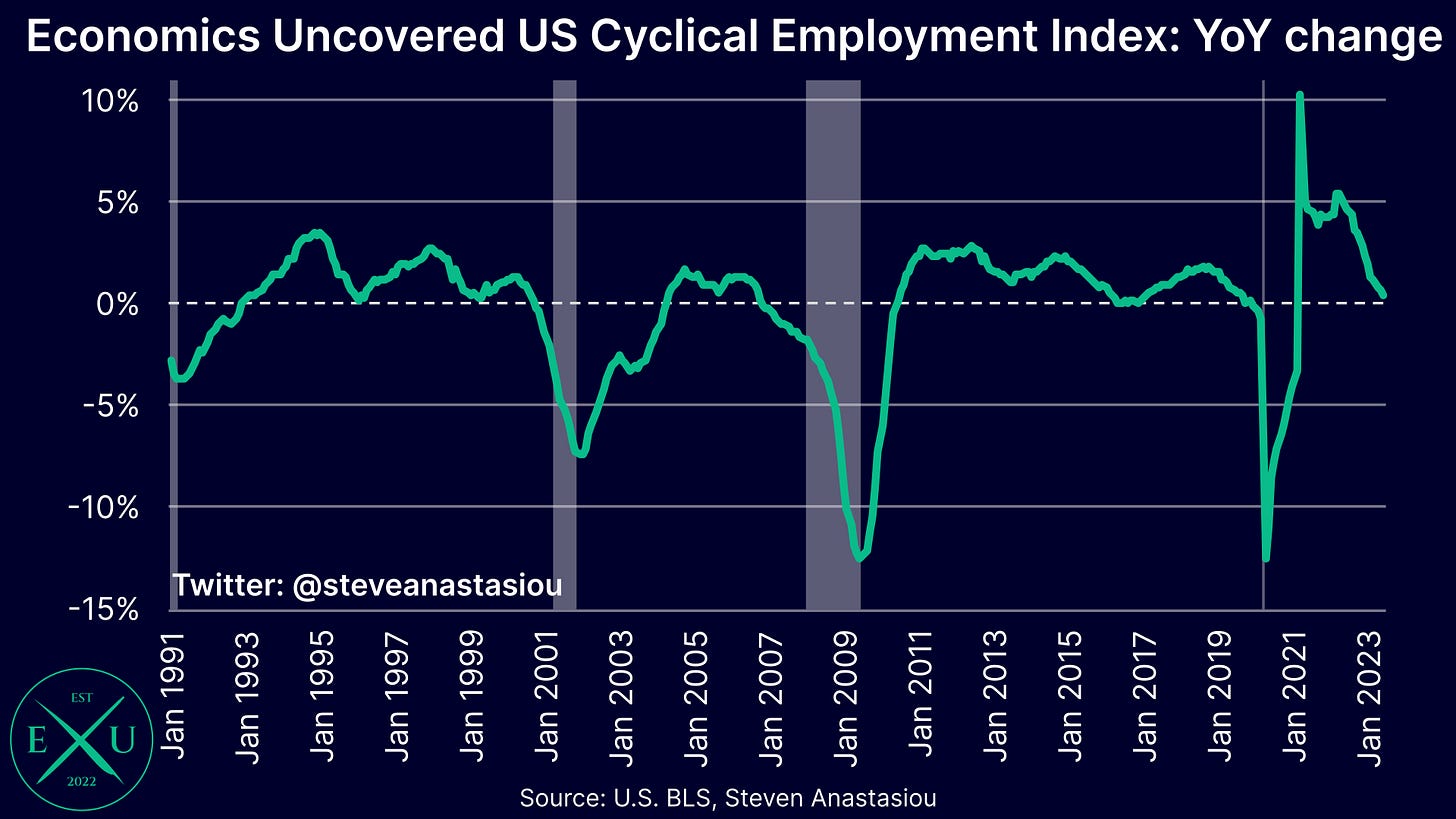
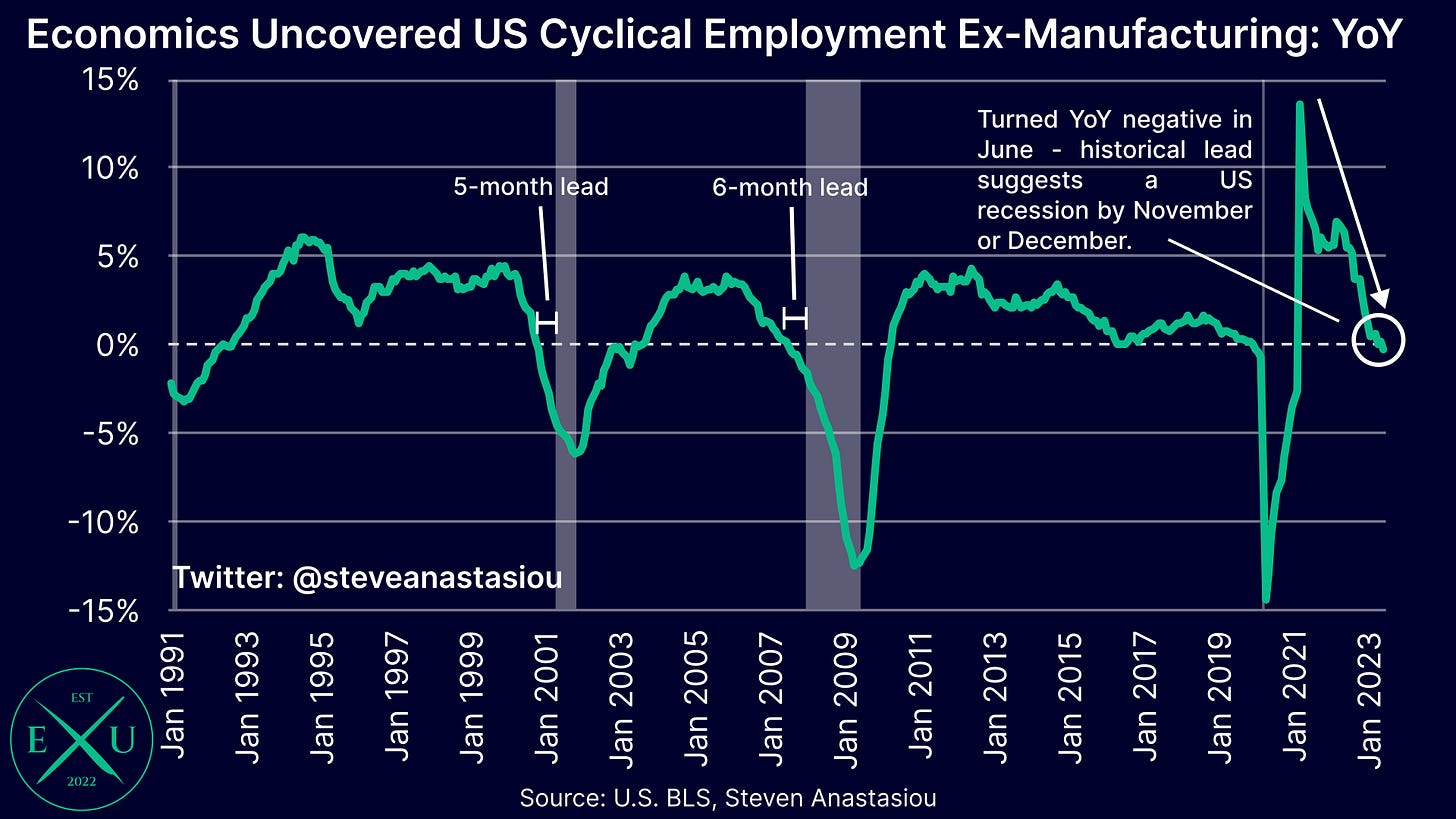
Cyclical employment growth, as measured by the Economics Uncovered US Cyclical Employment Index, fell to just 0.4% YoY in June. Ex-manufacturing, the index turned YoY negative. After this occurred in 2000 and 2007, the US economy entered a recession just 4 and 5 months later respectively.
The unemployment rate again falls back after hitting 3.7%
After spiking 0.3 percentage points in May, the US unemployment rate settled back down to 3.6% in June. This is the third time that the US unemployment rate has hit 3.7% since August 2022, only to move lower in the next month. The last time that the US unemployment rate was above 3.7%, was February 2022.
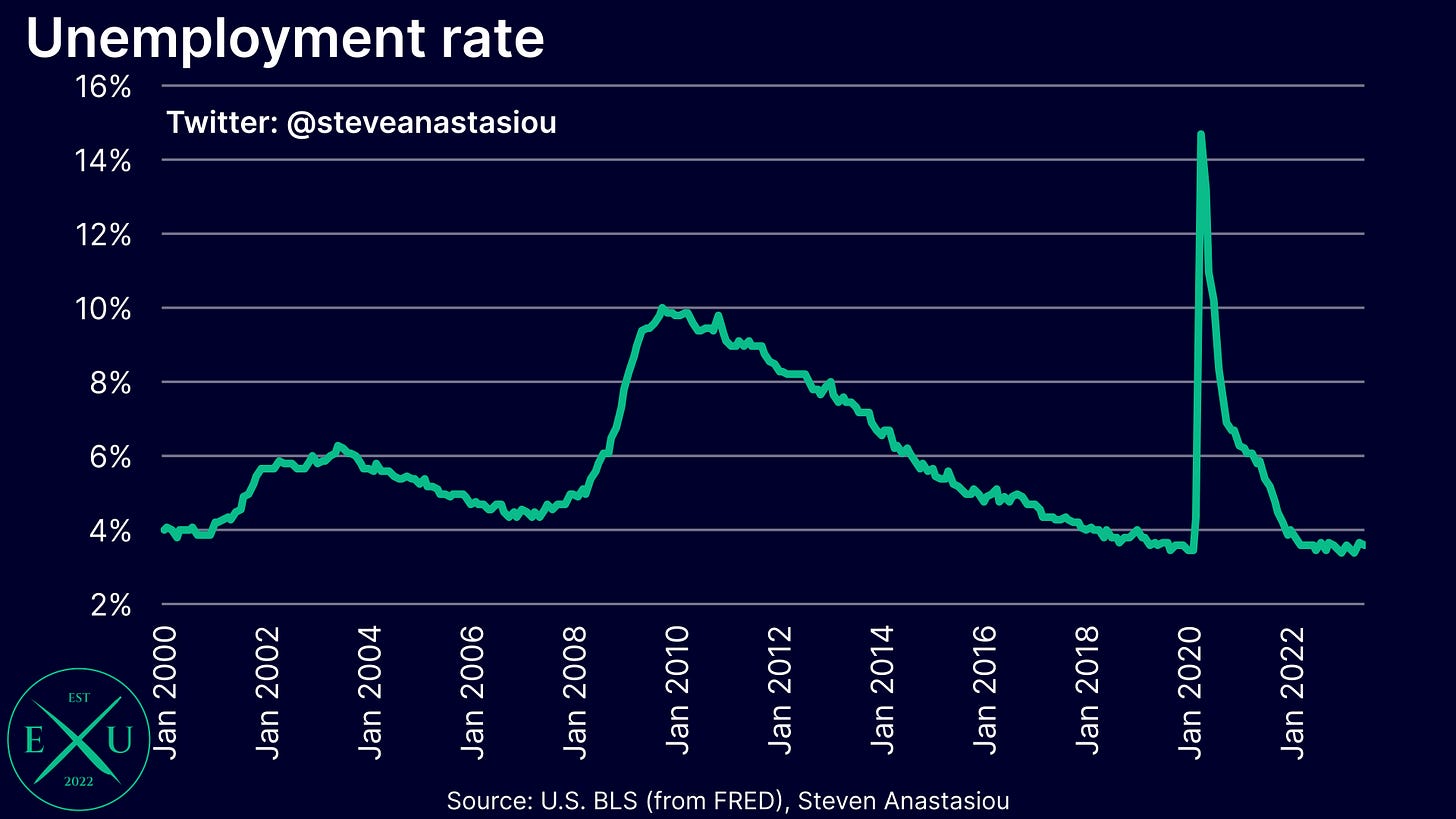
Looking at the unemployment rate on a longer time frame, one can see that it continues to remain low by historical standards.
Monthly job growth the weakest since December 2020 — government jobs are masking the extent of the weakness
While the unemployment rate remains low, there are clear signs of a weakening US employment market.
In terms of the establishment survey numbers for June, 209k nonfarm payrolls were estimated to have been added, marking the weakest monthly growth since December 2020.
Nevertheless, monthly growth remained above its 2016-19 average of 181k.
While still a relatively OK number on the surface, the weakening in jobs growth has been masked by government payrolls, which on a 6-month moving average basis, saw record post-COVID growth in June.
This meant that private payrolls grew by just 149k in June, which was the lowest monthly increase since December 2020 and below the average monthly growth rate of 168k across 2016-19.
Annual employment growth remains at relatively solid levels, 3-month annualised back to pre-COVID levels
With monthly nonfarm payroll growth weakening, so too has annual employment growth. Nevertheless, the 2.4% annual growth rate for total nonfarm payrolls in June remains relatively robust.
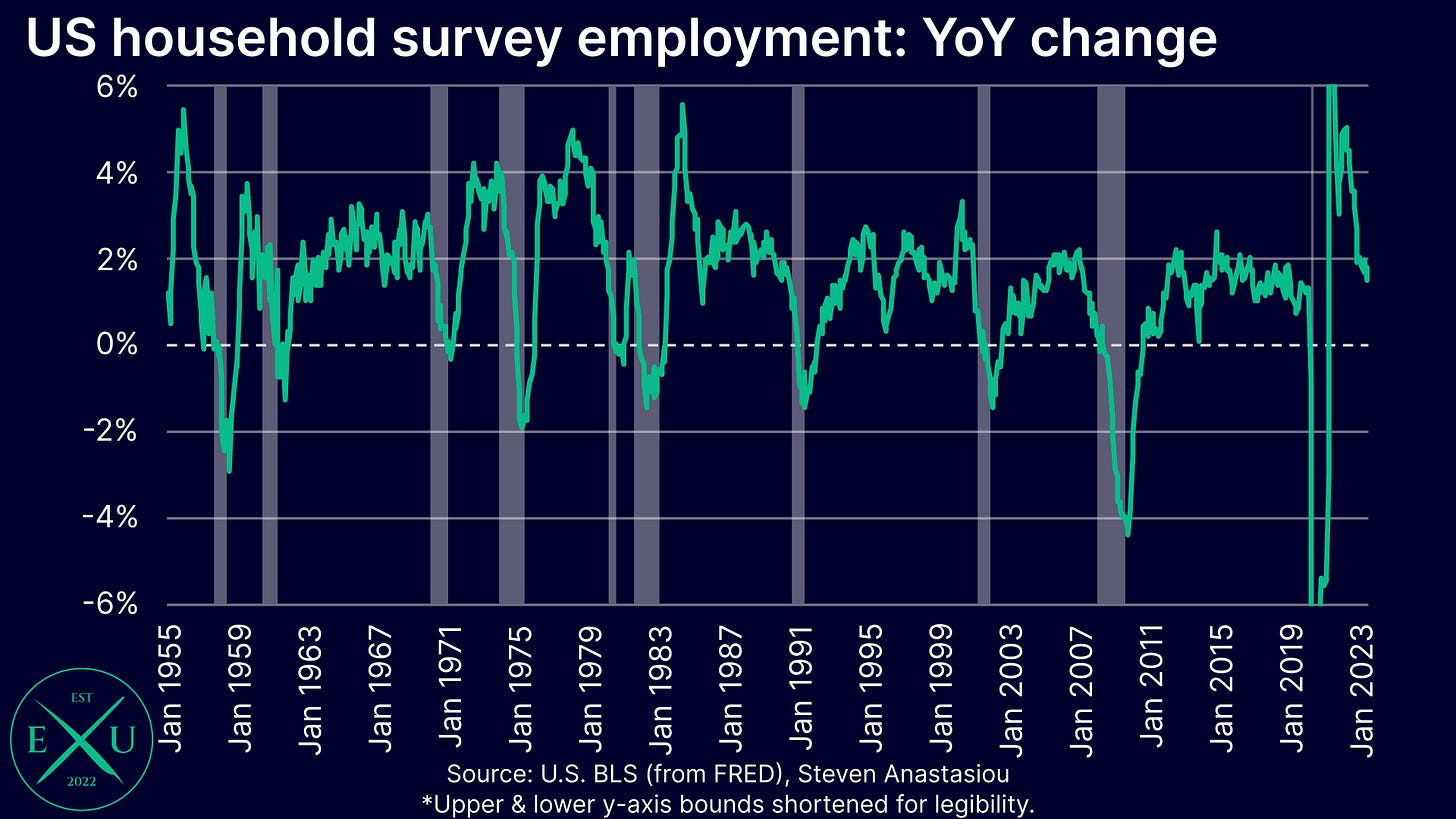
Though note that history shows that this is often a significantly lagging indicator, with recessions often well underway before annual nonfarm payroll growth turns negative.
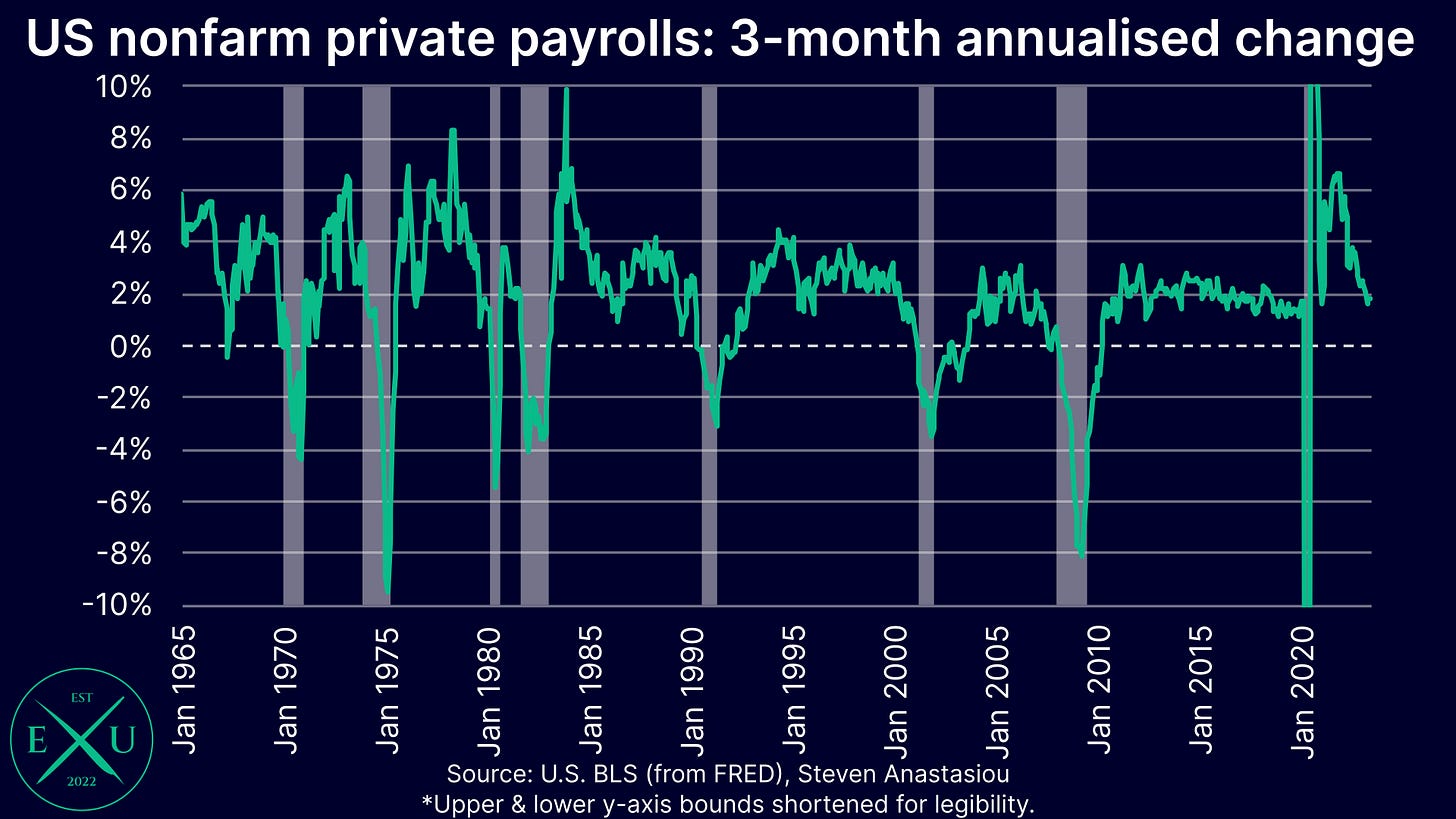
Looking at more recent movements, the 3-month annualised change held steady at 1.9% in June, which is now broadly consistent with pre-COVID growth rates.
The 3-month annualised change in private payrolls was 1.8% in June, also unchanged from May. Again, this is broadly consistent with its pre-COVID level.
Household survey growth continues to be weaker than establishment survey growth
In contrast to the relatively robust annual growth that continues to be recorded in total nonfarm payrolls (which at 2.4% remains above the pre-COVID growth rate), the establishment survey of employment has seen a more material weakening, recording annual growth of 1.8% in June. This is in-line with its pre-COVID growth rate.
While the establishment (nonfarm payrolls) and household surveys generally record similar growth rates over time, the use of business net birth-death estimates in the establishment survey can result in its estimates being thrown off course during significant economic turning points (such as during a shift towards a recession). For this reason, it’s important that the differences in growth between these two surveys continues to be monitored.
Manufacturing diffusion index negative, but total private employment in-line with pre-COVID levels
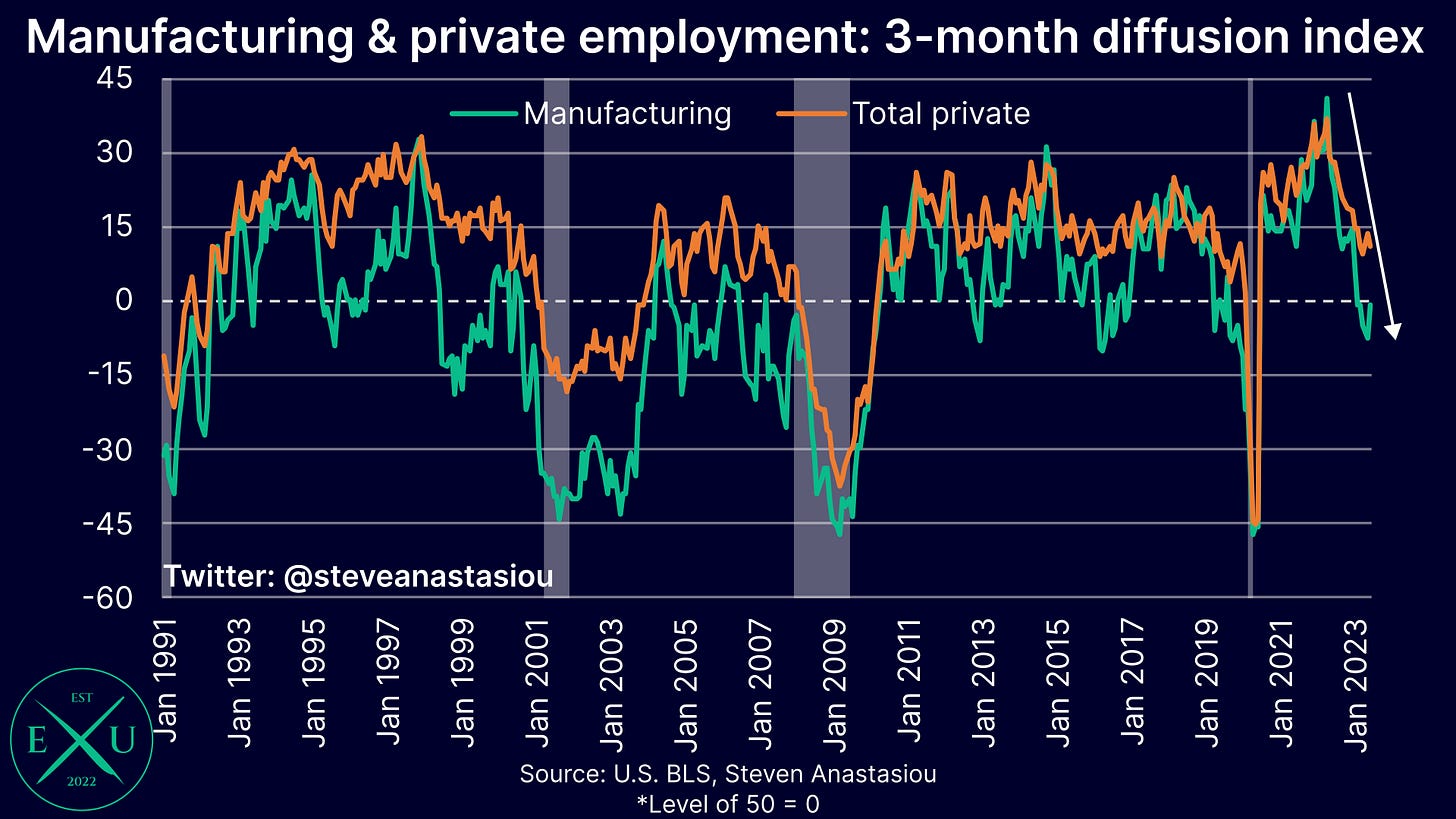
Another way to try and gauge the broad strength of the jobs market, is to look at diffusion indexes, whereby positive readings (i.e. levels above 50), indicate that a majority of industries saw an increase in employment.
With the more cyclical manufacturing sector having recorded readings below 50 for the past five months on a 3-month time span, this indicates that a majority of manufacturing industries have been recording employment declines. Though the extent of the decline in employment were estimated to have narrowed in June, with the diffusion index bouncing from 42.4 in May, to 49.3 in June.
While moderating slightly in June to 61 points (i.e. positive 11), a majority of private employment industries are continuing to record growth, with the broadness of the growth remaining around levels that are consistent with pre-COVID levels.
Cyclical employment growth turns negative — pointing to a recession by year’s end
The Economics Uncovered US Cyclical Employment Index, which groups together leading employment categories, saw its annual growth rate fall to 0.4% in June, indicating a very significant weakening over the past year.
The Economics Uncovered US Cyclical Employment Ex-Manufacturing Index is now YoY negative. History suggests that this means that a recession could only be a matter of months away.
Excluding manufacturing from the index, which is otherwise a particularly large single component, proved to provide a better leading indicator of the GFC, which provided a 5-month warning, as opposed to the much longer 14-month lead from the overall index.
Meanwhile, the index also turned negative 4 months before the 2001 recession.
Should this time around be broadly consistent, these prior two lags point to a US recession beginning in either November or December.
UPDATE - THE BELOW CHART SHOULD READ 4-MONTH LEAD AND 5-MONTH LEAD, RESPECTIVELY, NOT 5-MONTH AND 6-MONTH
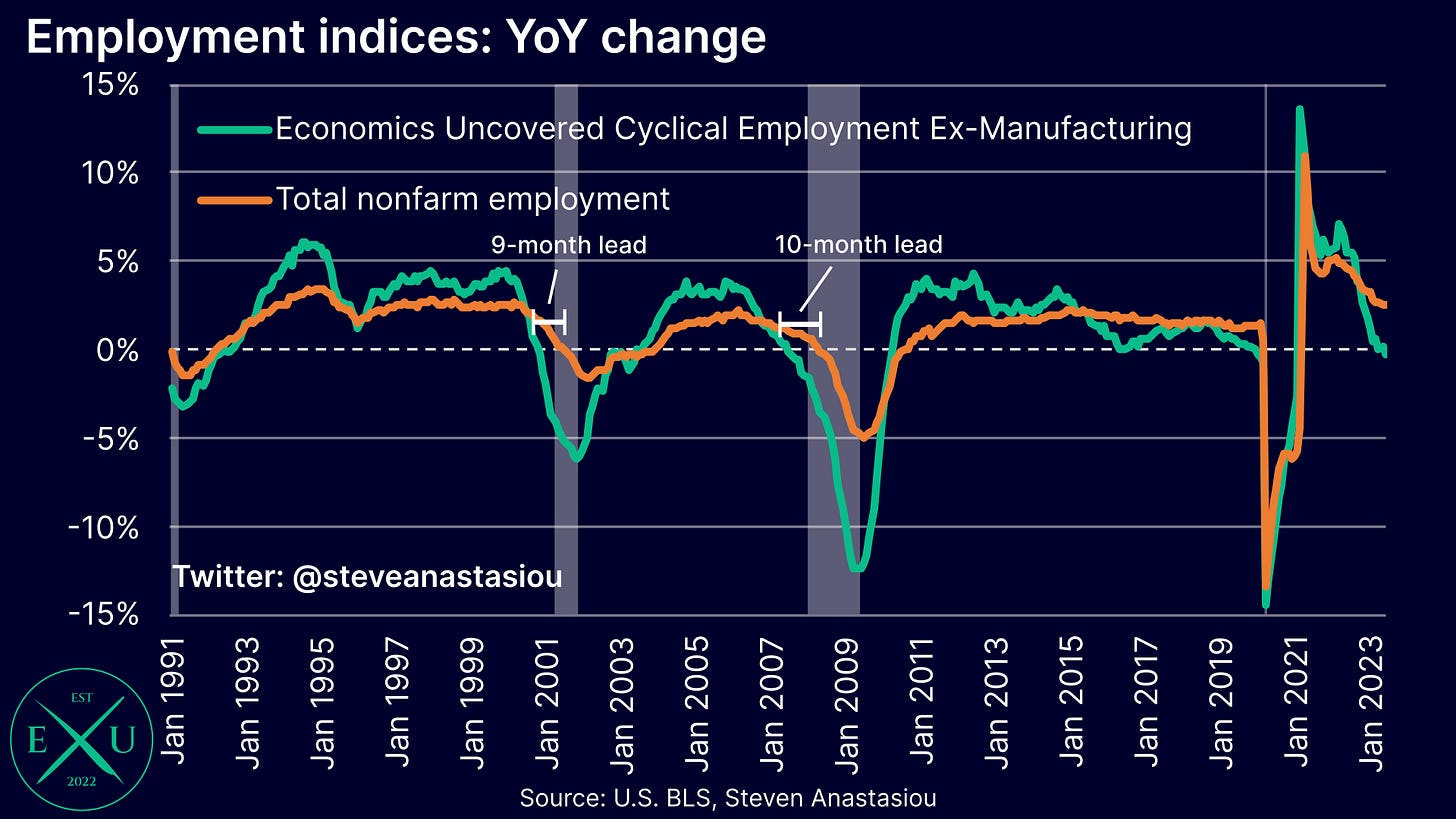
In comparison to overall employment, the Economics Uncovered Cyclical Employment Ex-Manufacturing Index turned YoY negative 8 and 9 months ahead of total nonfarm payrolls in 2000 and 2007, respectively.
This suggests that annual employment growth may not turn YoY negative until 2024 (note the emphasis on annual as opposed to monthly employment growth).
UPDATE - THE BELOW CHART SHOULD READ 8-MONTH LEAD AND 9-MONTH LEAD, RESPECTIVELY, NOT 9-MONTH AND 10-MONTH
Thank you for reading my latest research piece — I hope it provided you with significant value.
Should you have any questions, please feel free to leave them in the comments below!
In order to help support my independent economics research (remember, everything you see — the forecasts, the charts, the analysis, the in-depth explanations of economic history — is all completed independently, by me, for you), please consider liking and sharing this post and spreading the word about Economics Uncovered.
Your support is greatly appreciated and goes a long way to helping make Economics Uncovered a sustainable long-term venture that will be able to provide you with valuable economic insights for years to come.
If you haven’t already subscribed to Economics Uncovered, subscribe below so that you don’t miss an update.


