US Economic and Market Summary & Outlook
This section of the Economics Uncovered website is scheduled to be regularly revised on an ad-hoc basis in order to better help you to navigate the complex outlook for the US economy and financial markets. To easily keep up-to-date with my latest insights and to review any section of interest, please bookmark this page for easy access.
Last updated: 5 July 2024
Report outline
Executive summary
Money supply, bank credit & liquidity
M2 begins to rise, but growth remains relatively constrained
Bank credit impacted by higher interest rates and QT, but it has returned to growth
Abundant liquidity and a large federal government deficit drives bank deposit growth, stimulating the economy and breaking the link to QT
While the RRP boost is getting closer to an end, a broadly favourable liquidity backdrop is expected in 2H24 — but will it be enough to materially boost the US economy?
GDP, personal spending and income
1Q24 real final sales to domestic purchasers growth moderates as real PCE growth decelerates materially
The major decline in real disposable income growth may be reaching a tipping point for the wider economy
While real PCE growth is on track to remain modest in 2Q24, base effects will help to support growth in 2Q24
Employment
While job gains appear strong, they aren’t even keeping up with population growth
A major weakening has been seen across a broad array of labour market measures
The pathway of least resistance is for a further weakening, which could see the unemployment rate move sharply higher — even if job growth remains positive
Inflation
CPI growth materially decelerates a month earlier than expected as services prices see broad disinflation
From vehicle price trends to wage growth to spot market rents, the reasons for significant 2H24 disinflation are numerous
CPI growth is now tracking below my latest medium-term US CPI forecast
The PCE Price Index tends to grow at a materially slower pace than the CPI
Overarching US Economic Summary & Outlook — continued expansion or a recession?
Fed policy outlook
Market overview & outlook
The impact of the Fed’s decision to taper QT
Stages of the Economic Cycle — investment implications
Equity market review
Equity market outlook
Bond (Treasury) market review
Bond (Treasury) market outlook
Important disclaimer—this may affect your legal rights:
This report is an economics research publication and is not investment advice. This economics research represents my own analysis, opinions and views, is general in nature, and does not constitute personal advice to any person.
While research may make mention of potential financial market implications, this analysis is general in nature, is not investment advice and is only provided for informational and educational purposes in order to explain the potential impacts of potential economic policy and data outcomes. Any mention of potential financial market implications does not constitute personal advice to any person.
While this research utilises data which is considered to be reliable, I have not independently verified the accuracy of the data utilised in this research.
While the author has taken care to try and ensure that the figures, data and information presented in this research are accurate and free of errors, reports may contain errors or omissions that may become apparent after this research has been published.
Furthermore, this report may contain forward-looking statements, which are subject to inherent variability and are subject to risks and uncertainties. Forward-looking statements may be identified by the use of terminology, including, but not limited to, ‘anticipate’, ‘estimate’, ‘expect’, ‘may’, ‘forecast’, ‘trend’, ‘potential’ or similar words. Forward-looking statements are based on current expectations and reflect judgements, assumptions and estimates and other information available as at the date made. Forward-looking statements do not represent guarantees and are subject to significant uncertainties which may cause actual results to differ materially from the forecasts expressed in this report. As such, I caution against reliance on any forward-looking statements.
I do not represent, warrant or guarantee expressly or impliedly, that the data and information contained in this research is complete or accurate. I do not accept any responsibility to inform you of any matter that subsequently comes to my attention, which may affect any of the information contained in this research. I do not accept any obligation to correct or update the information or opinions contained in this research. I do not accept any liability (whether arising in contract, in tort or negligence or otherwise) for any error or omissions in this document or for any resulting loss or damage (whether direct, indirect, consequential or otherwise) suffered by the recipient of this document or any other person.
Executive summary
Last updated: 20 June 2024
With price growth materially elevated across the first four months of the year and nonfarm payroll growth running at an historically strong pace, markets have drastically reduced their expectations for 2024 interest rate cuts from a peak of seven in January.
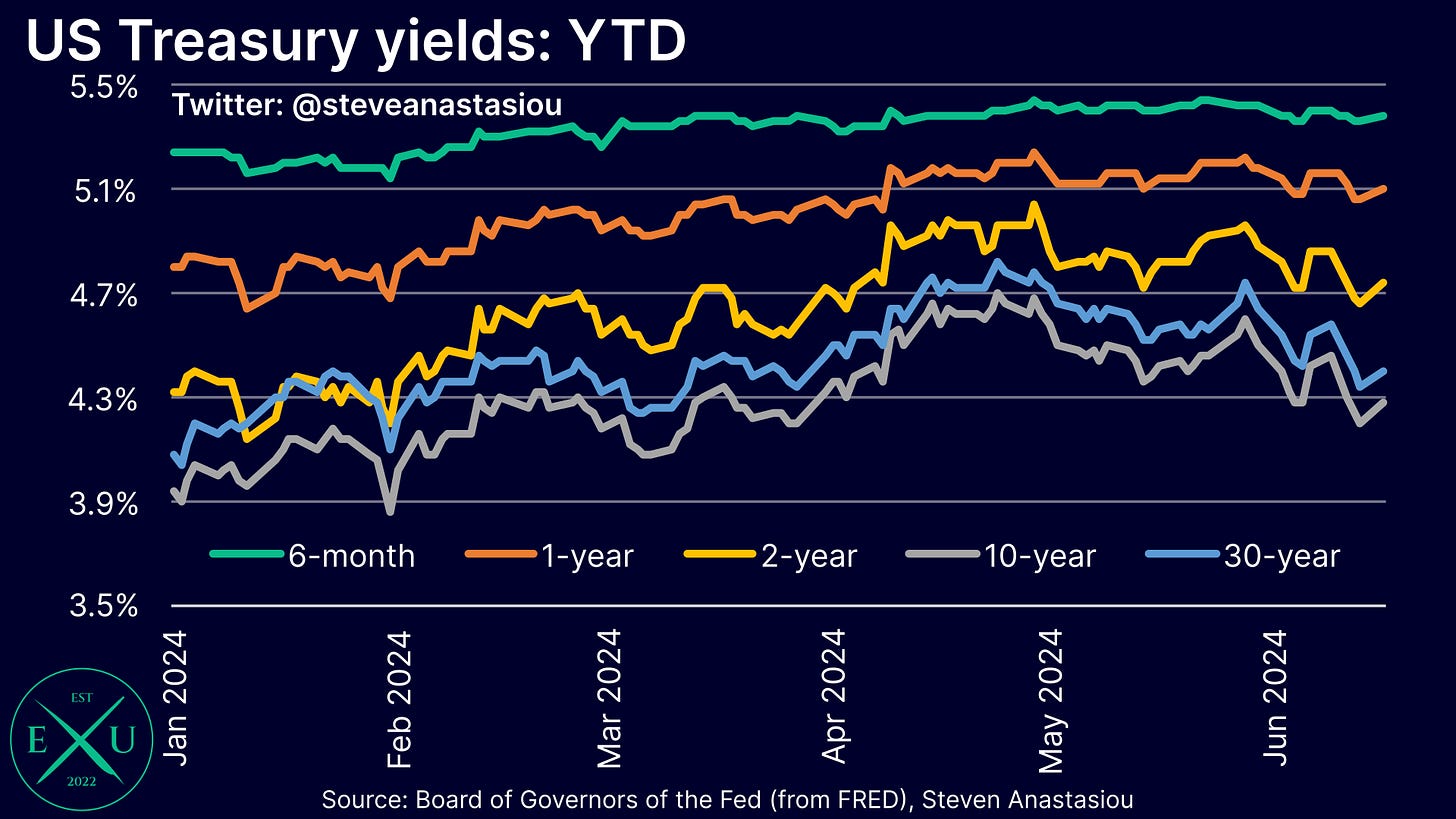
As a consequence, the 10-year Treasury yield has increased significantly from 3.88% at the end of 2023 to 4.25% at the time of writing.
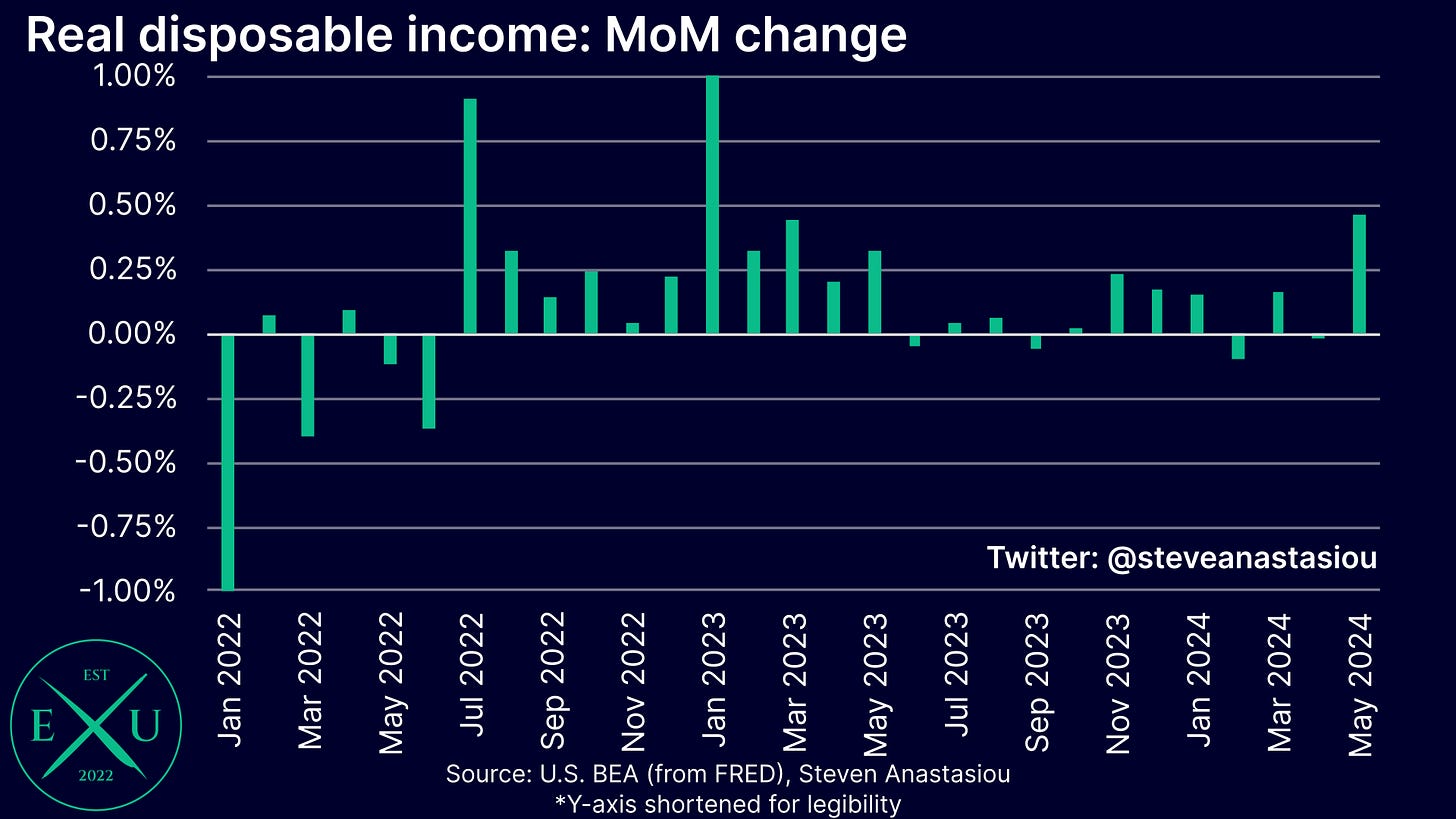
Though despite the YTD increase, 10-year yields are down materially from the recent peak of 4.62% on 29 May. The recent softening in yields and increase in market expectations for 2024 interest rate cuts from one to two, comes after May’s US CPI report showed major disinflation and a number of weaker economic data points have been seen, including: a notable downward revision to 1Q24 US GDP numbers; a MoM decline in real disposable income for the second time in the past three months; and a MoM decline in real personal consumption spending.
The latest CPI report and recent softening of economic data align with my expectations for a material slowdown in the US economy and inflation during 2H24.
Key points to note in support of these expectations include:
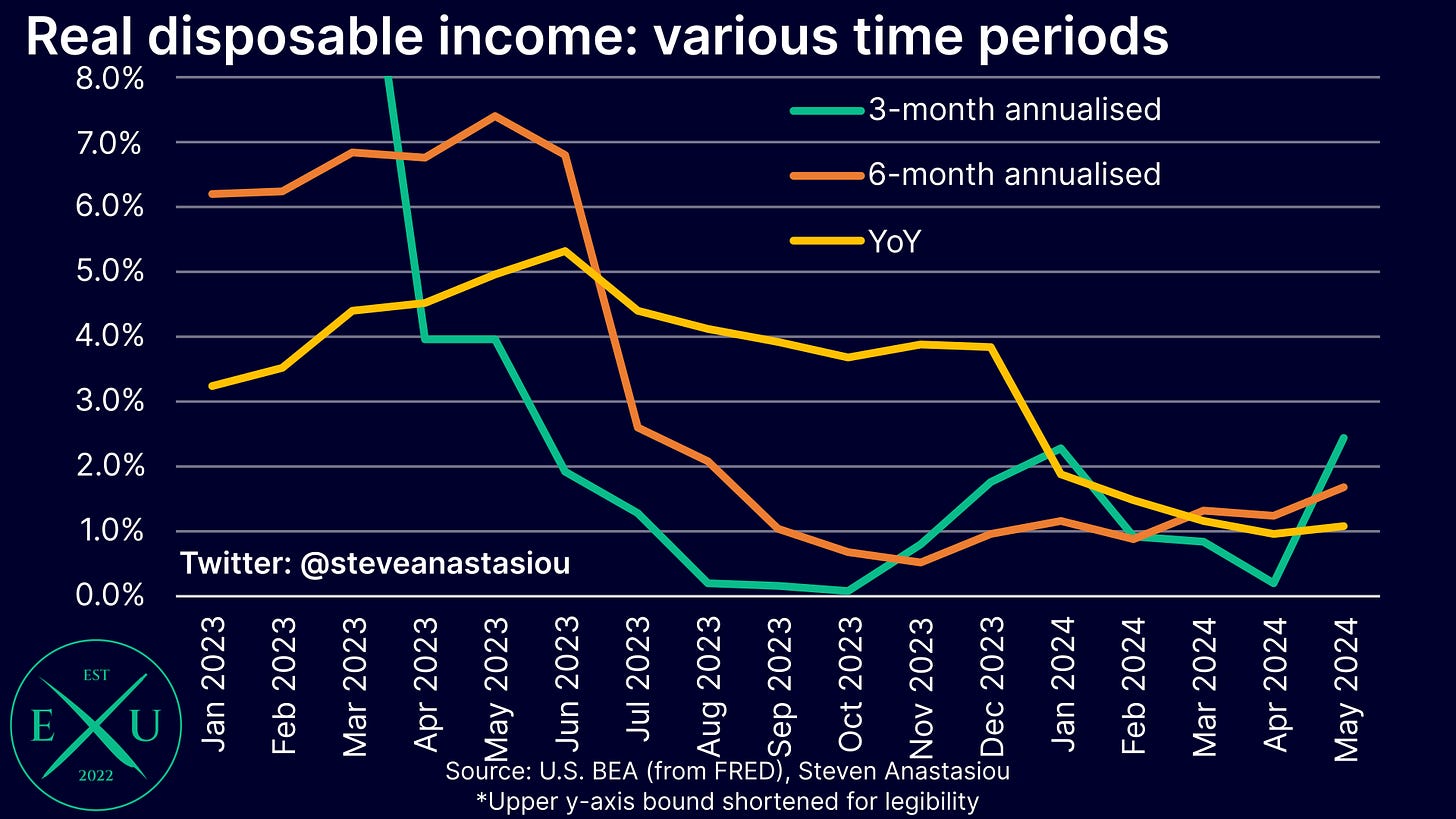
Real disposable income growth falling to just 1.0% YoY;
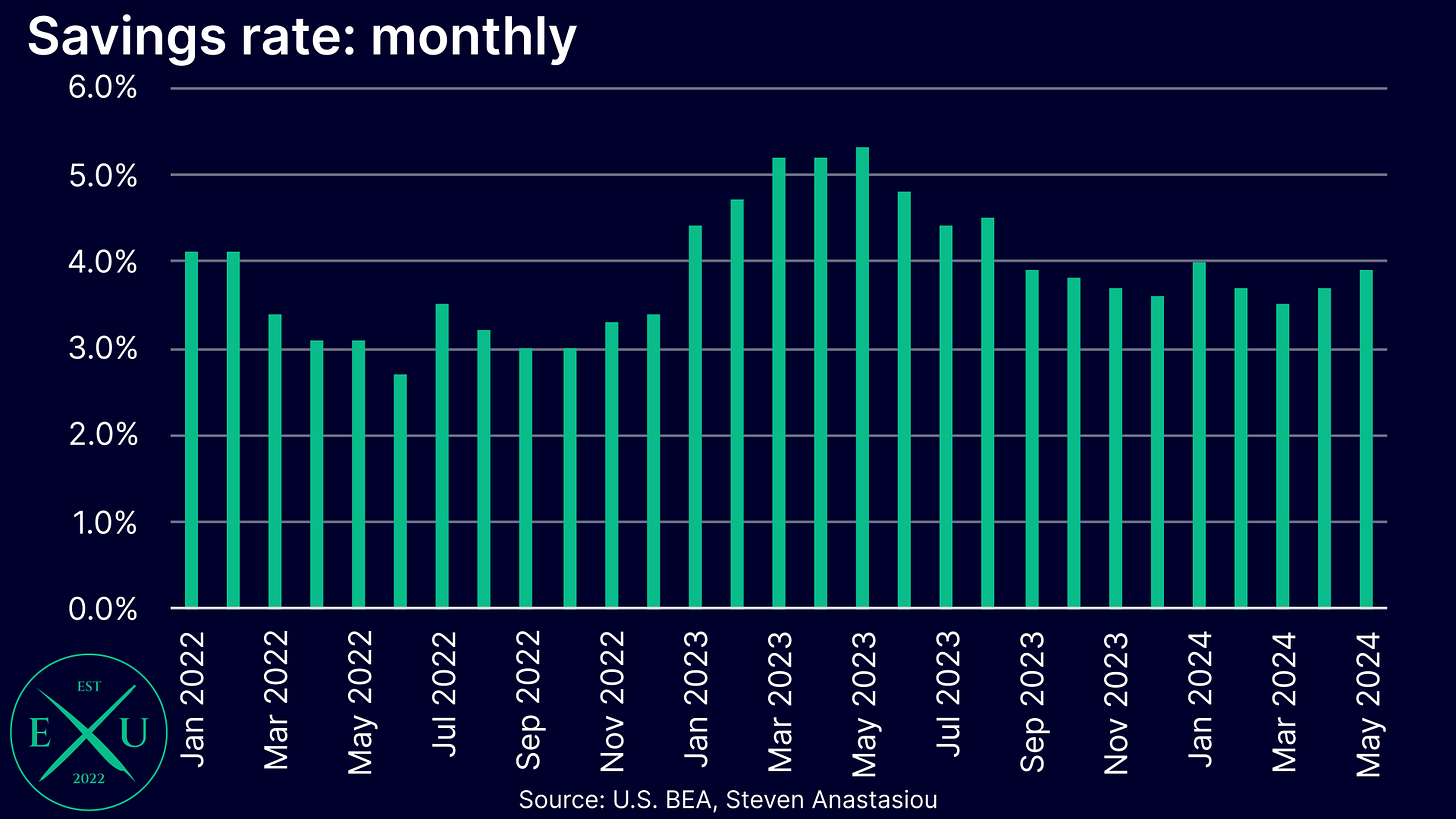
Real personal consumption expenditure being unsustainably propped up by falling savings rates, which are now well below the 2015-19 average;
The US employment market showing broad signs of a major weakening (including material and ongoing increases in the unemployment rate);
Increasingly large declines in cyclical durable goods prices;
Declining spot market rents; and
Moderating wage growth.
While strong immigration and a more favourable liquidity and bank deposit outlook for 2H24 versus 2Q24 mean that my base case is for the US economy to avoid a recession in 2024, the clear (and growing) risk is that a continued weakening of the employment market tips the US into a recession in 2H24 or 1H25.
Irrespective of whether the US enters a recession this year or not, I expect the combination of a slowdown in economic growth and inflation to result in at least two 2H24 rate cuts.
Despite 10-year Treasury yields rising as high as 5% over the past year, US equity markets have recorded strong YoY increases as increased liquidity and relatively strong nominal economic growth have provided strong tailwinds.
The Fed’s decision to signal a near-term tapering of QT in March, and its formal announcement of a material tapering of QT in May whilst reserves remain in abundance, has had material implications for the liquidity outlook and has likely been a particularly important driver of asset prices in recent months, with the S&P 500 and Nasdaq up 9.0% and 14.1% respectively, since the Fed announced a material reduction in the pace of QT at its May FOMC meeting. Economics Uncovered subscribers have been kept well abreast of the importance of these developments via detailed prior research pieces (see “Fed turns increasingly dovish, adding further fuel to financial markets” published 21 March and “Why the Fed's reduction in the pace of QT is critical for markets” published 11 May).
While the combination of continued relatively solid nominal economic growth and a more dovish Fed have supported equities, I believe that markets are significantly underestimating the odds of a major slowdown in the US economy in 2H24.
Given the impact that a weakening economy may have on the interest rate and liquidity outlook, corporate earnings and investor confidence, this could have significant implications for asset markets and lead to a material increase in volatility in 2H24.
Given the recent inflationary experience, it’s also important to consider that the Fed may be materially less responsive to an economic weakening than in prior economic downturns, increasing the risk that the US economy enters a recession in 2H24 or 1H25, as well as its potential severity, with flow-on implications for asset markets.
A detailed analysis of the potential implications for equities and Treasuries is included in the report below.
Money supply, bank credit & liquidity
Last updated: 5 July 2024
In order to understand the outlook for the US economy, it’s important to firstly analyse how current fiscal and monetary policy has, and is, impacting the money supply, bank credit and overall liquidity — in doing so, I will begin with an overview of shifts that have been seen in the M2 money supply, before moving on to analyse its underlying drivers.
M2 begins to rise, but growth remains relatively constrained
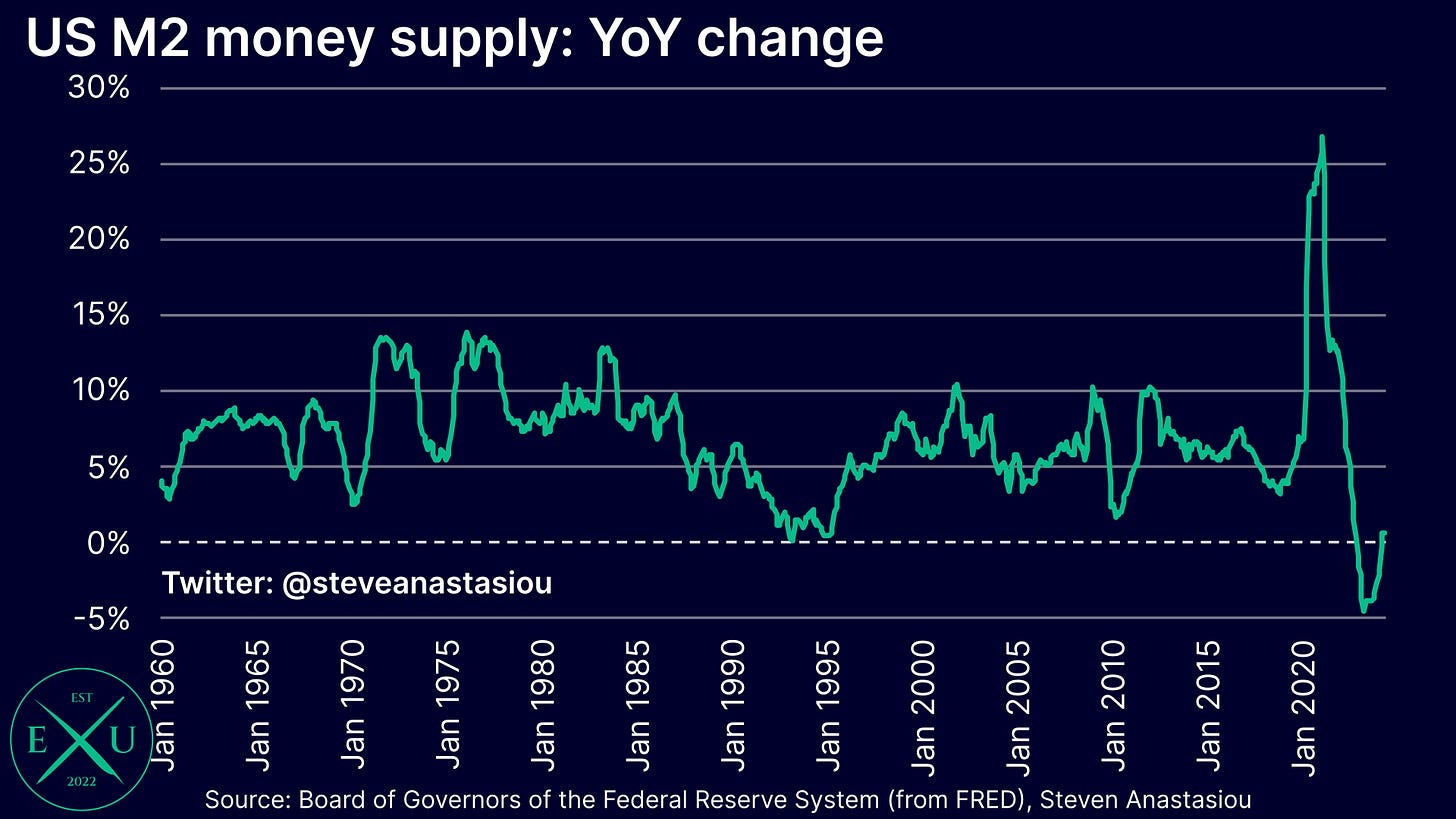
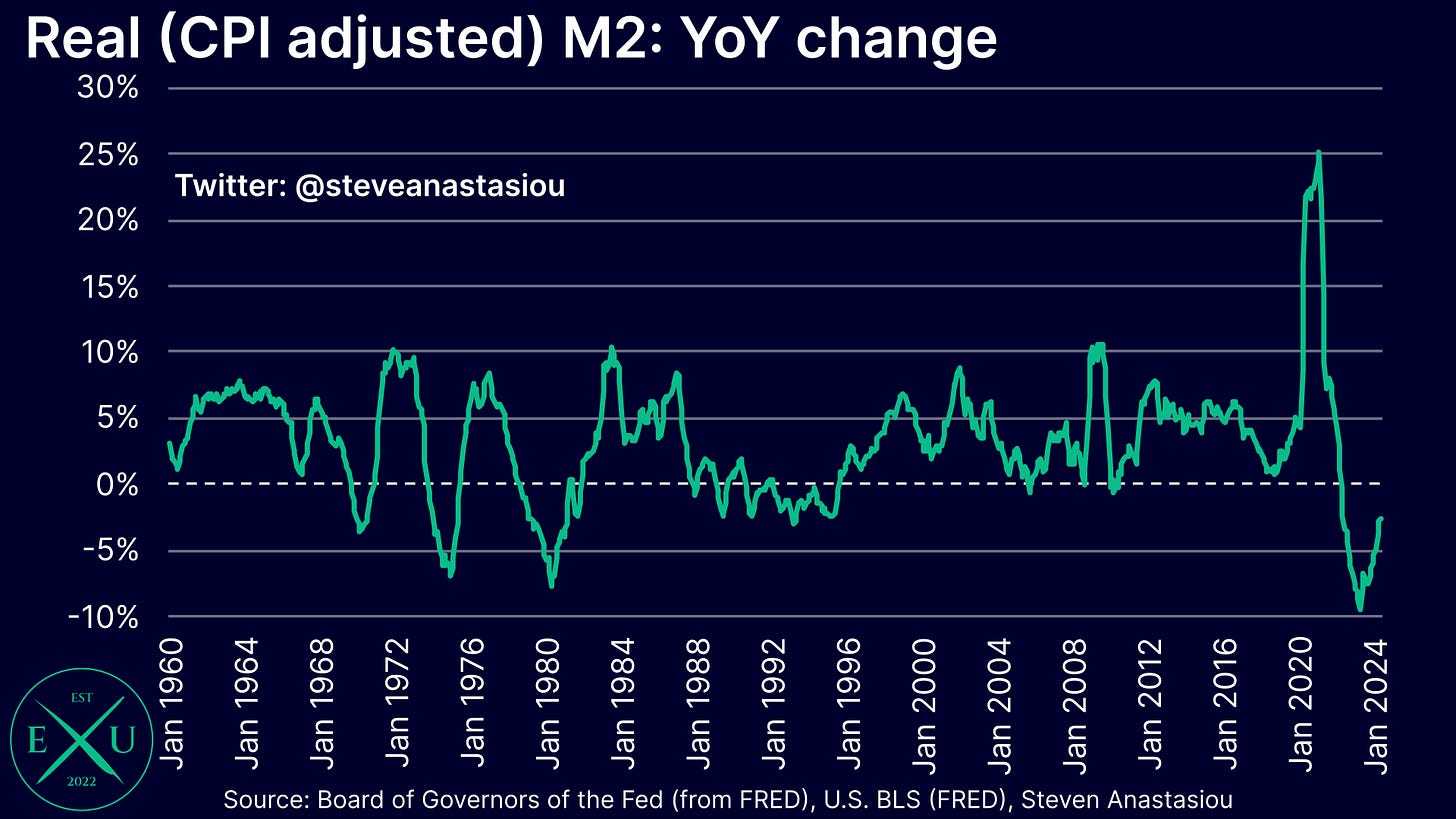
YoY growth in the M2 money supply (M2) was 0.64% in May, marking the first time that M2 has recorded YoY growth since November 2022. While growth is now materially above the trough of -4.6% YoY that was recorded in April 2023, the current YoY growth rate indicates that M2 continues to remain relatively constrained by the Fed’s monetary policy tightening — and particularly so on an inflation-adjusted basis. This is likely to place further downward pressure on inflation, as well as nominal economic activity, over the medium-term.
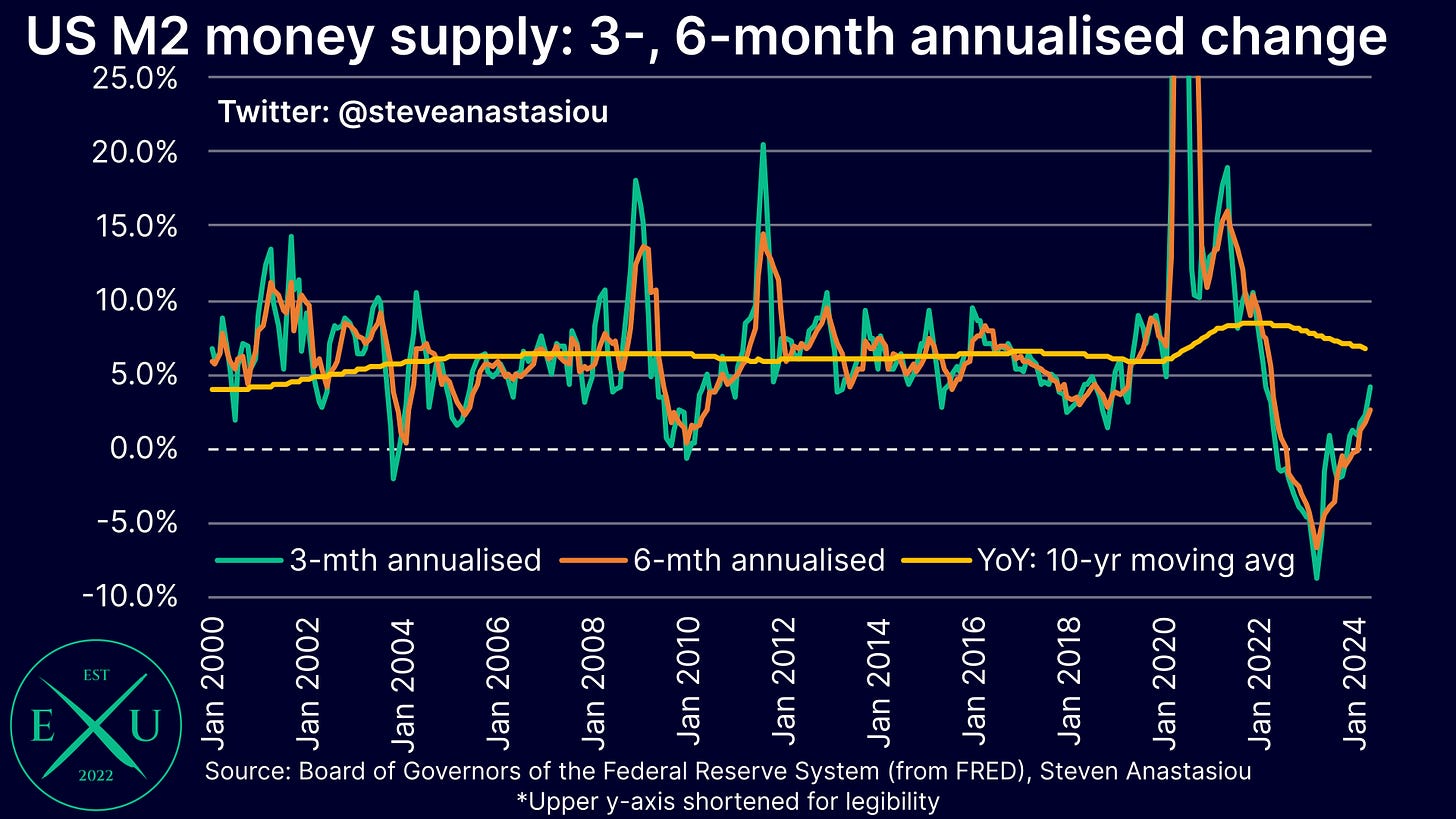
On a 3- and 6-month annualised basis, M2 rose by 4.2% and 2.5% respectively, in May. This indicates that the YoY growth rate of M2 is likely to turn increasingly positive over the months ahead.
Though even on these shorter-term time frames, M2 growth remains relatively modest and well below the average monthly growth rate of 5.8% YoY that was seen across 2010-19 and the current 10-year moving average growth rate of 6.8% YoY.
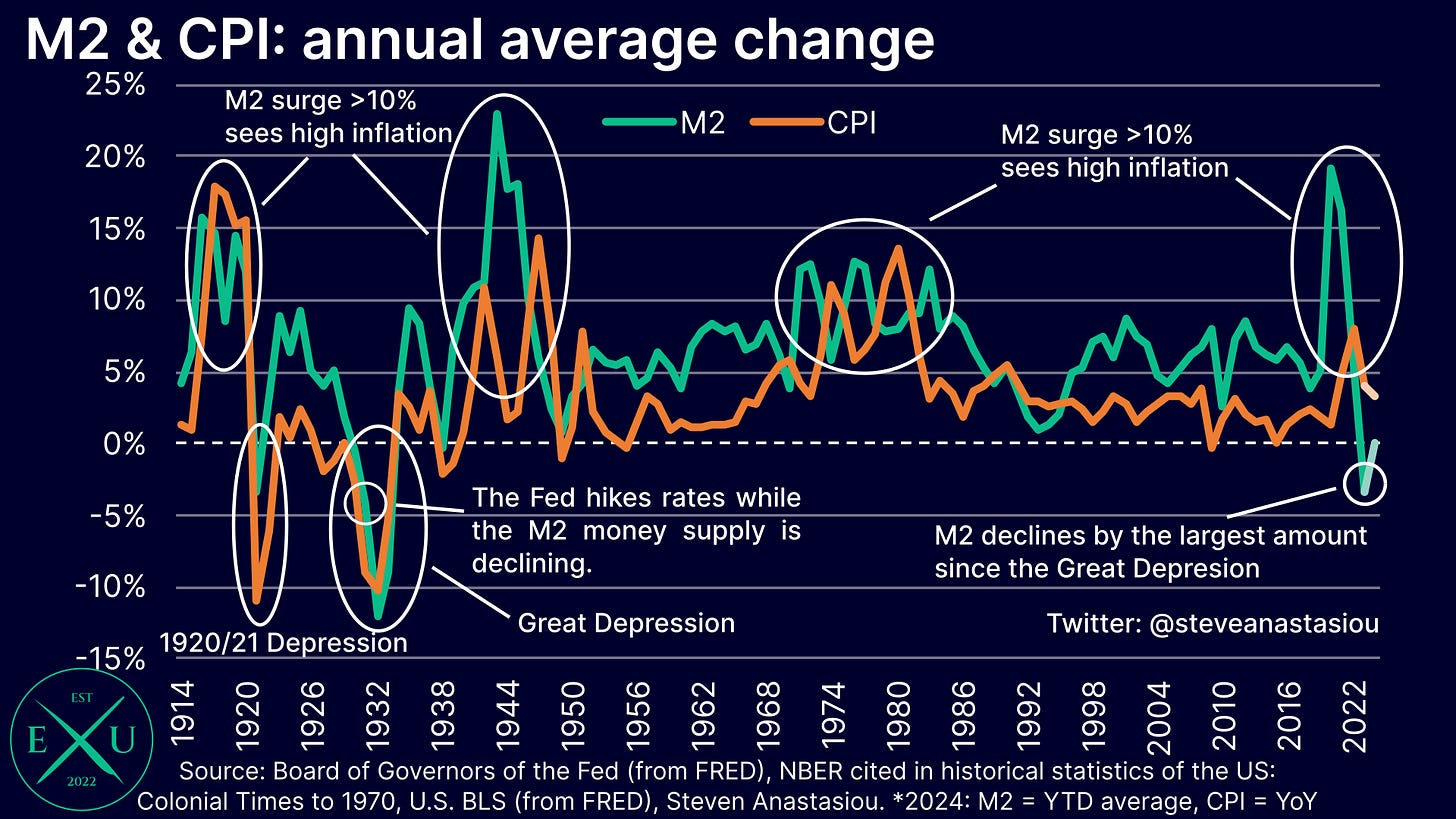
M2 also remains negative on an annual average basis — albeit just (-0.02%). Historically, annual average declines in M2 have been strongly correlated with deflationary busts. While the current liquidity backdrop (which is discussed in detail below) suggests that a deflationary bust is not imminent, the annual average change in M2 nevertheless continues to point to further disinflation and moderating nominal economic growth, as being likely over the medium-term.
Bank credit impacted by higher interest rates and QT, but it has returned to growth
In order to determine how the Fed’s tightening has worked its way through to the money supply, we can examine bank credit and its key components, being commercial bank loans and leases (which have been particularly impacted by the Fed’s significant interest rate increases), and commercial bank security holdings (which have been particularly impacted by QT).
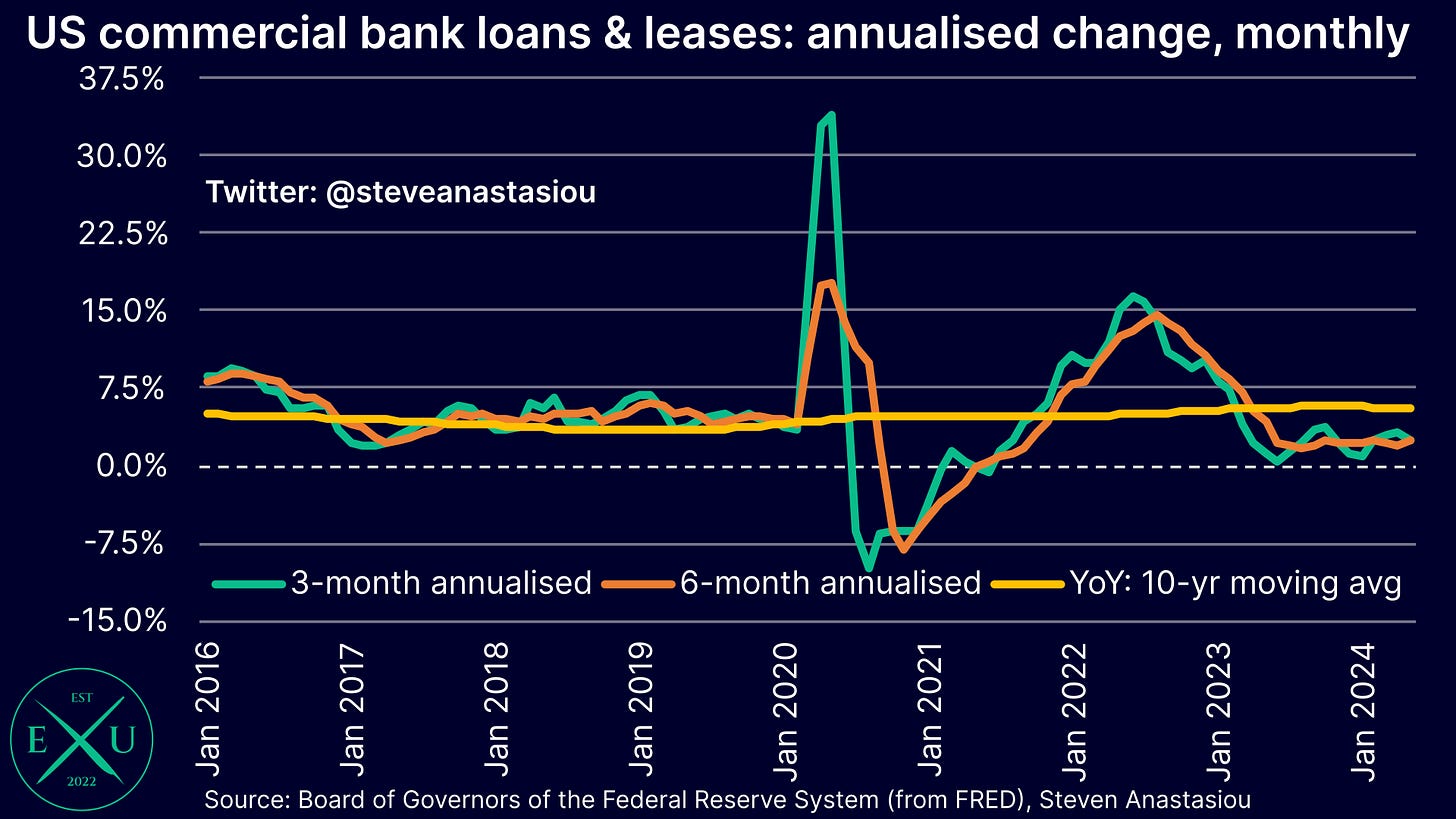
Looking firstly at commercial bank loans & leases, growth has plunged from a peak of 12.2% YoY in October 2022, to just 2.3% in May.
More recent data shows that both 3- and 6-month annualised growth remains modest at 2.4%, which is well below the 10-year moving average growth rate of 5.6% YoY.
While showing that the Fed’s interest rate hikes have had a clear and significant impact, they have not been large enough to encourage an outright deleveraging, with the outstanding level of loans continuing to grow.
Turning to commercial bank securities held in bank credit, the first thing to note is the impact of the Fed’s QT, which impacts securities held in bank credit via its impact on bank deposits. While the near 1:1 link has been broken by a significant decline in the Fed’s RRP facility (which is explained below), the below chart highlights the impact that both QE and QT have on bank deposits.
In regards to QT, to the extent that the Fed’s security holdings fall, private sector holdings increase. Given that the private sector uses bank deposits to purchase securities and the Fed’s balance sheet shrinks, QT acts to mechanically reduce both bank deposits and bank reserves. QE has the opposite effect, which explains the close correlation to increases in the Fed’s securities holdings and commercial bank deposits from ~March 2020-May 2022.
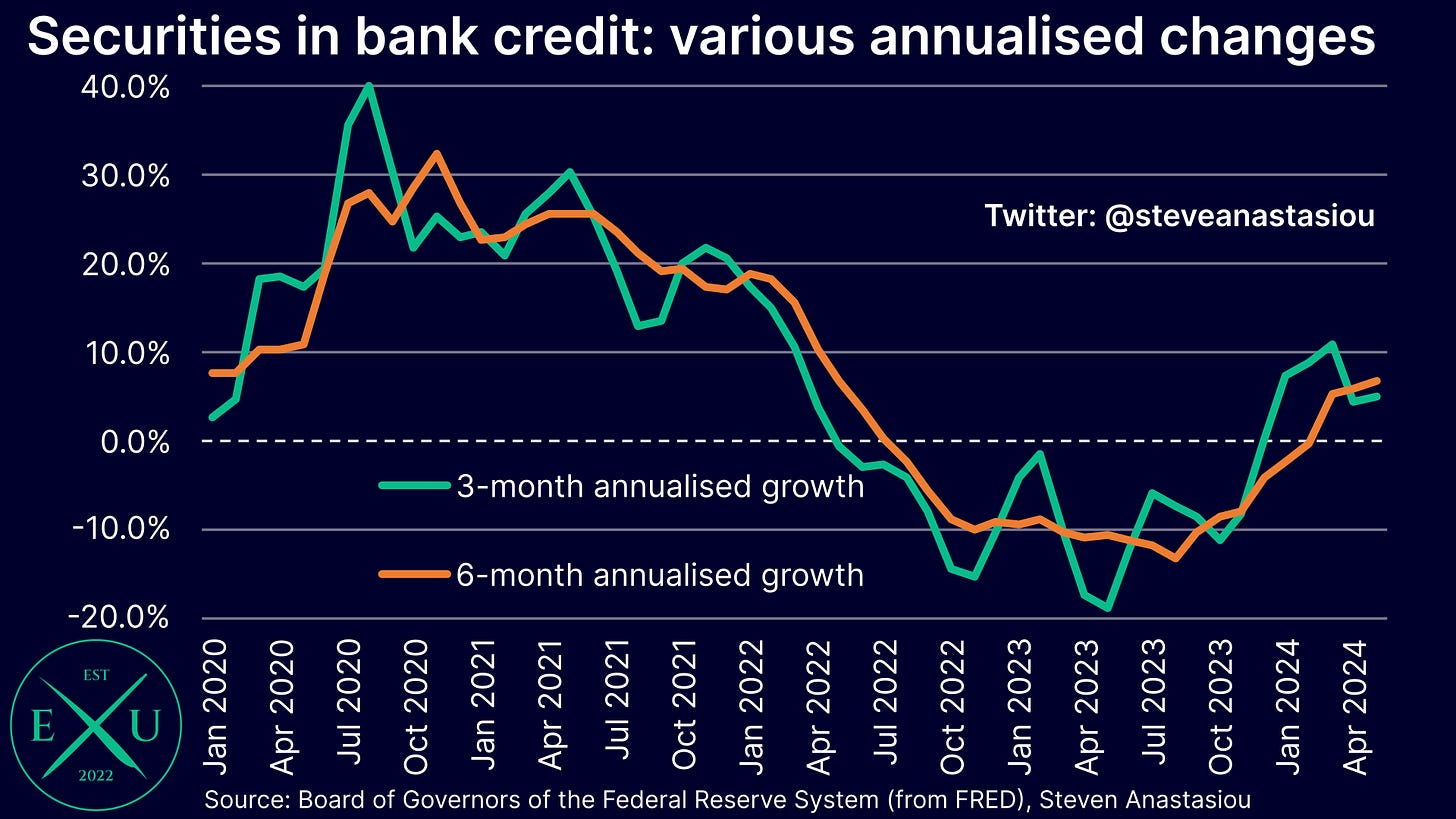
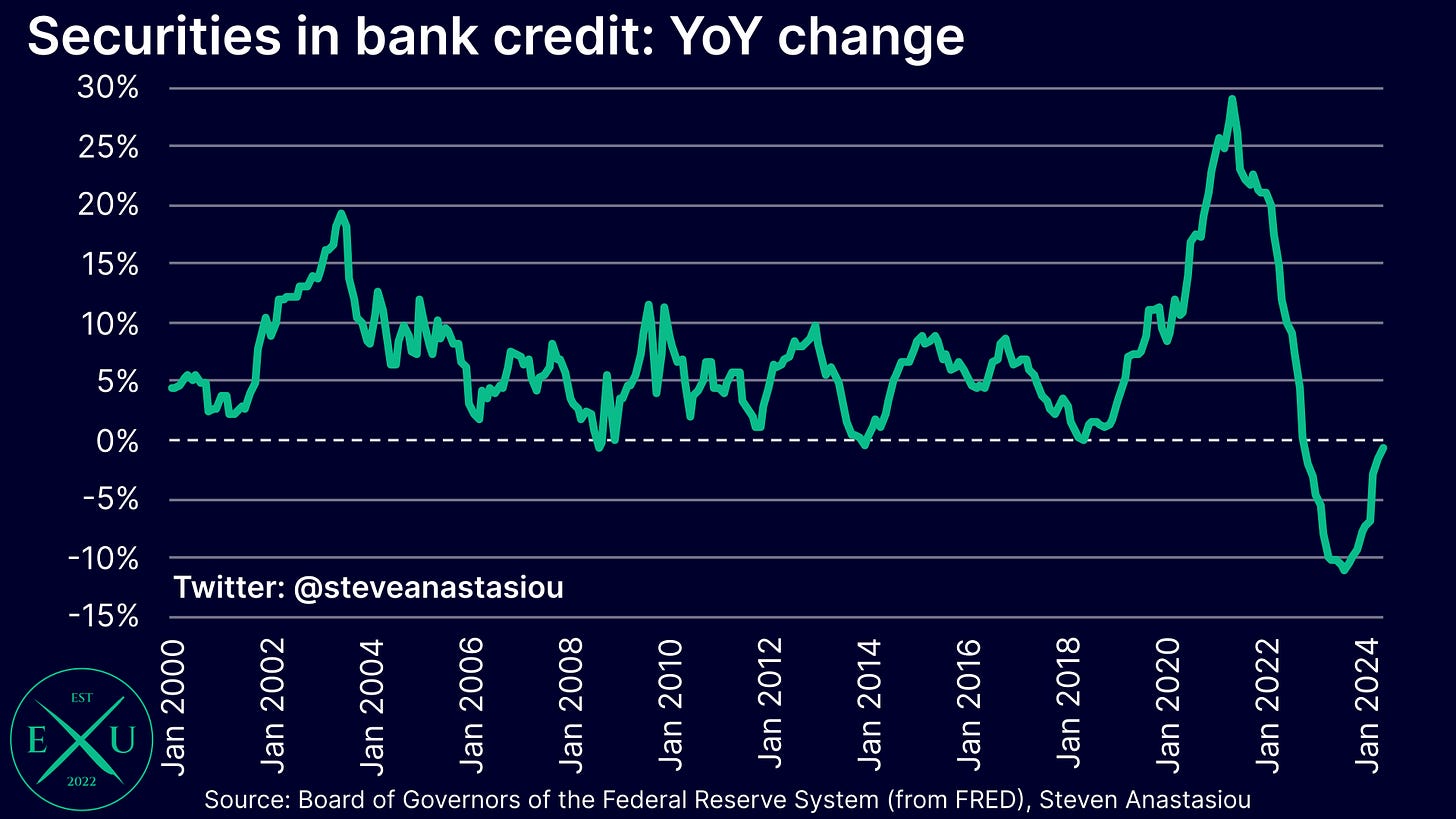
By acting to mechanically reduce bank deposits, QT places pressure on bank liquidity, as banks must use cash to fund deposit outflows. Given that selling securities is one way for banks to raise cash, this explains why there was a large decline in securities held in bank credit across much of 2022-23.
Though with bank deposits rising in recent months, so too have securities held in bank credit with 3- and 6-month annualised growth up by 4.9% and 6.8% respectively, in April.
This has reduced the rate of YoY decline from a trough of -11.0% in August, to -0.7% in April.
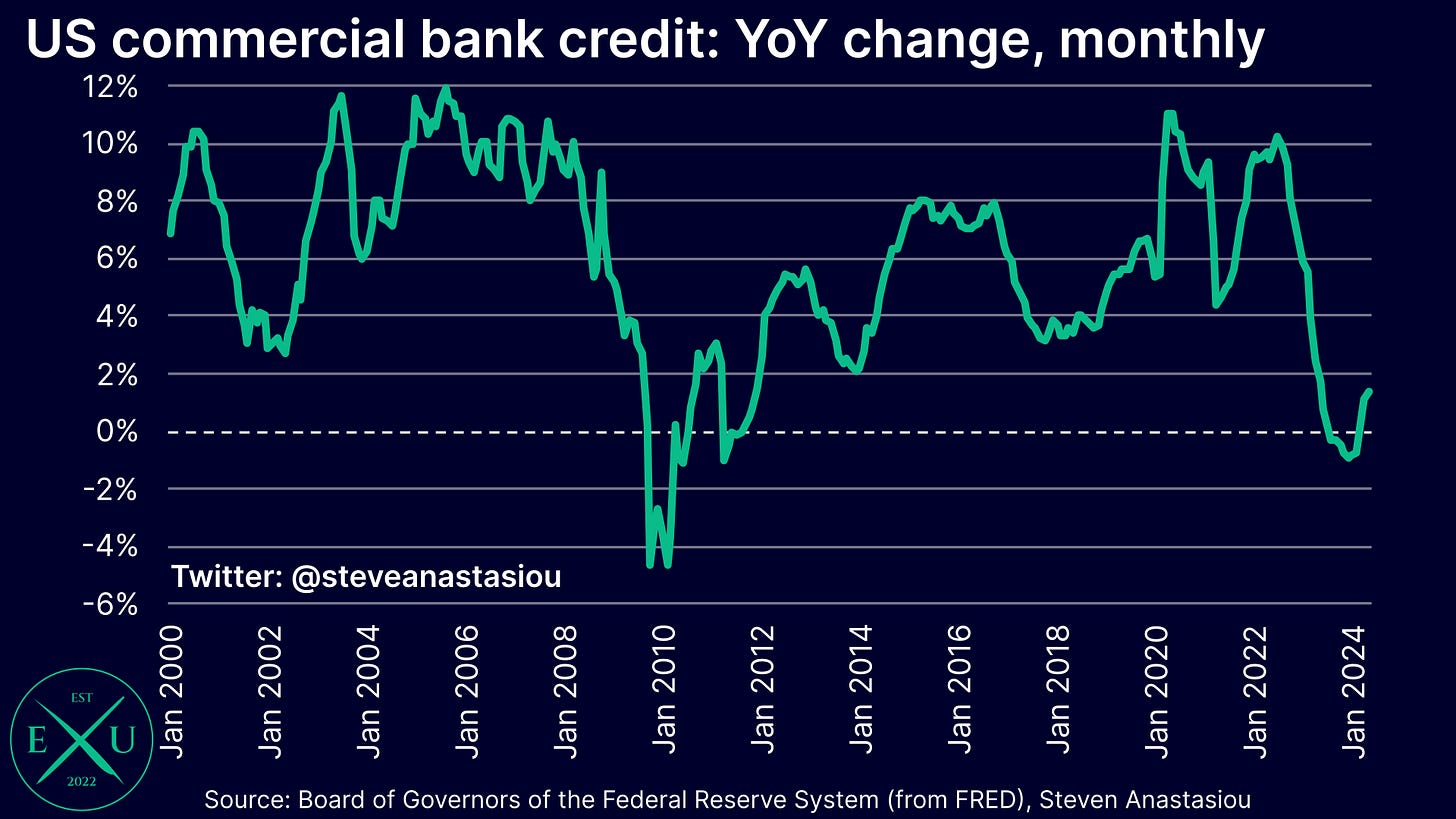
As a result of the significant deceleration in loan and lease growth and outright declines in commercial bank security holdings, for the first time since the aftermath of the GFC, bank credit saw YoY declines from August 2023-February 2024, with a trough of -0.9% YoY recorded in December 2023.
Though with loan and lease growth continuing and commercial bank security holdings returning to MoM growth in recent months, bank credit has once again turned YoY positive, rising to 1.4% in May. Despite returning to growth, this remains well below the 2010-19 average of 4.2% YoY.
On a 3- and 6-month annualised basis, commercial bank credit has grown by 3.1% and 3.7%, respectively.
Abundant liquidity and a large federal government deficit drives bank deposit growth, stimulating the economy and breaking the link to QT
Turning now to a discussion of liquidity levels, the two key factors to note are the very large federal government deficit and the Fed’s reverse repo (RRP) facility.
As a brief overview, the Fed’s RRP facility is used to mop up excess liquidity and prevent interest rates from falling below the Fed’s target range. Balances sitting within the Fed’s RRP facility can be thought of as consisting of “idle/inert” funds.
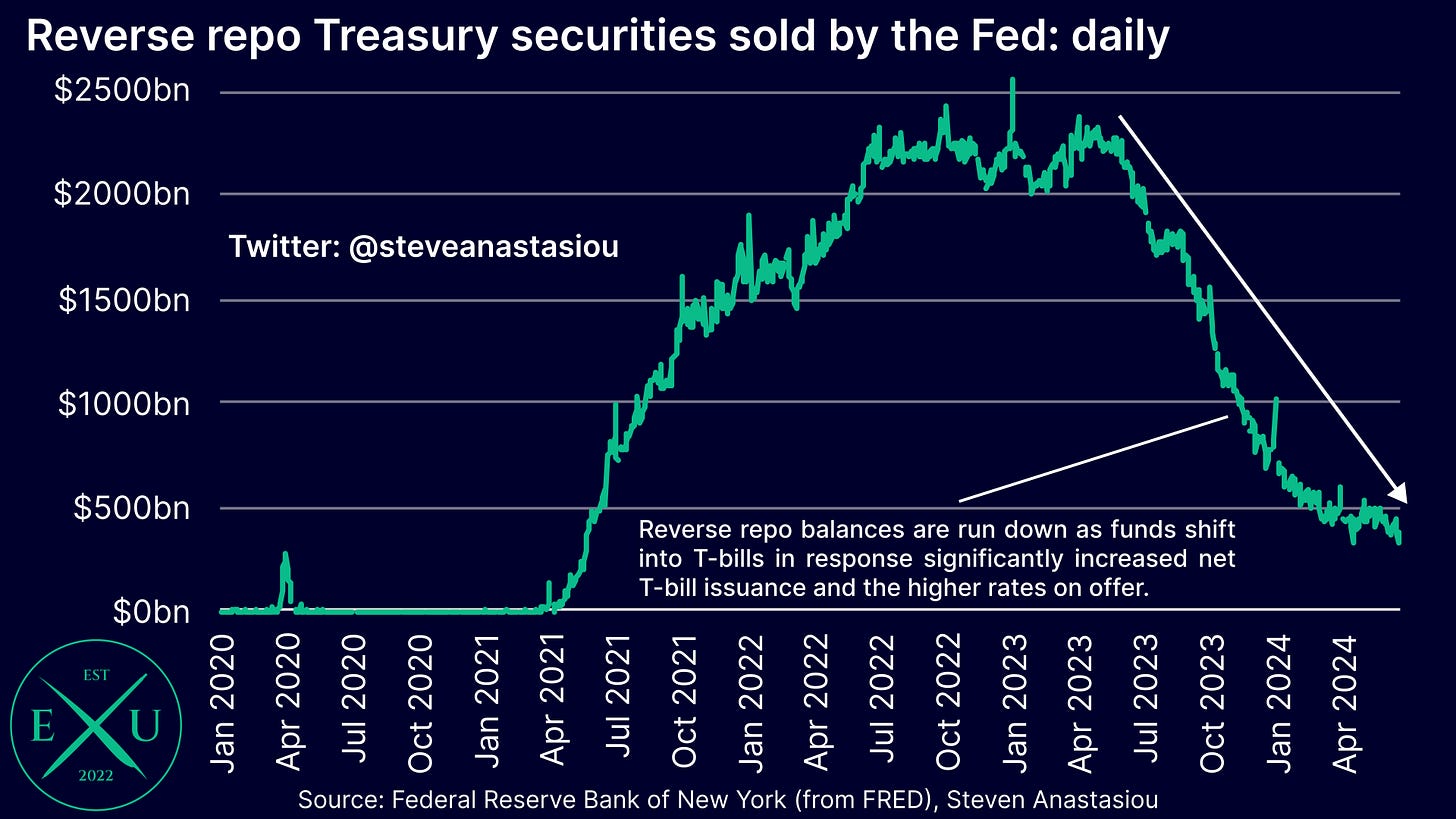
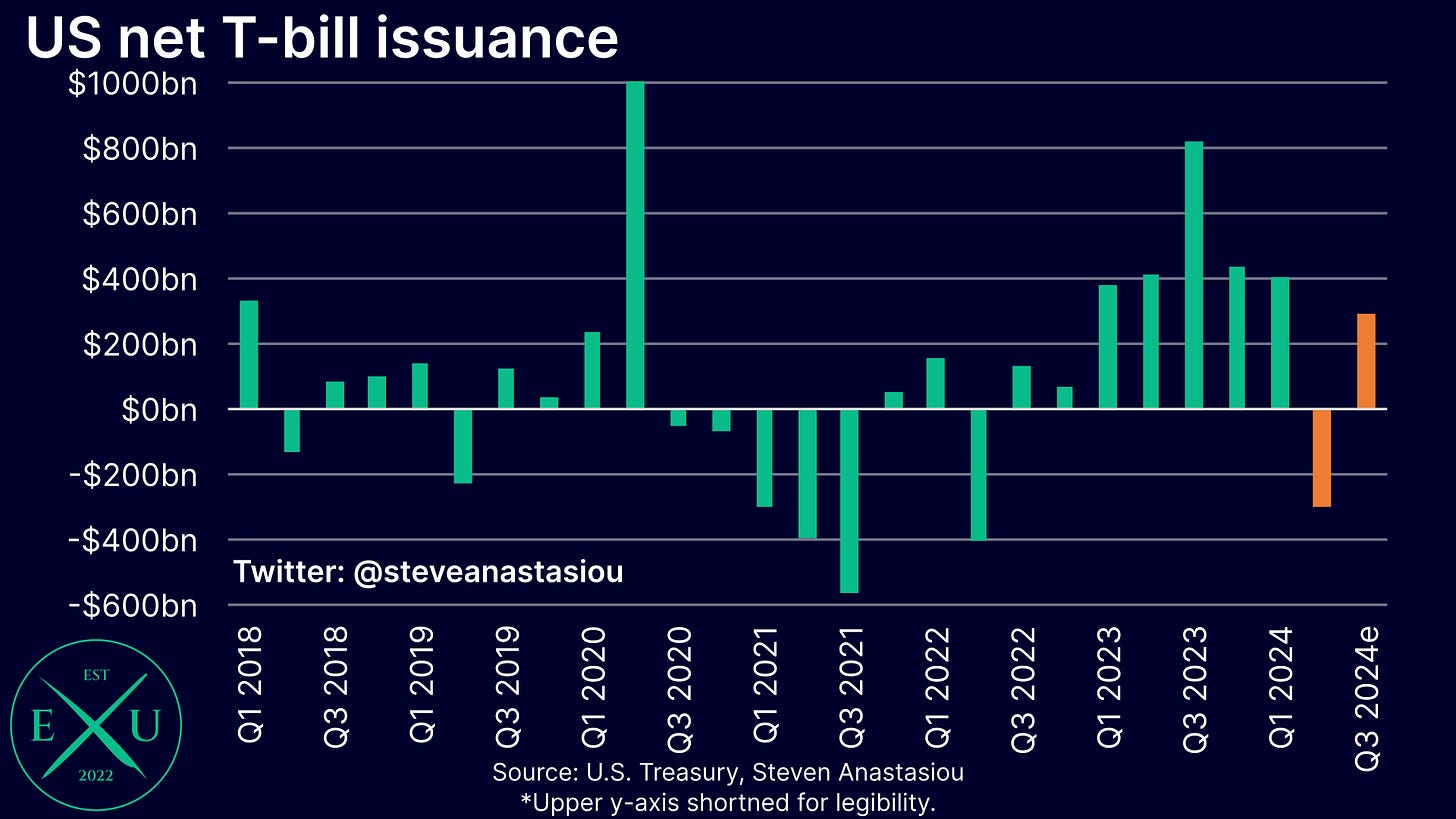
In the wake of the huge influx of post-COVID stimulus that was delivered, factors including a temporary but major decline in net T-bill issuance, acted to drive trillions of dollars into the Fed’s RRP facility, much of which stems from money market fund (MMF) investments.
Though with T-bills generally offering higher returns than the Fed’s RRP facility and a continued large federal government deficit leading to net T-bill issuance surging from 1Q23, MMFs have significantly reallocated into T-bills, with the RRP facility declining by trillions of dollars over the past year.
When funds are reallocated from the Fed’s RRP facility into T-bills, to the extent that the federal government spends the money received from increased net issuance (as opposed to simply using it to build its Treasury General Account (TGA)), this stimulates the economy by injecting otherwise idle funds into the real economy, boosting bank deposits. It is therefore no coincidence that the decline in bank deposits reversed and M2 stabilised, when the RRP facility began to drain significantly. This acted to break the link between the Fed’s QT and bank deposits (recall the chart posted above).
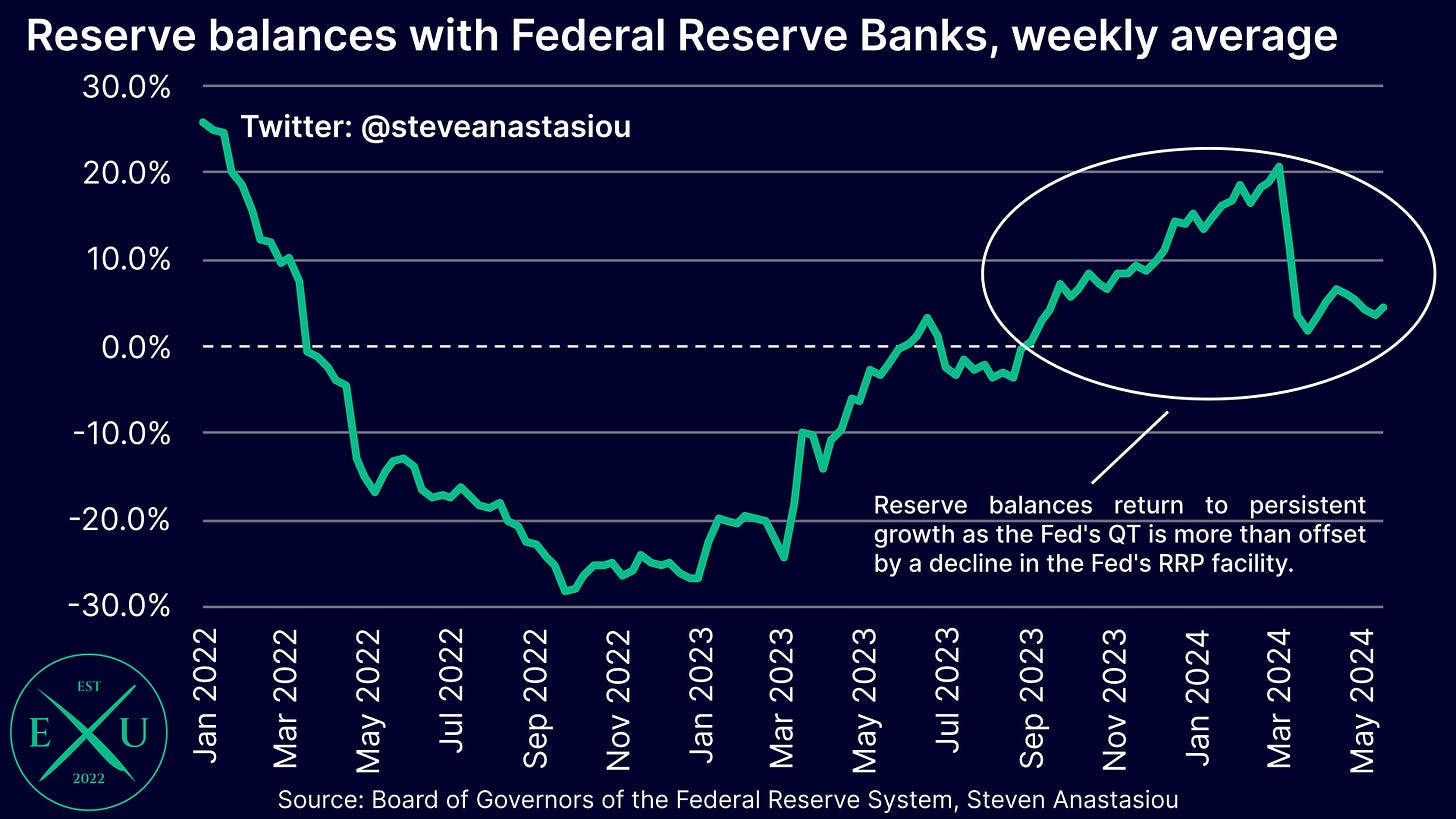
Another consequence of lower RRP balances, is that it can result in an increase in bank reserves — note how the beginning of the significant decline in RRP balances correlates to the rate of decline in bank reserves beginning to moderate and eventually turning YoY positive.
The support to bank deposits and liquidity provided by the draining of the RRP facility amidst a large federal government deficit, are likely key reasons for why the US economy has been more resilient than most expected over the past year, and for why asset prices like equities have continued to record strong price growth.
While the RRP boost is getting closer to an end, a broadly favourable liquidity backdrop is expected in 2H24 — but will it be enough to materially boost the US economy?
While bank reserves have taken a hit in 2Q24 on account of the significant federal government surplus in April, a more favourable liquidity backdrop is expected in 2H24 as the pace of QT is reduced and as the federal government budget returns to delivering large quarterly deficits, which is expected to result in further material net T-bill issuance and a further drain of the RRP facility.
The latest Treasury refunding documents included an estimate for net T-bill issuance of $290bn and a $100bn increase in the TGA in 3Q24, which would result in a potential liquidity injection of ~$190bn if it were funded entirely by shifts out of the RRP facility. Given that this is well above the newly scheduled quarterly QT pace of ~$120bn (which is down from the quarterly pace of ~$225bn prior to the Fed’s decision to scale back the pace of QT), there could be another increase in net liquidity in 3Q24.
Assuming a similar funding backdrop in 4Q24 points to the potential for increases in liquidity throughout 2H24.
Given that bank lending also continues to grow (albeit modestly) and that bank security holdings are now also expanding (with growth likely to be further supported by the moderation in the pace of QT), this confluence of factors is likely to support bank deposit growth across 2H24, providing further support to the economy.
While increased liquidity may have favourable impacts for some asset markets, whether this stimulatory offset is enough to materially boost the real economy, is far less clear. A key reason for this uncertainty, is that despite a lower pace of QT, the potential increase in net T-bill issuance during 2H24 is likely to be much lower than the 1Q23-1Q24 quarterly average of $492bn, across which time the employment market still saw a significant weakening (as discussed in the “Employment” section of this report).
Looking beyond 2024, with the RRP facility currently below $400bn, the stimulatory benefit of funding part of the federal government deficit from idle funds is likely to be largely exhausted by the end of the year. Ongoing QT amidst a fully drained RRP facility would result in significant reductions in bank reserves over time and deliver a more potent headwind to bank deposit growth. This may act to materially increase the risk of a recession in 2025.
Though given the Fed’s move to reduce the pace of QT despite reserves remaining in abundance, I would not be surprised if the Fed decided to further taper the pace of QT (or end it altogether) around the end 2024 or in 1H25, in the event of a material economic weakening.
GDP, personal spending and income
Last updated: 5 July 2024
When analysing US GDP data, I tend to exclude two components from the equation — net exports, and changes in private inventories.
One reason for doing this, is that the volatility of these items can significantly skew the underlying economic picture. In addition to being volatile, net exports can provide misleading signals about the economy as a result of the imports component — for while rising imports generally point to increased consumption, increases in imports subtract from GDP. Meanwhile, changes in the volatile private inventories component tend to smooth themselves out over time, with the average quarterly contribution to GDP from this component being 0.03 percentage points since 2000.
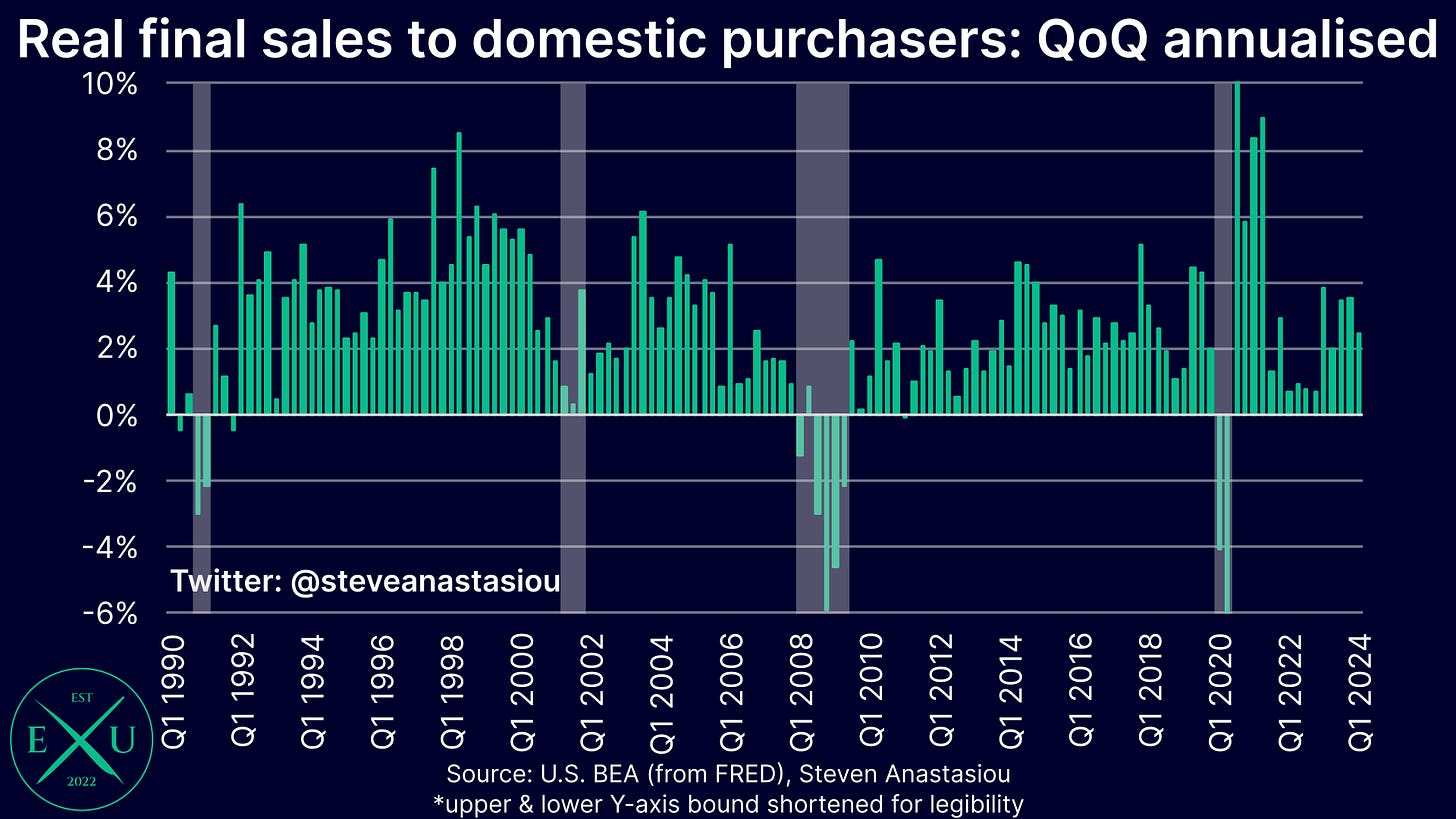
Excluding these two items results in a metric called real final sales to domestic purchasers, which provides a better measure of changes in underlying economic activity.
1Q24 real final sales to domestic purchasers growth moderates as real PCE growth decelerates materially
The final estimate of 1Q24 GDP data showed that real final sales to domestic purchasers growth of 2.4%, down from 3.6% in 4Q23.
While this still represents fairly solid growth, it is below the average quarterly annualised growth rate of 2.7% that was recorded across 2015-19.
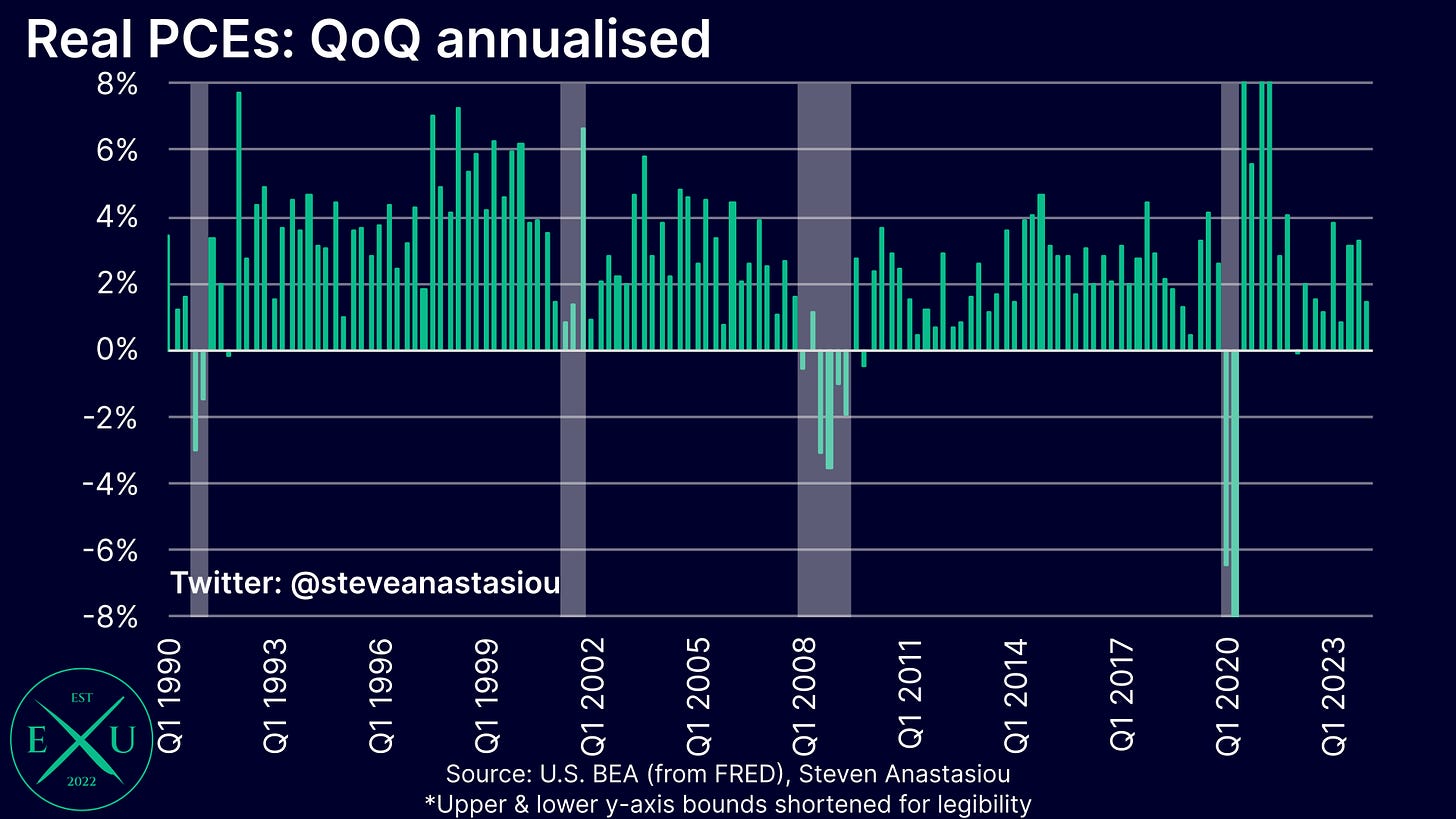
Of greater significance was the primary reason for this moderation — a major reduction in real personal consumption expenditure (PCE) growth.
1Q24 growth was 1.5% annualised versus 3.3% in 4Q23. Growth in 1Q24 was materially below the 2015-19 quarterly average of 2.6% annualised.
The major decline in real disposable income growth may be reaching a tipping point for the wider economy
What makes the downward revision to 1Q24 real PCE growth more concerning, is that it has come alongside a major moderation in real disposable income growth.
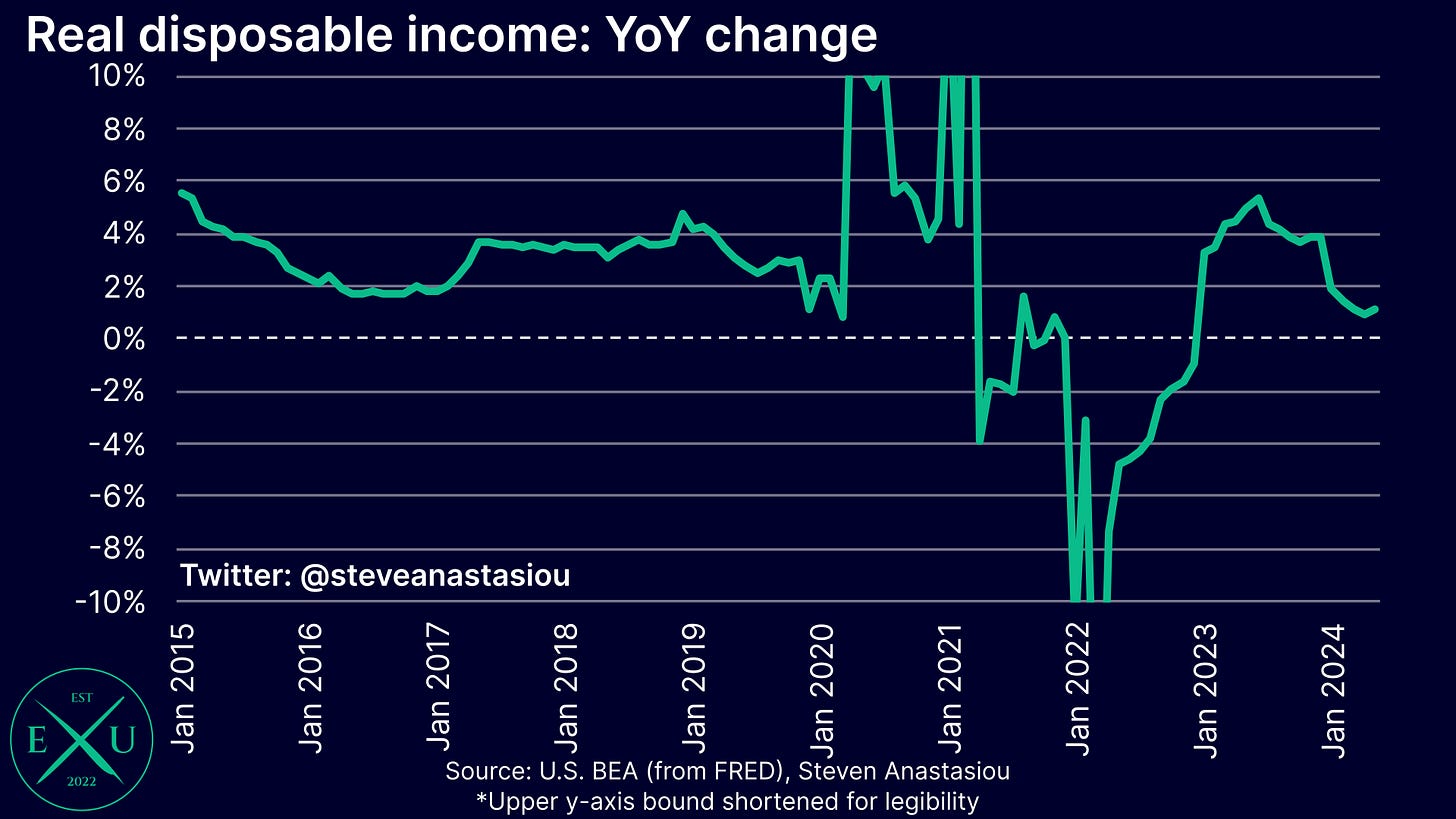
While MoM growth bounced back in May as private industry wage growth rose and headline inflation was MoM negative, real disposable income growth was just 1.1% YoY in May.
YoY growth is now significantly below the average growth rate of 3.1% YoY that was recorded across 2015-19.
Given that this major moderation in real disposable income growth has been occurring for some time, relatively solid real personal consumption growth has been unsustainably driven by declining savings rates.
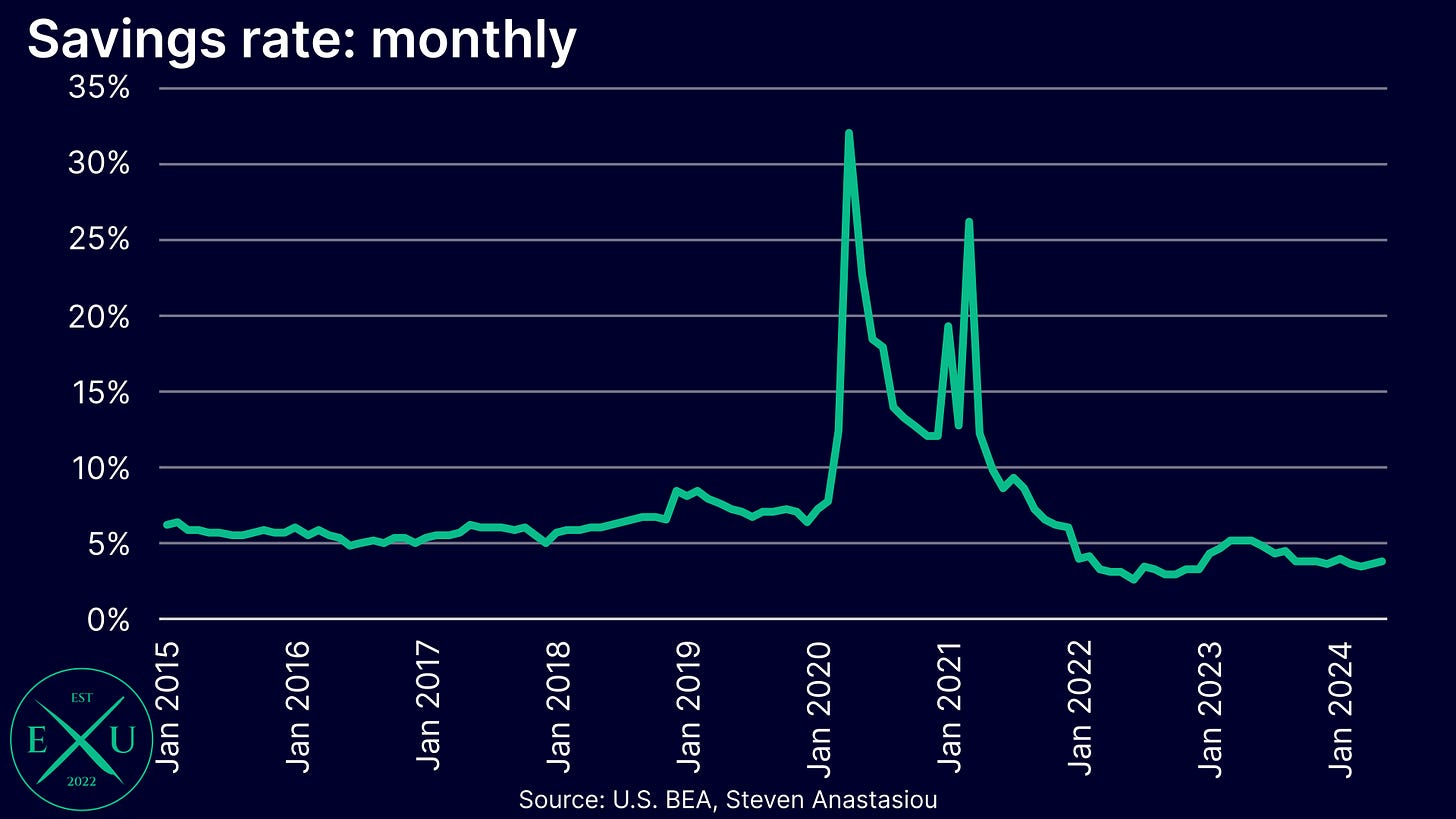
With savings rates just 3.9% in May — which is well below the 2015-19 average of 6.2% — there is now much more limited scope for significant further declines in savings rates to support continued robust PCE growth.
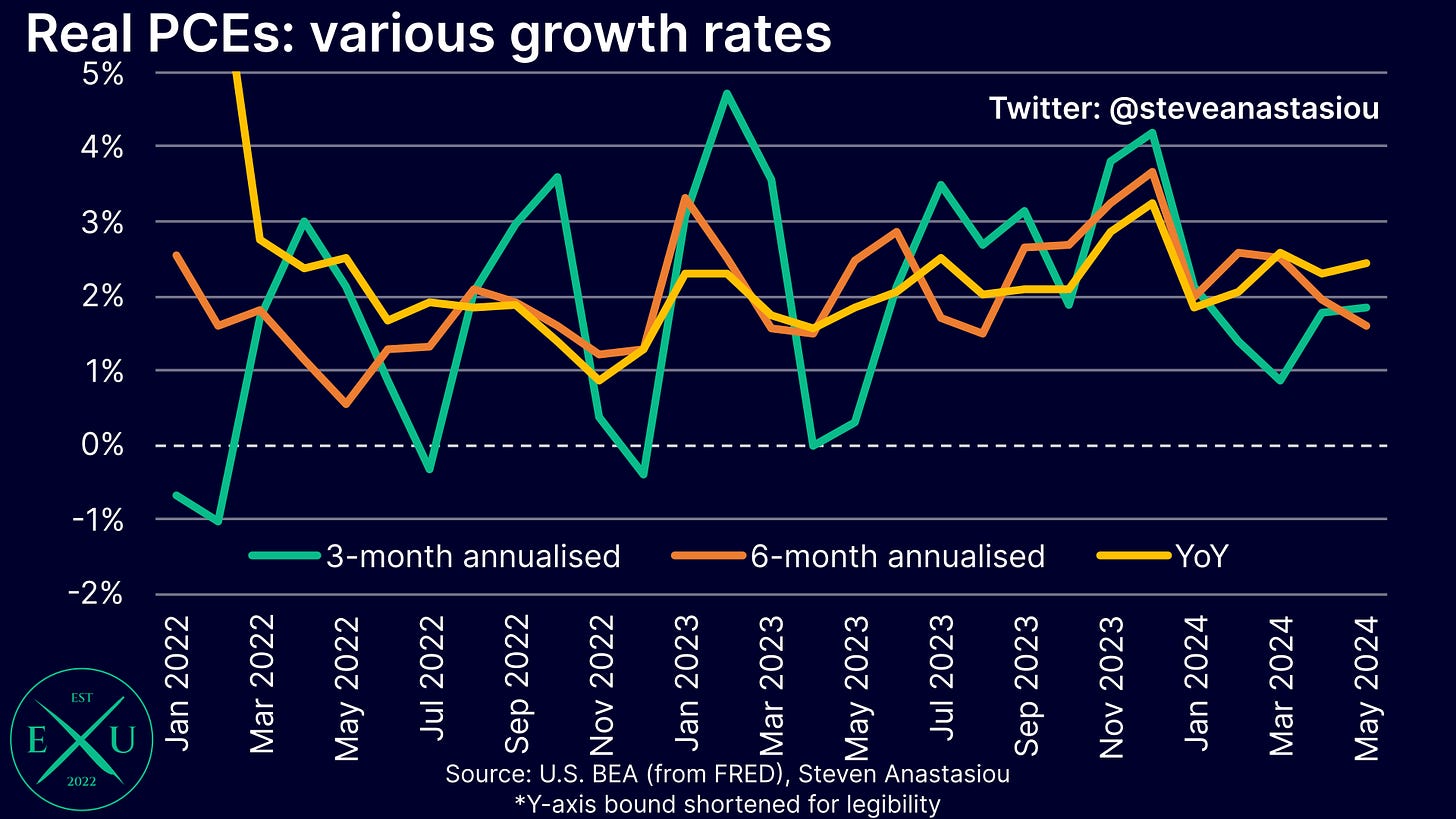
In my last update I wrote that this backdrop made it difficult to see that PCE growth would remain anywhere near its then relatively robust 3- and 6-month annualised growth rates of 2.7% and 2.5%, respectively.
Following May’s spending data and revisions to prior months, 3- and 6-month annualised growth has fallen to a much more modest pace of 1.8% and 1.6%, respectively. Given the trends in disposable income growth, this rate of growth could continue to be seen across 2H24, or decelerate even further — what ultimately occurs is likely to depend on the strength of the employment market in 2H24.
Given such a backdrop, monthly PCE and retail sales data releases are likely to carry outsized importance over the remainder of this year and into 2025.
In terms of the latest retail sales data, a major moderation has been seen.
Given the nominal nature of retail sales data, I believe that the best way to gain a sense of the underlying growth rate is to exclude gasoline on account of the high level of volatility in gasoline prices.
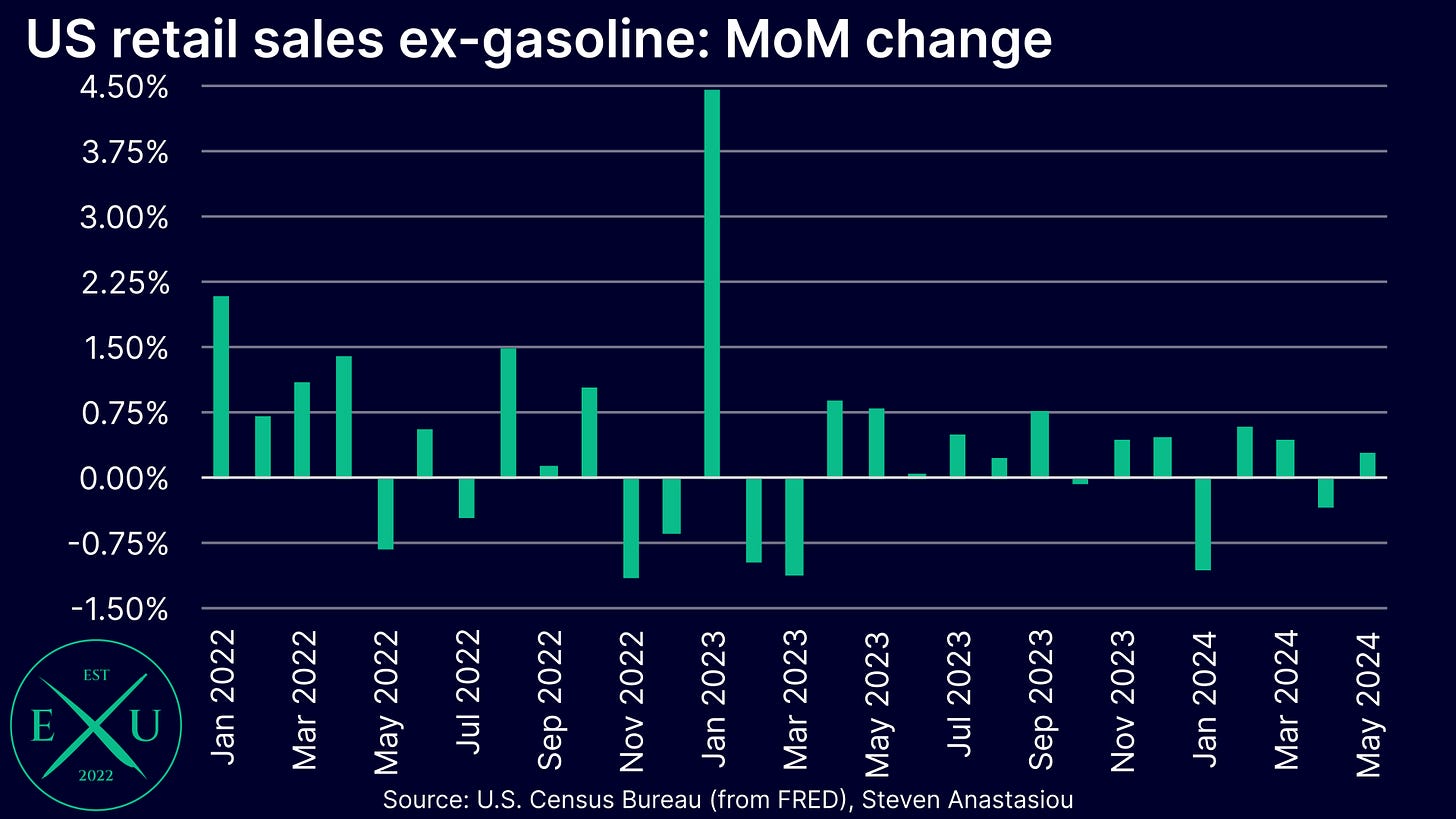
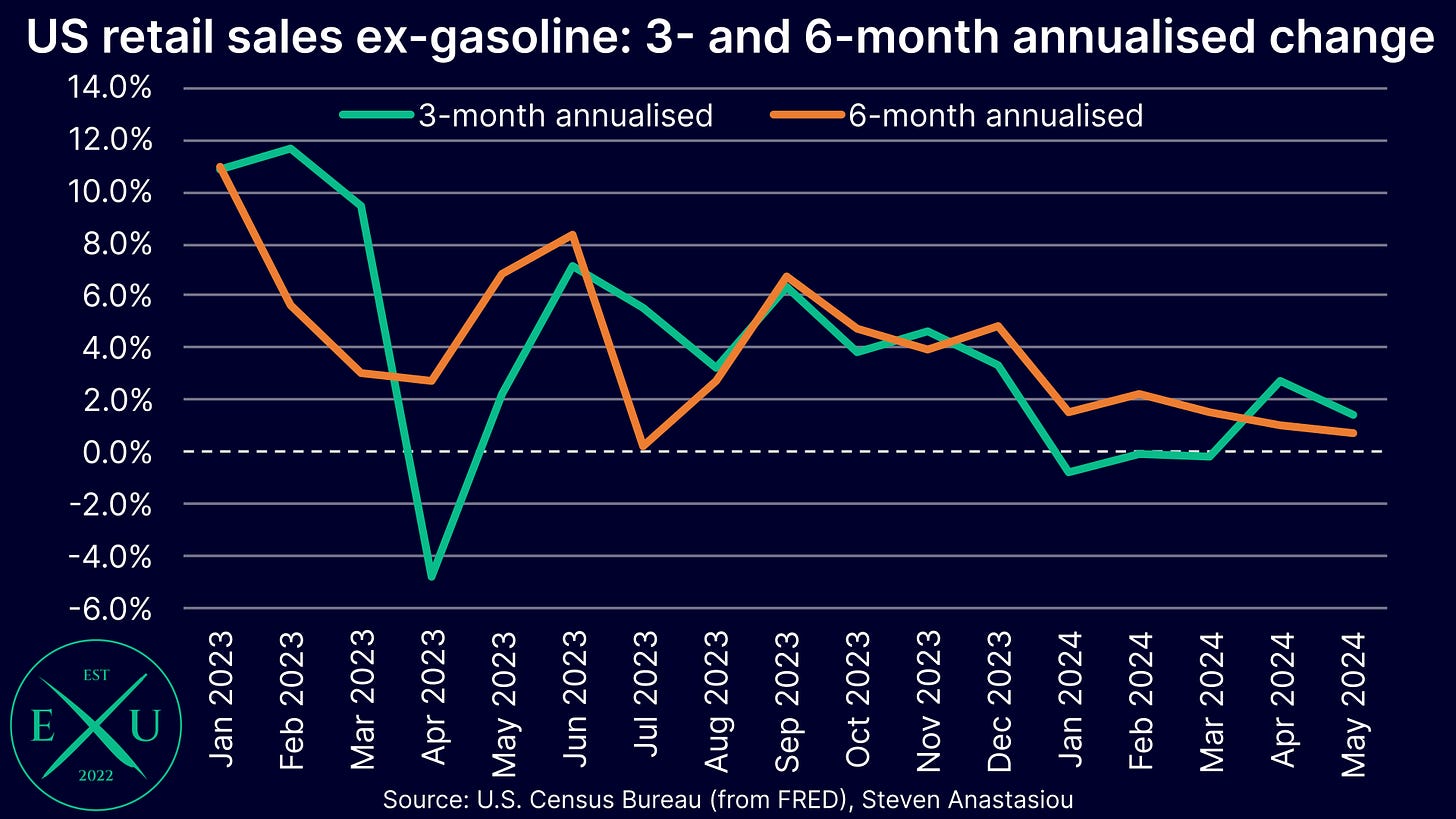
While retail sales ex gasoline rose by 0.28% MoM in May, a broader weakening trend has been seen, with retail sales still below the level recorded in December. This follows large seasonally adjusted declines in January and April.
This has seen the 6-month annualised growth rate fall to just 0.72%, its lowest level since July.
In order to remove the impact of potential shifts in seasonality, it’s also important to look at non-seasonally adjusted YoY growth. Though given the volatility in these numbers, I take a 3-month moving average of the YoY growth rate.
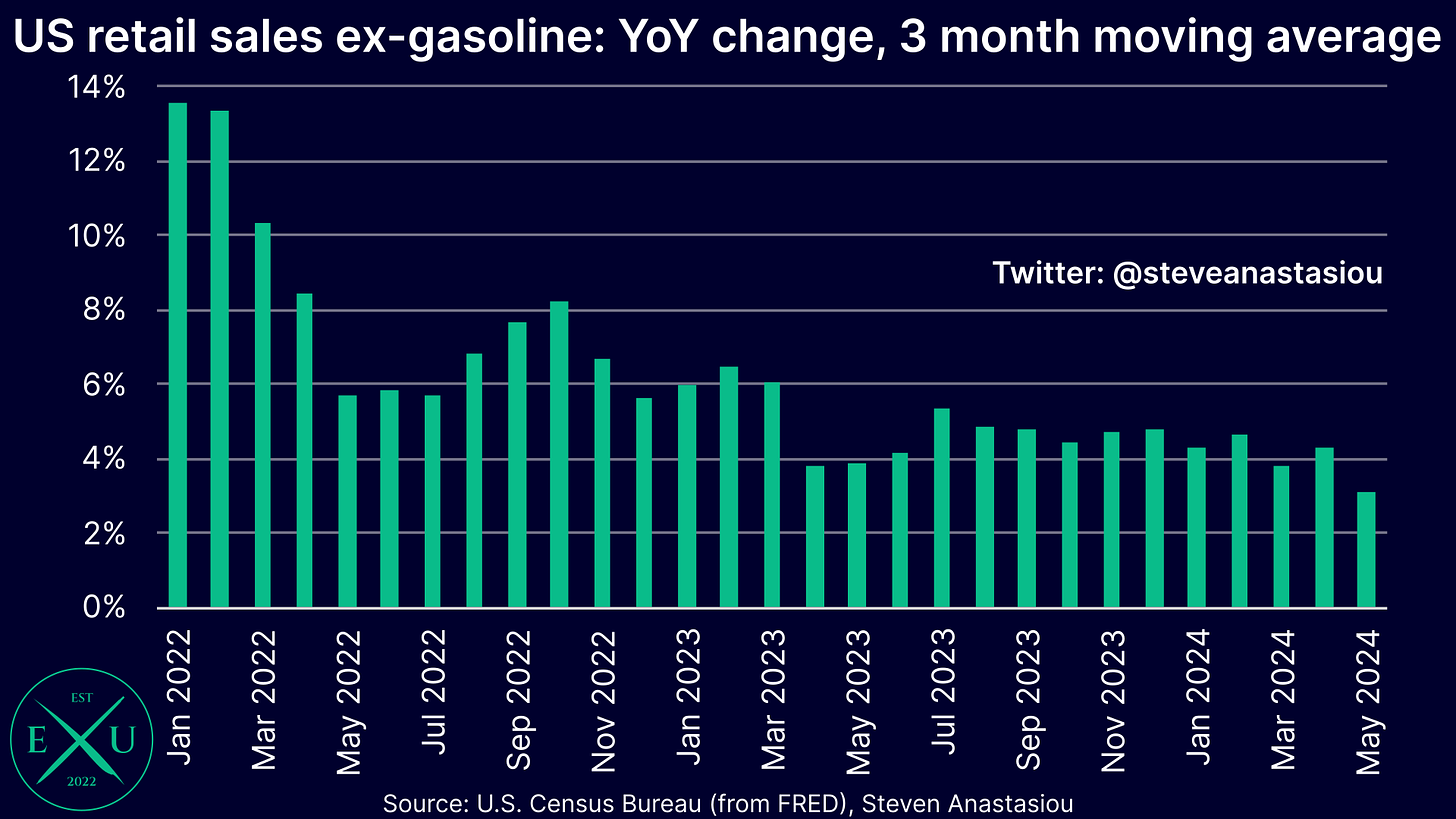
On such a basis, growth fell to 3.1% in May to its lowest level since July 2020. This represented a significant decline from the 4.3% growth rate recorded in April. Across 2015-19, YoY growth averaged 3.9% YoY.
While real PCE growth is on track to remain modest in 2Q24, base effects will help to support growth in 2Q24
Despite the slowdown in PCE growth, favourable base effects are set to support PCE growth in 2Q24. This is a result of real PCEs being MoM negative in January and recording material growth in February and March, which meant that real PCEs entered the second quarter on a relatively stronger footing than the 1Q24 average.
The below table shows that even if MoM growth was -0.3% for the second time in three months in June, that quarterly growth would still come in at 0.96%.
Employment
Last updated: 20 June 2024
While job gains appear strong, they aren’t even keeping up with population growth
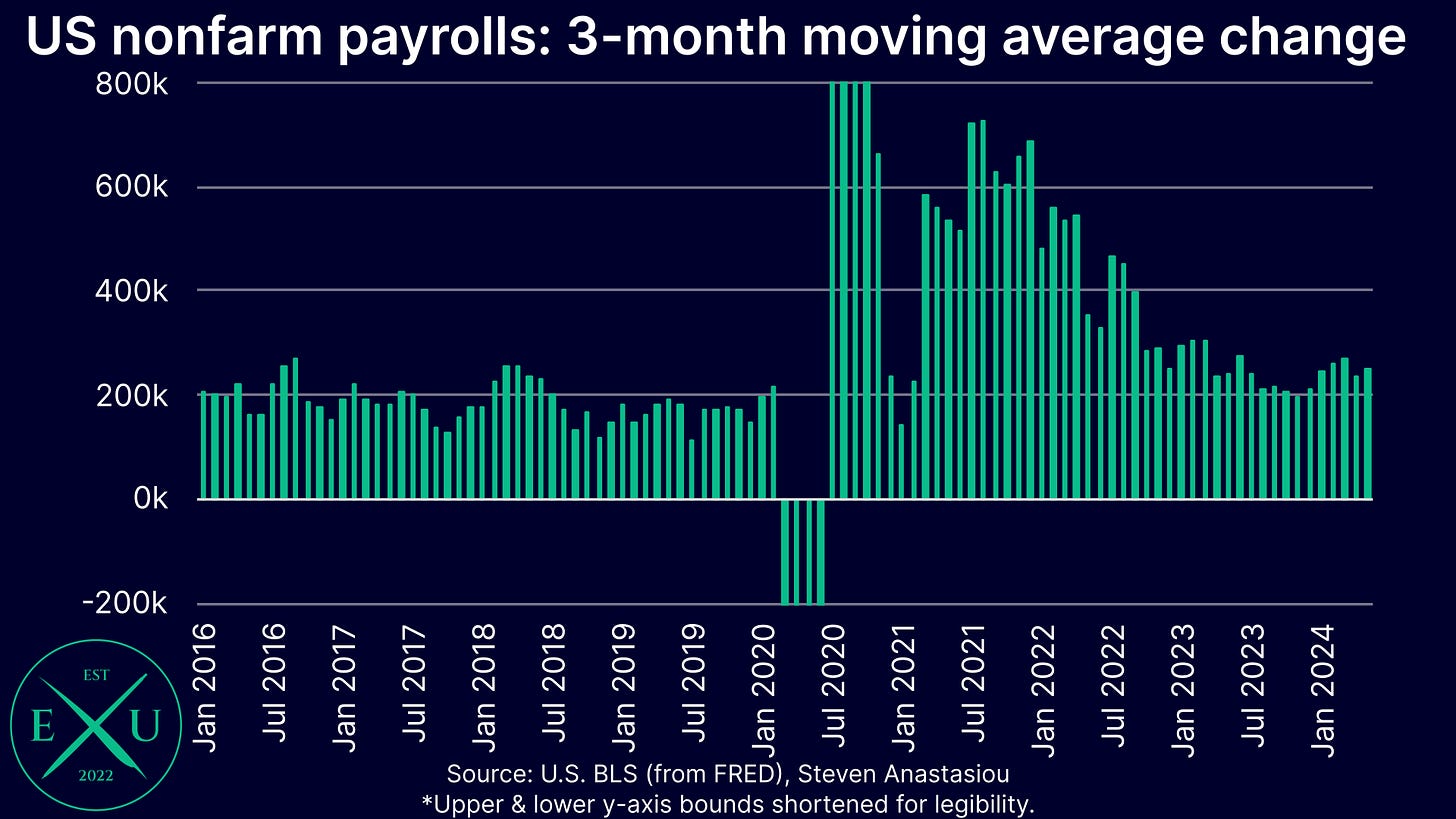
While nonfarm payroll growth appears to be relatively strong (averaging 249k a month over the past three months versus the average MoM growth rate of 190k across 2015-19), it’s important to note that much of this apparent strength is simply a reflection of increased immigration.
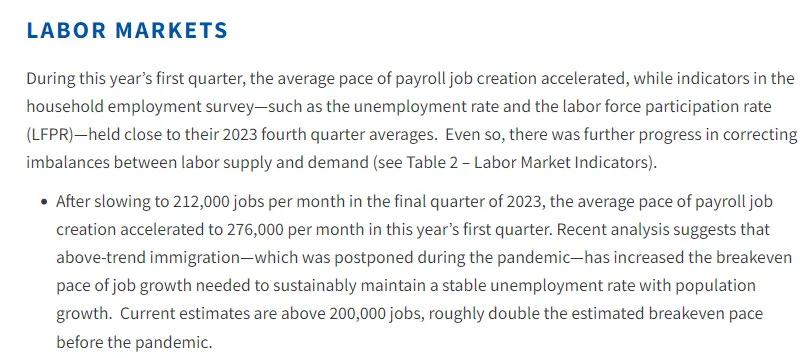
This shift was noted by Eric Van Nostrand within the Economy Statement that accompanied the Treasury’s most recent quarterly refunding announcement, which stated that “recent analysis suggests that above-trend immigration … has increased the breakeven pace of job growth needed to sustainably maintain a stable unemployment rate with population growth. Current estimates are above 200,000 jobs, roughly double the estimated breakeven pace before the pandemic.”
While the household survey, and not the establishment survey, is used to calculate the unemployment rate, persistent increases in the unemployment rate highlight how nonfarm payroll growth is not as strong as the consensus position seems to believe.
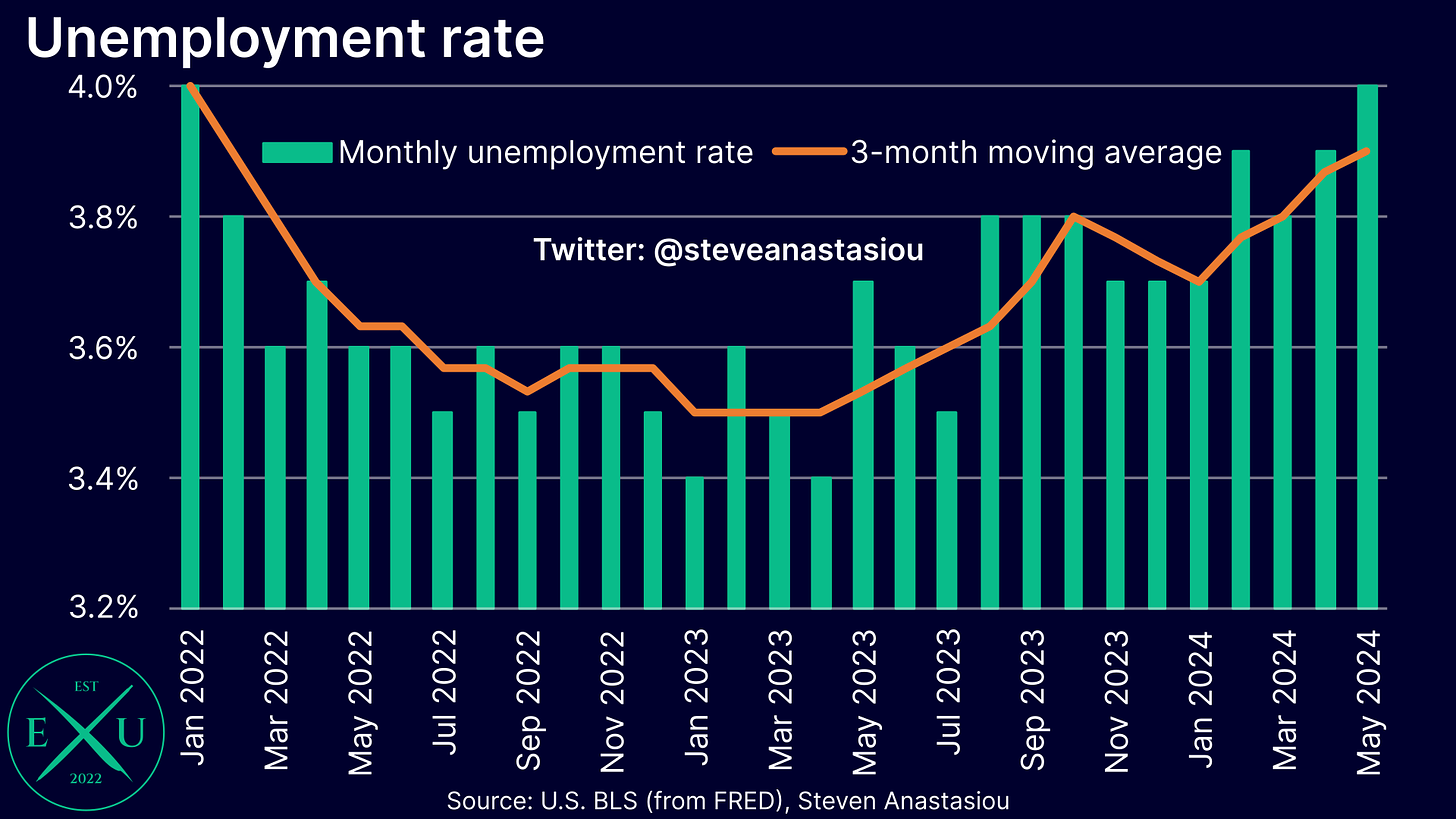
The unemployment rate has risen from 3.5% in July, to 4.0% in May, its highest level since January 2022. On a 3-month moving average basis, the unemployment rate was 3.9%, its highest level since February 2022.
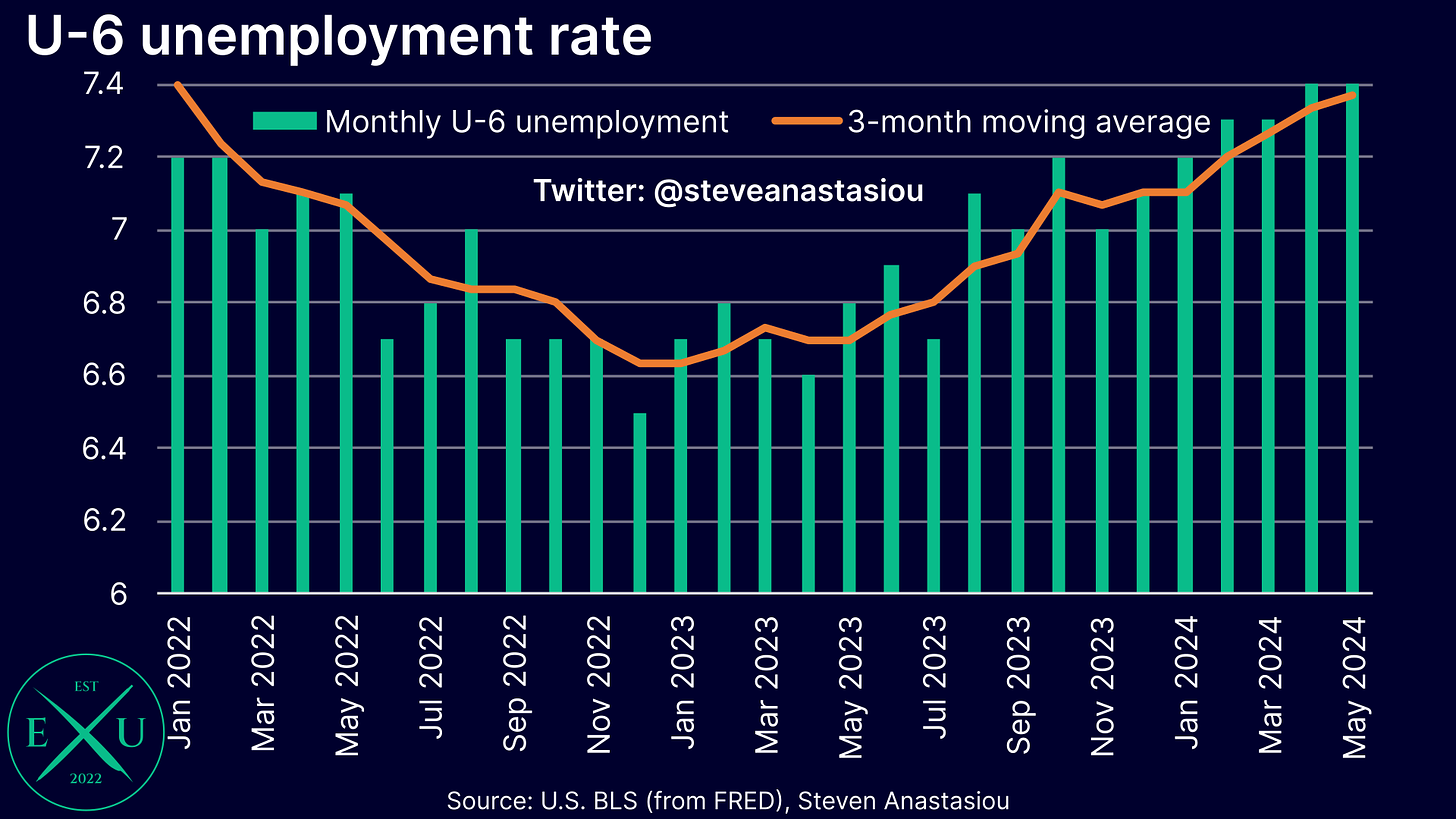
Further still, the U-6 unemployment rate, which also measures underemployment, is currently sitting at 7.4%, its highest level since November 2021, and up significantly from its cycle trough of 6.5%.
On a 3-month moving average basis, the U-6 unemployment rate rounded to 7.4% in May, its highest level since January 2022.
A major weakening has been seen across a broad array of labour market measures
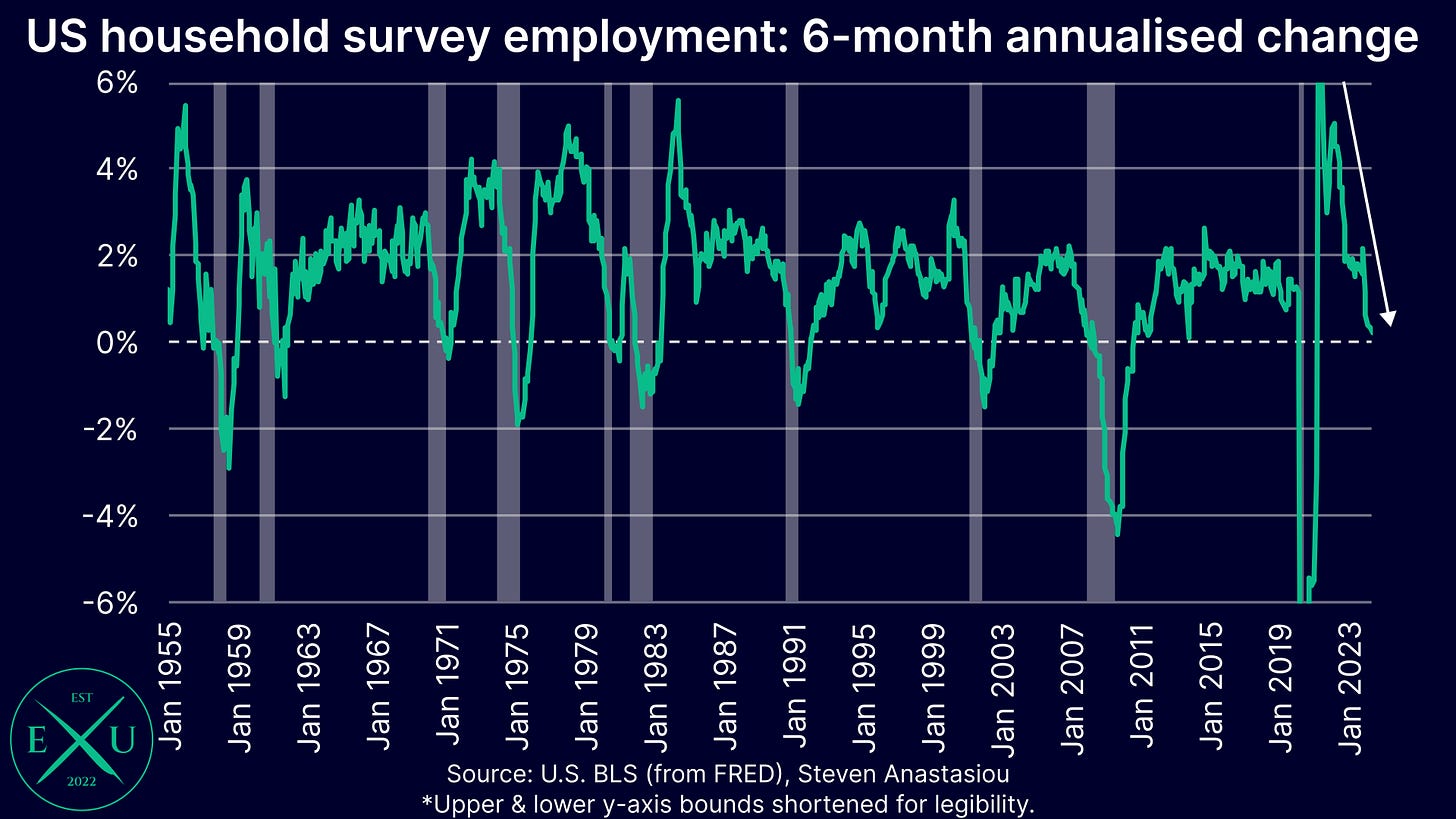
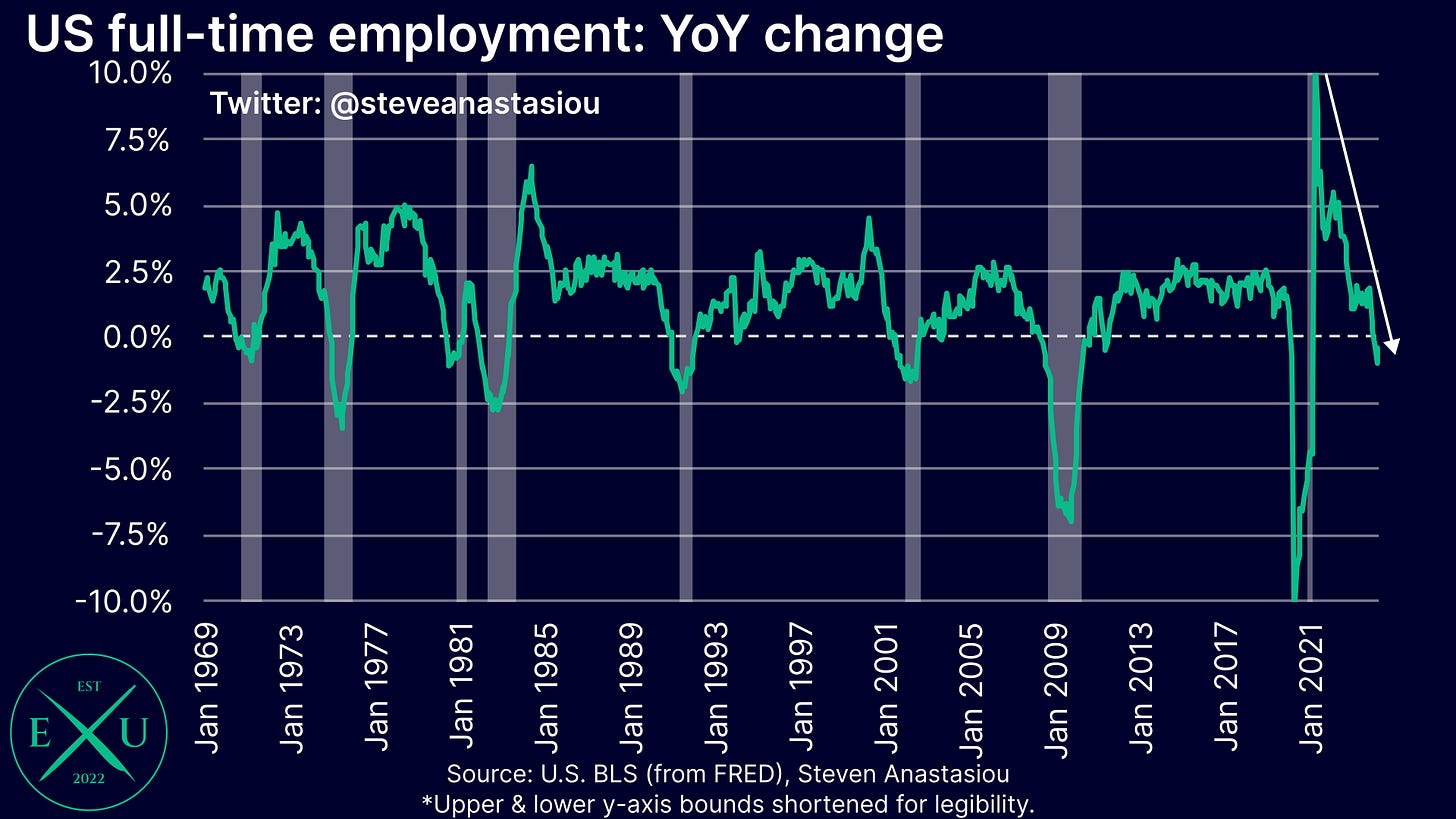
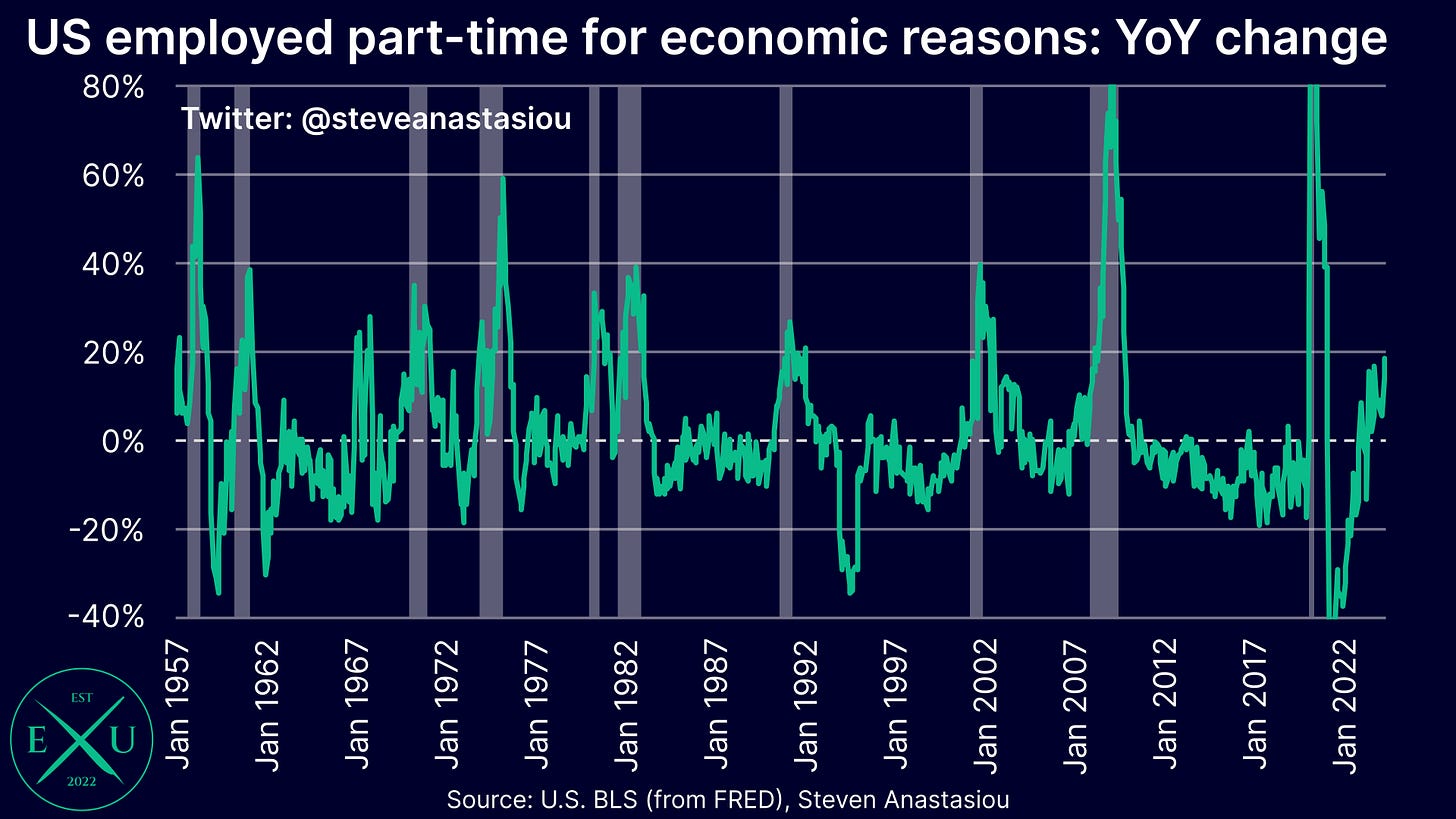
In addition to the material increases in unemployment rates, a major weakening has been seen across a broad array of employment measures. This includes:
Household survey employment slowing to just 0.2% YoY.
Full-time employment growth turning YoY negative.
The number of individuals employed part-time for economic reasons moving materially higher on a YoY basis.
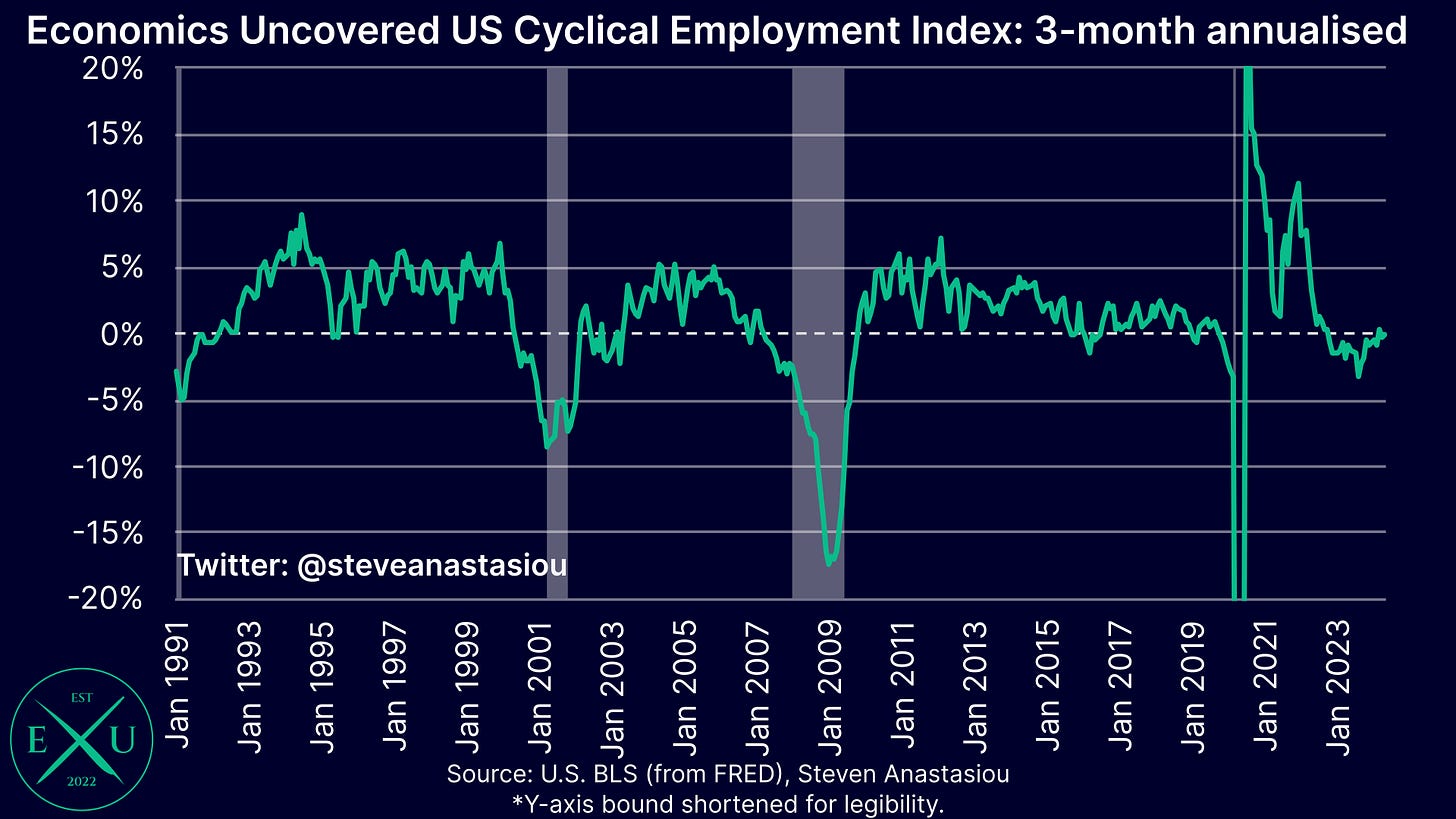
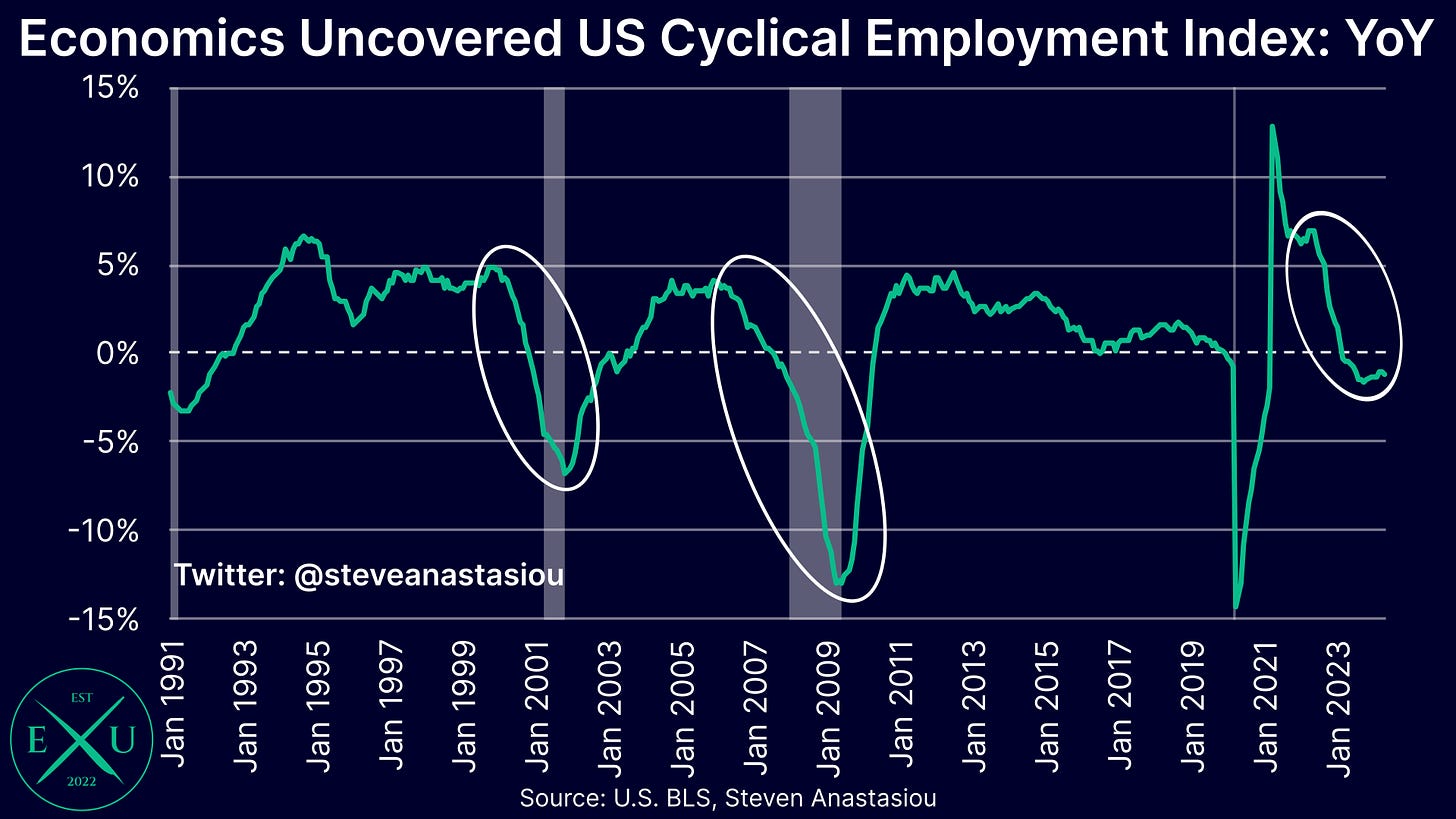
The Economics Uncovered Cyclical Employment Index continuing to stagnate, with 3-month annualised growth of -0.1% and YoY growth of -1.1% recorded in May.
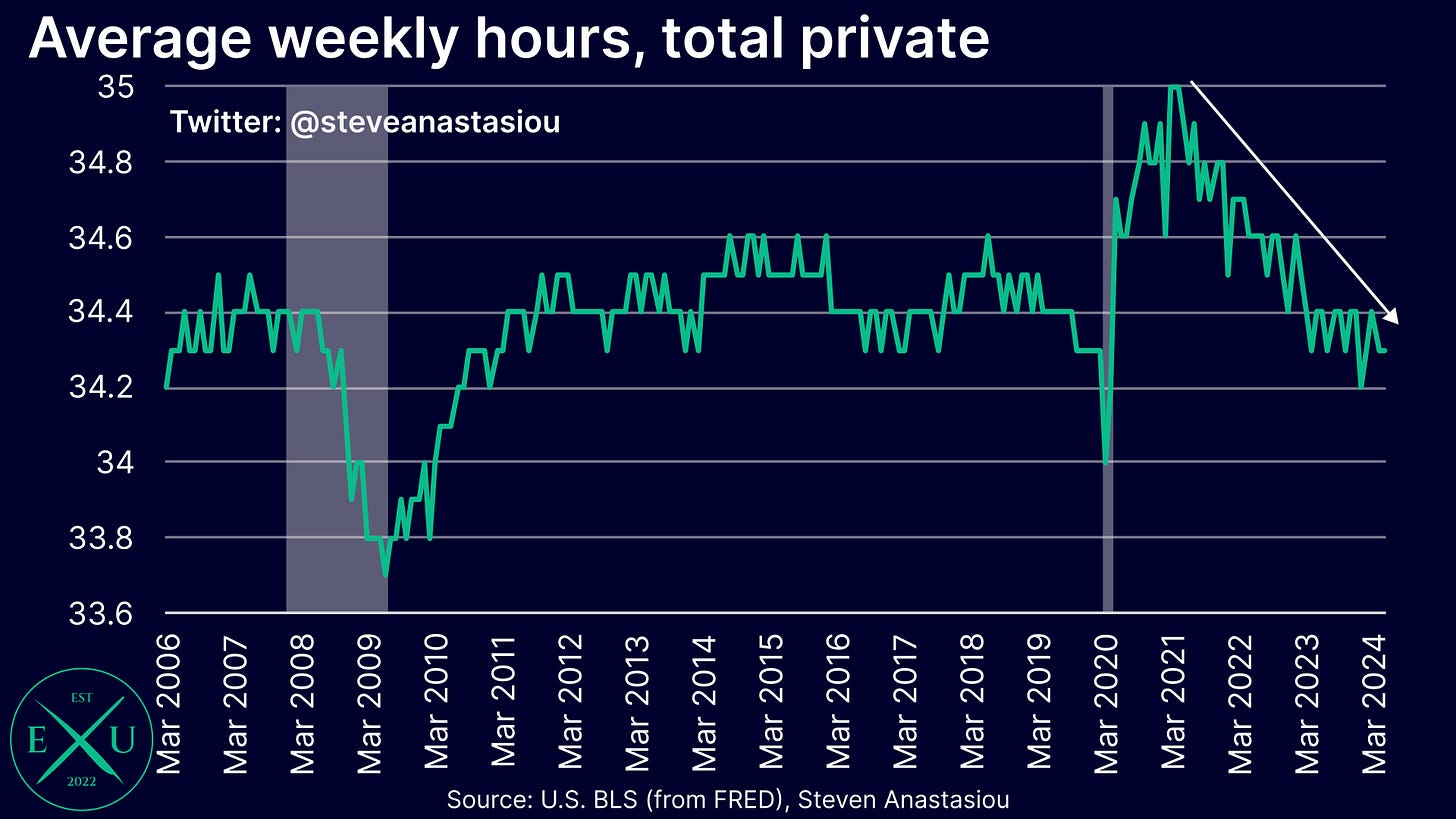
Average weekly hours moderating significantly from cycle peaks.
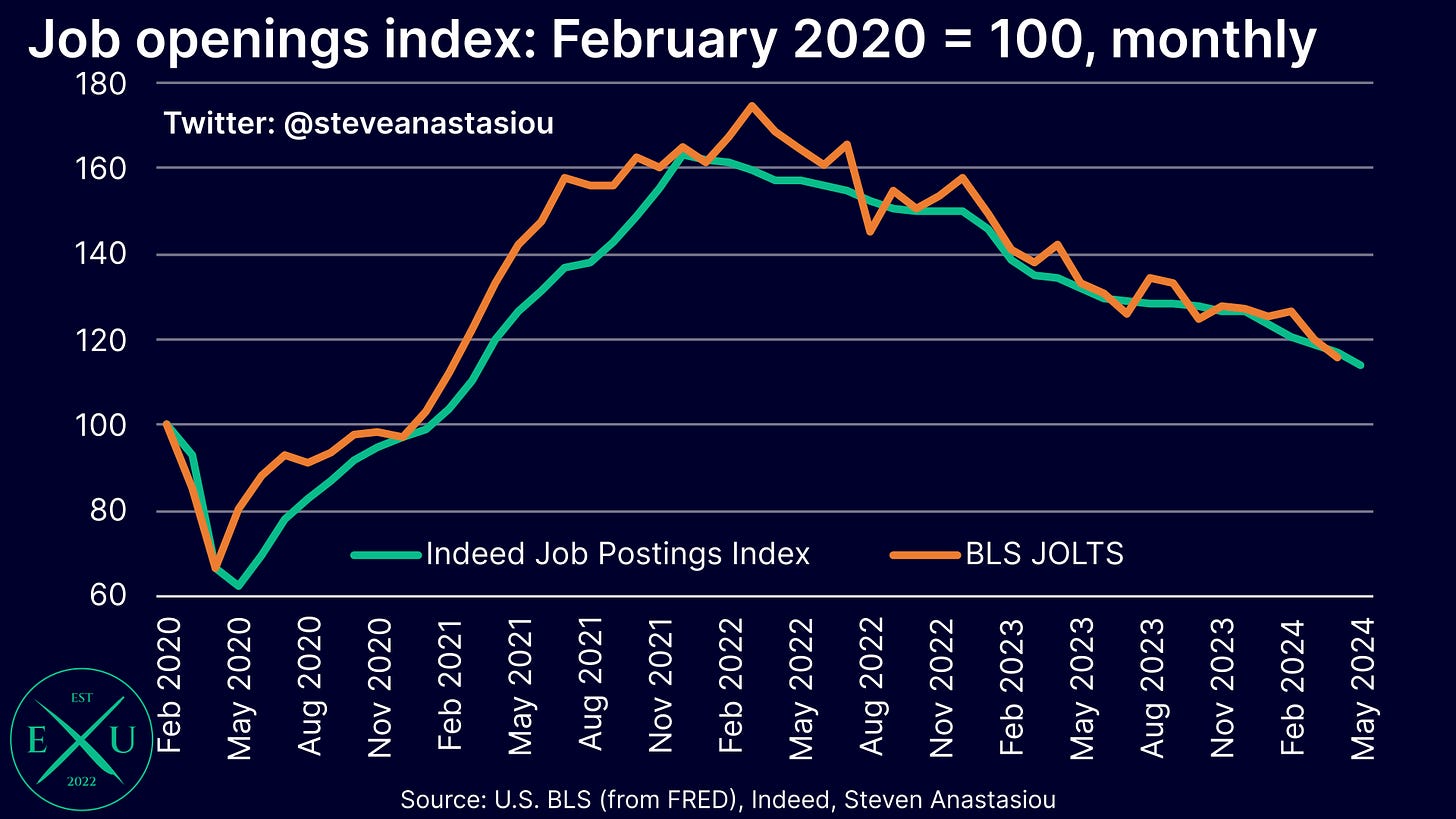
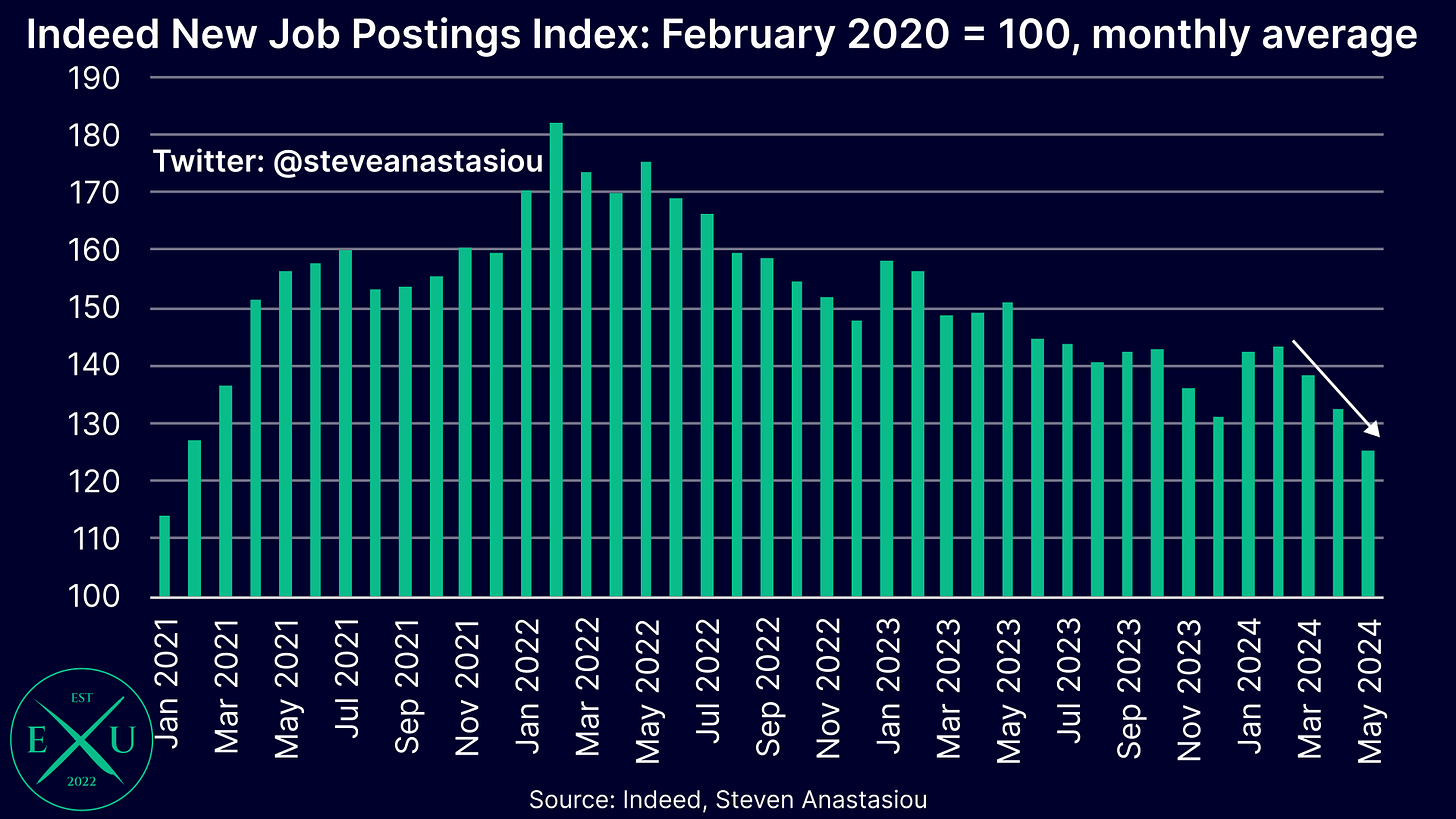
The rate of job openings, as measured by Indeed (which is a leading indicator of BLS job openings), falling for an 18th consecutive month in May.
The rate of new job openings, as measured by Indeed, declining by over 5% MoM in May, the largest drop since December 2020.
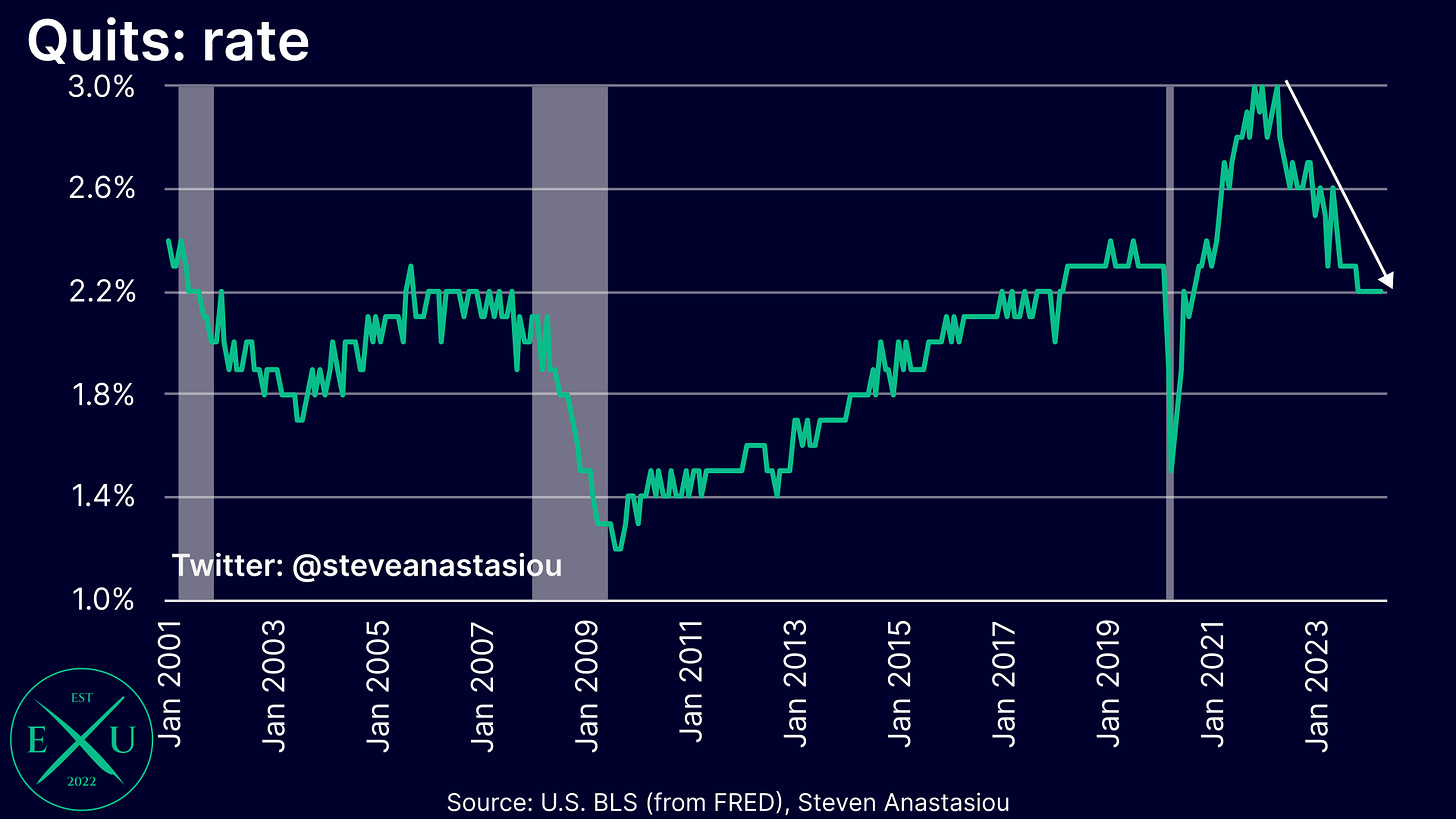
The rate of quits falling to 2.2%, representing a major decline from cycle peaks.
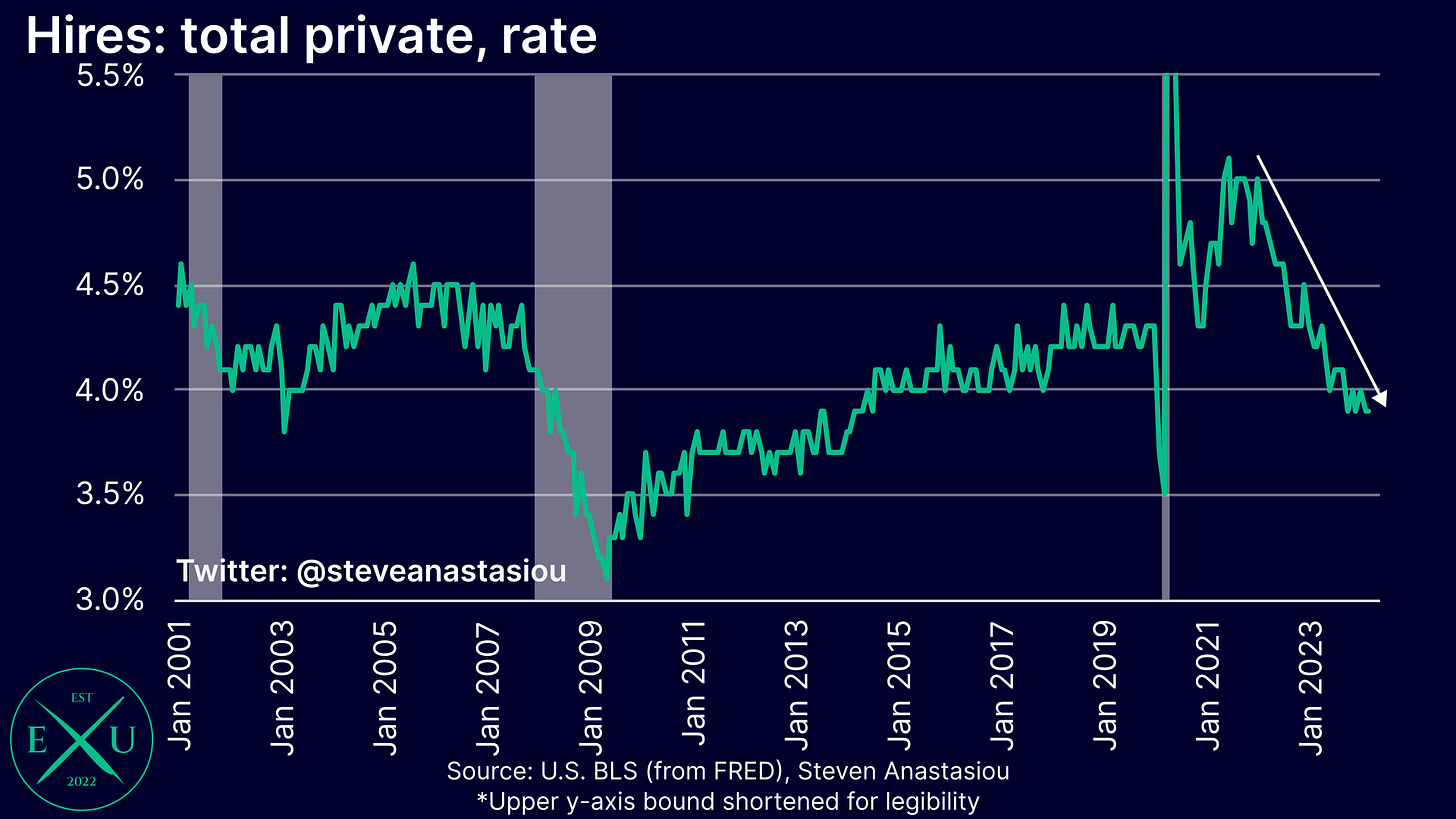
The private hiring rate falling to 3.9%, marking a major decline from its cycle peak. Excluding the COVID period, this is the lowest hiring rate that’s been seen since August 2014.
The pathway of least resistance is for a further weakening, which could see the unemployment rate move sharply higher — even if job growth remains positive
While off of its trough, with the M2 money supply remaining relatively constrained by the Fed’s tightening, the pathway of least resistance is for a further weakening of the employment market. While a potentially improved liquidity backdrop in 2H24 versus 2Q24 may help to boost the US economy and job market, given that net T-bill issuance is likely to be materially less than the 1Q23-1Q24 average (over which time the US job market has weakened materially), it appears unlikely that this would provide enough stimulus to deliver a material improvement in the employment market.
With job growth already failing to keep pace with increases in the labour force, any further material weakening of the employment market could see the unemployment rate head well above 4% at some point during 2024.
Given higher immigration levels, this could perplex many market participants and catch others off guard, as an increase in the unemployment rate to levels well above 4% could occur alongside nonfarm payroll growth remaining notably above 100k per month (i.e. the rough historical breakeven rate of monthly employment growth).
Inflation
Last updated: 20 June 2024
CPI growth materially decelerates a month earlier than expected as services prices see broad disinflation
As outlined in my latest medium-term US CPI forecast update, I had been expecting materially lower MoM growth to occur from June.
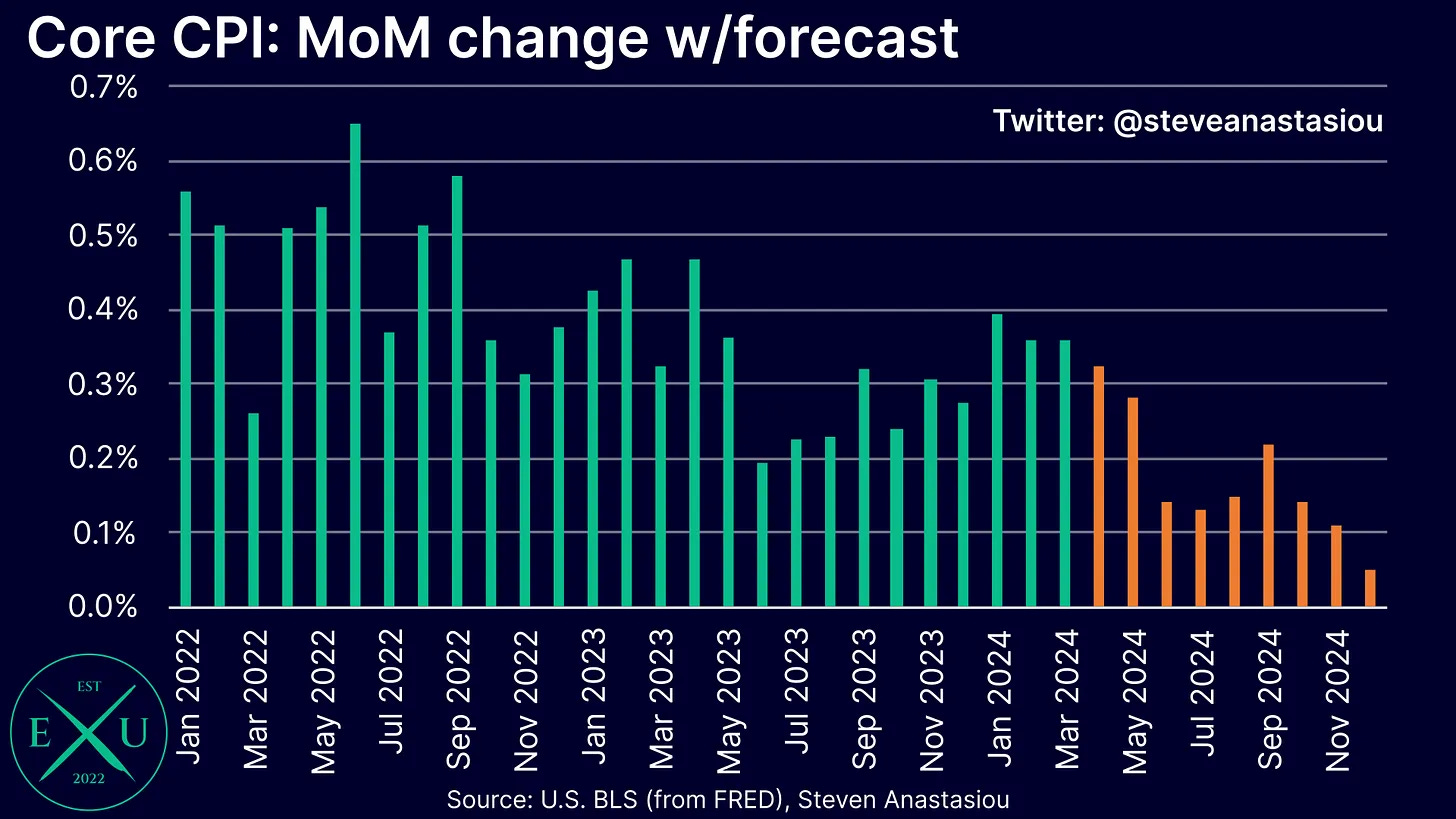
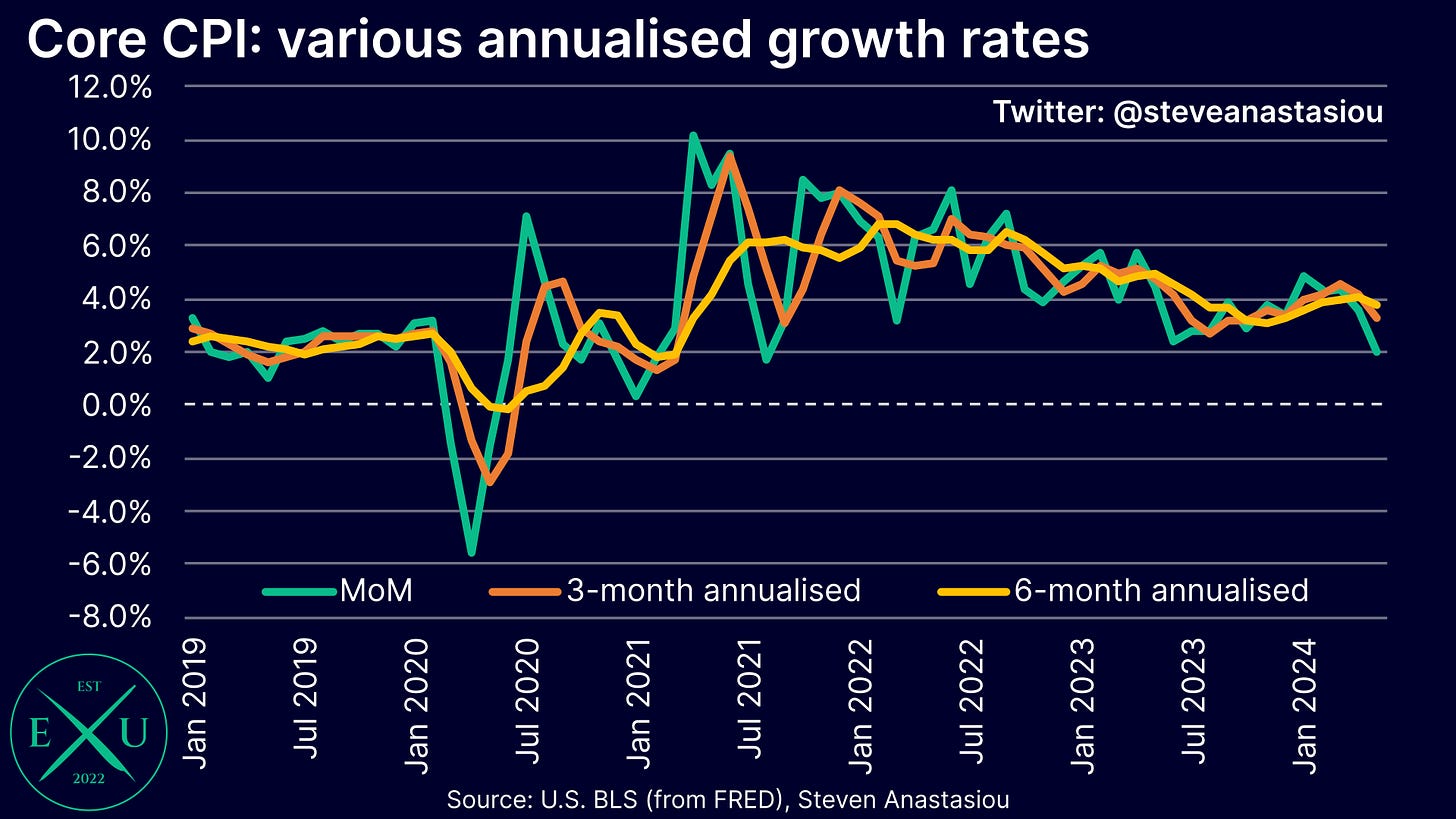
Instead, material disinflation arrived a month earlier than expected, with May’s core CPI growth coming in at 0.16% MoM versus my finalised CPI Preview forecast of 0.32% and consensus expectations of 0.3%. This was the lowest MoM growth rate that had been seen since August 2021, which was also the last time that MoM growth had come in below 2% annualised. This resulted in 3-month annualised growth falling to 3.3% (from 4.1%) and 6-month annualised growth falling to 3.7% (from 4.0%).
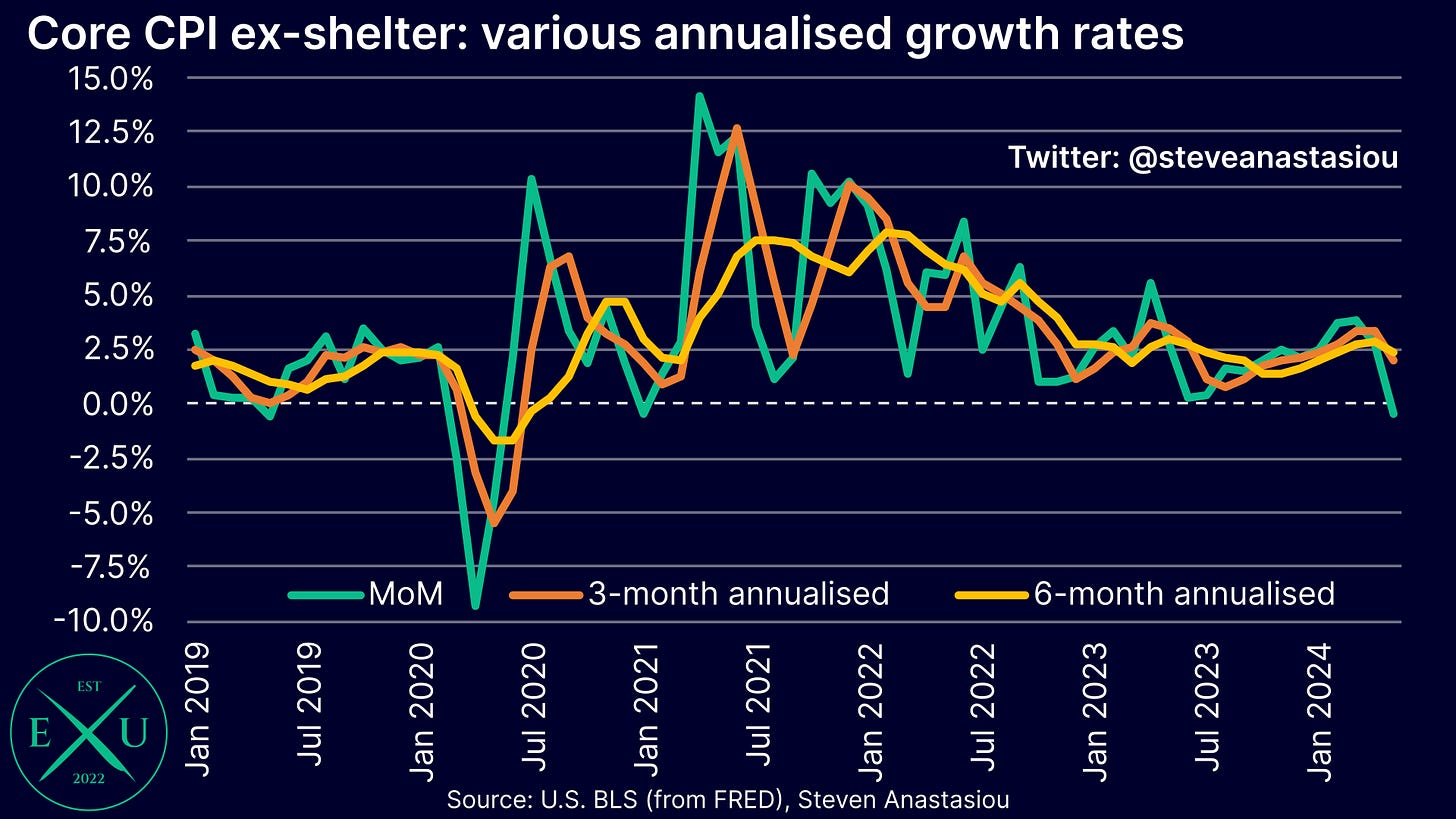
On an ex-shelter basis, core CPI growth came in negative for the first time since January 2021, at -0.04% MoM. This took the 3-month annualised growth rate down to 2.0% (from 3.4%) and the 6-month annualised growth rate down to 2.4% (from 2.9%).
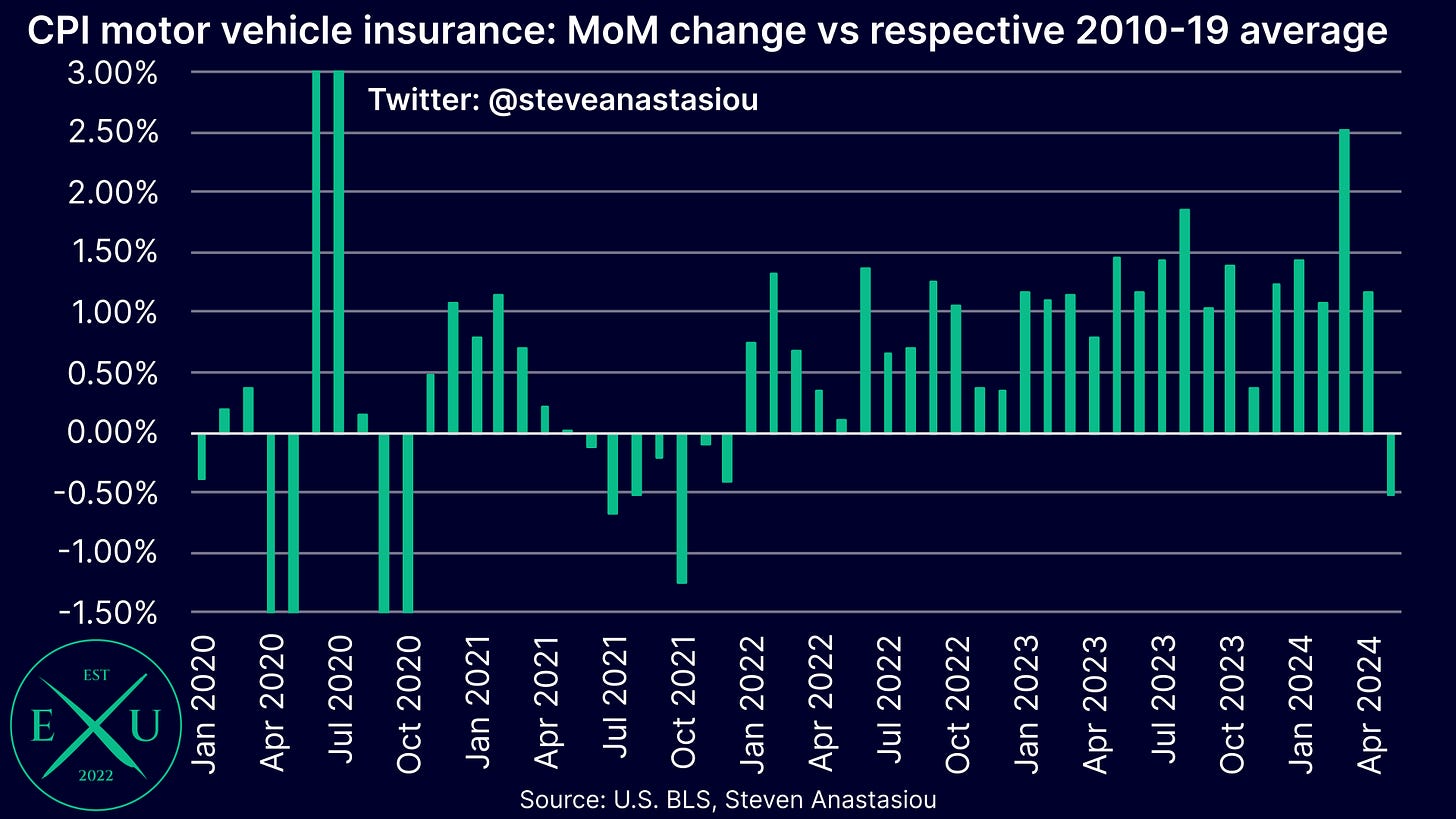
What made this disinflation all the more significant, is that as opposed to an abnormally large decline in durables or nondurables prices, it was instead largely driven by a major moderation in supercore services (i.e. core services less shelter) price growth, including the first MoM decline in CPI motor vehicle insurance prices since December 2021.
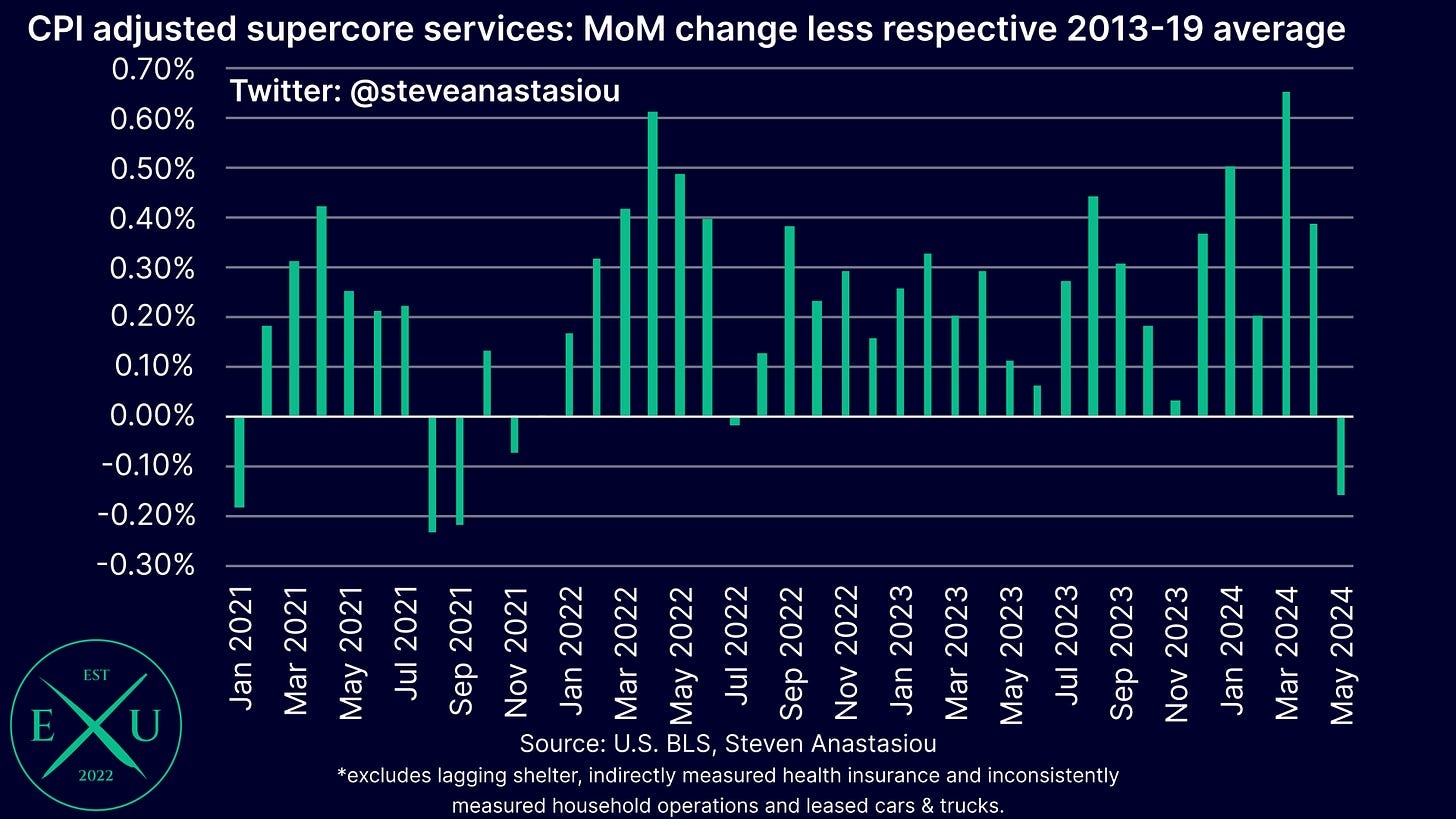
Overall adjusted supercore services (i.e. less indirectly measured health insurance, inconsistently measured leased cars & trucks and inconsistently measured household operations) price growth came in at 0.08% MoM. This resulted in MoM growth that was below the respective 2013-19 average for the first time since July 2022 and the lowest rate of relative MoM growth since September 2021.
For further detail on the latest US CPI report, please see “US CPI Review: May 2024 (plus a Fed & PPI update)”.
From vehicle price trends to wage growth to spot market rents, the reasons for significant 2H24 disinflation are numerous
In addition to the positive signs seen in May, there are a number of key factors that point to a significant reduction in the rate of inflation in 2H24.
Continued constraints in the M2 money supply
When analysing the medium-term inflation outlook, it’s important to firstly consider the money supply, as this will determine whether there is a gradual increase or decrease in price pressures over time. As discussed above, the Fed’s tightening has, and is likely to continue to lead to, relative constraints in the growth rate of M2.
As such, further disinflation is likely to occur over the medium-term.
Vehicle price trends continue to weaken
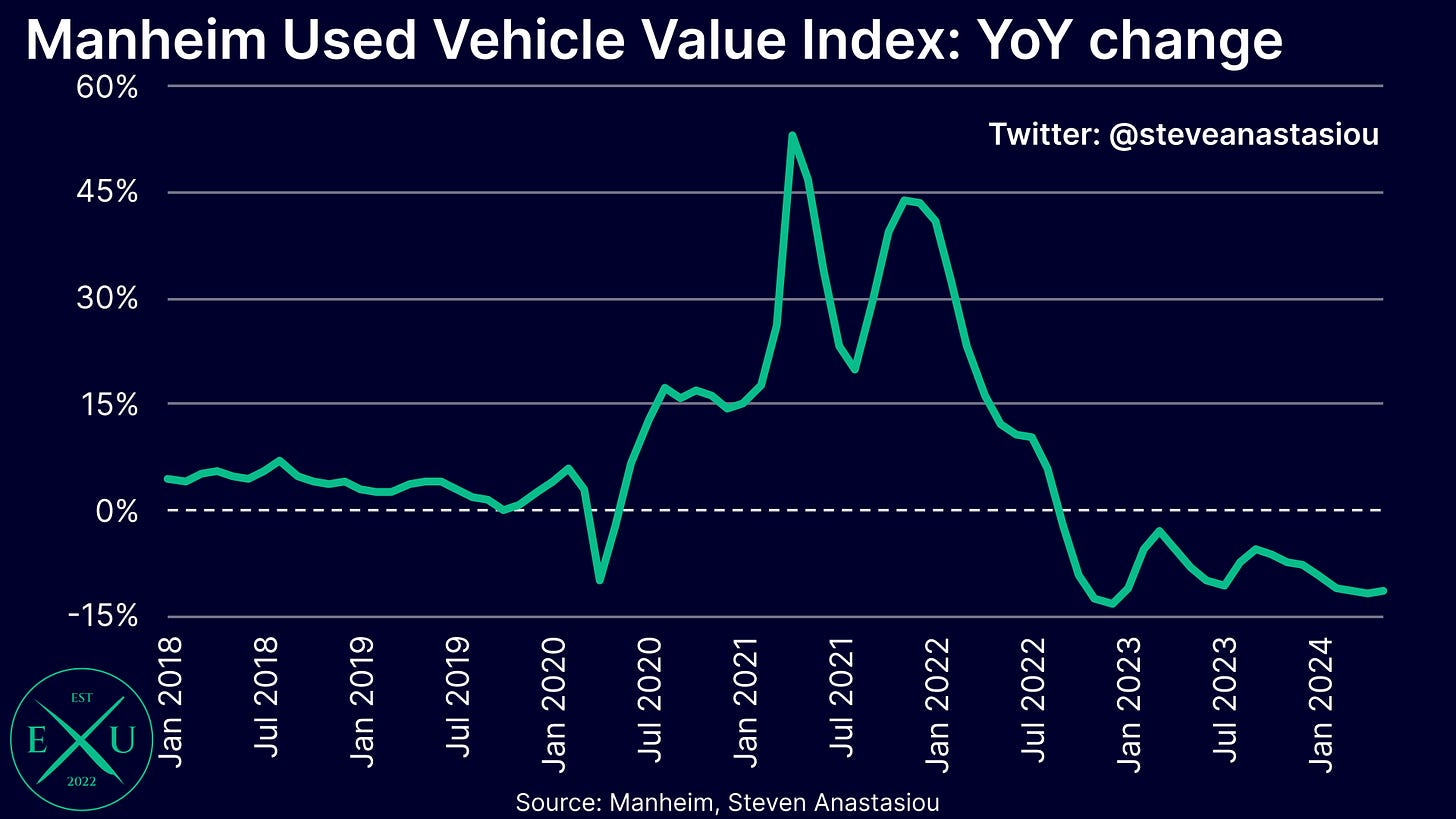
Beginning with used car prices, the Manheim Used Vehicle Index (Manheim Index), which measures wholesale used car prices, continues to show a significant weakening, with prices down 11.4% YoY in May.
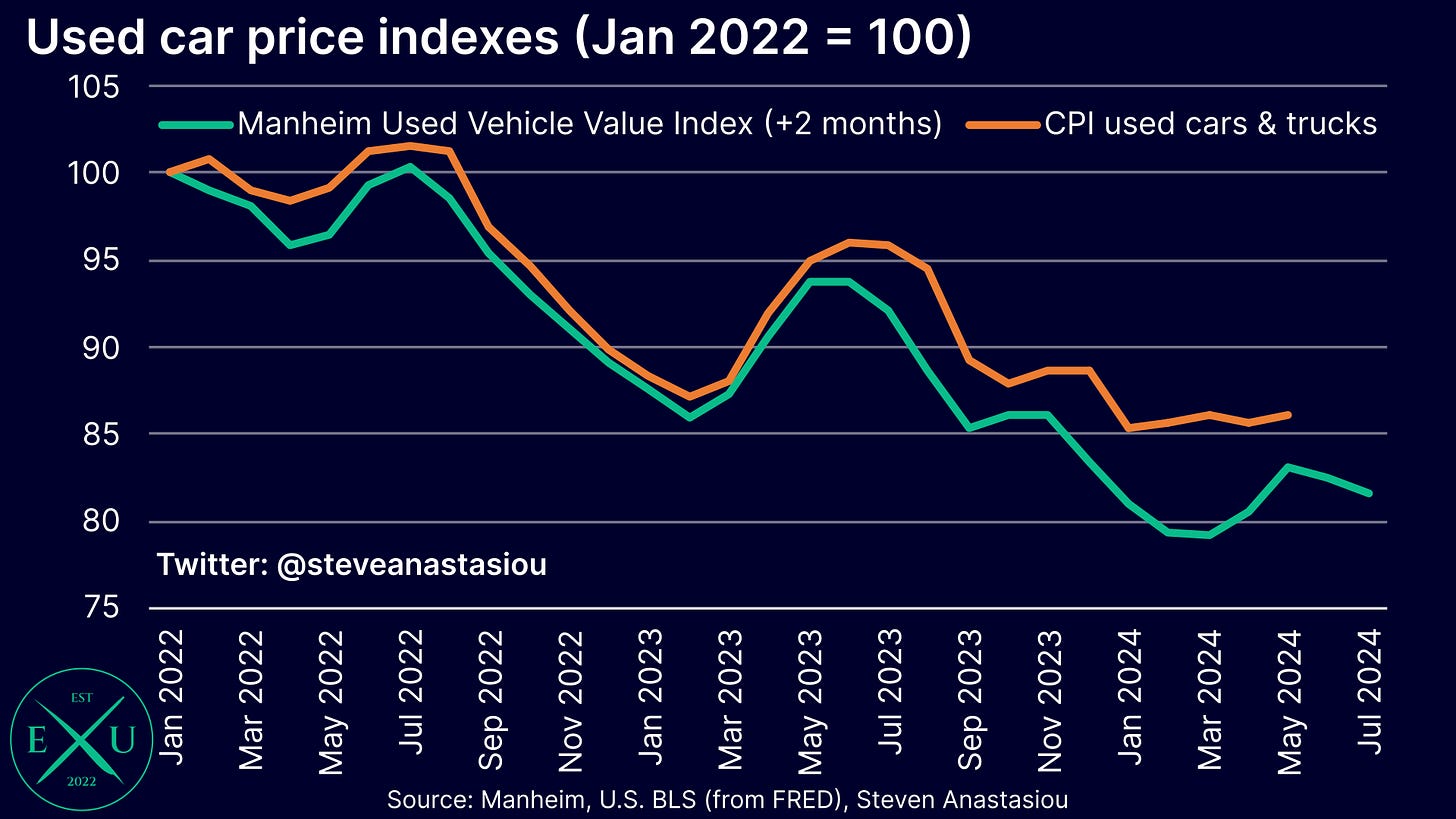
While the CPI used car and truck index (which measures retail prices) tends to closely track the Manheim Index on a two-month lagged basis, a material gap has emerged over the past year, with the CPI used cars & trucks index recording a much smaller decline than the Manheim Index.
Given the persistent weakness in wholesale used car prices and vehicle prices more broadly (which is discussed further below) I expect this gap to converge over time, and for it to primarily occur via a more material reduction in retail used car prices.
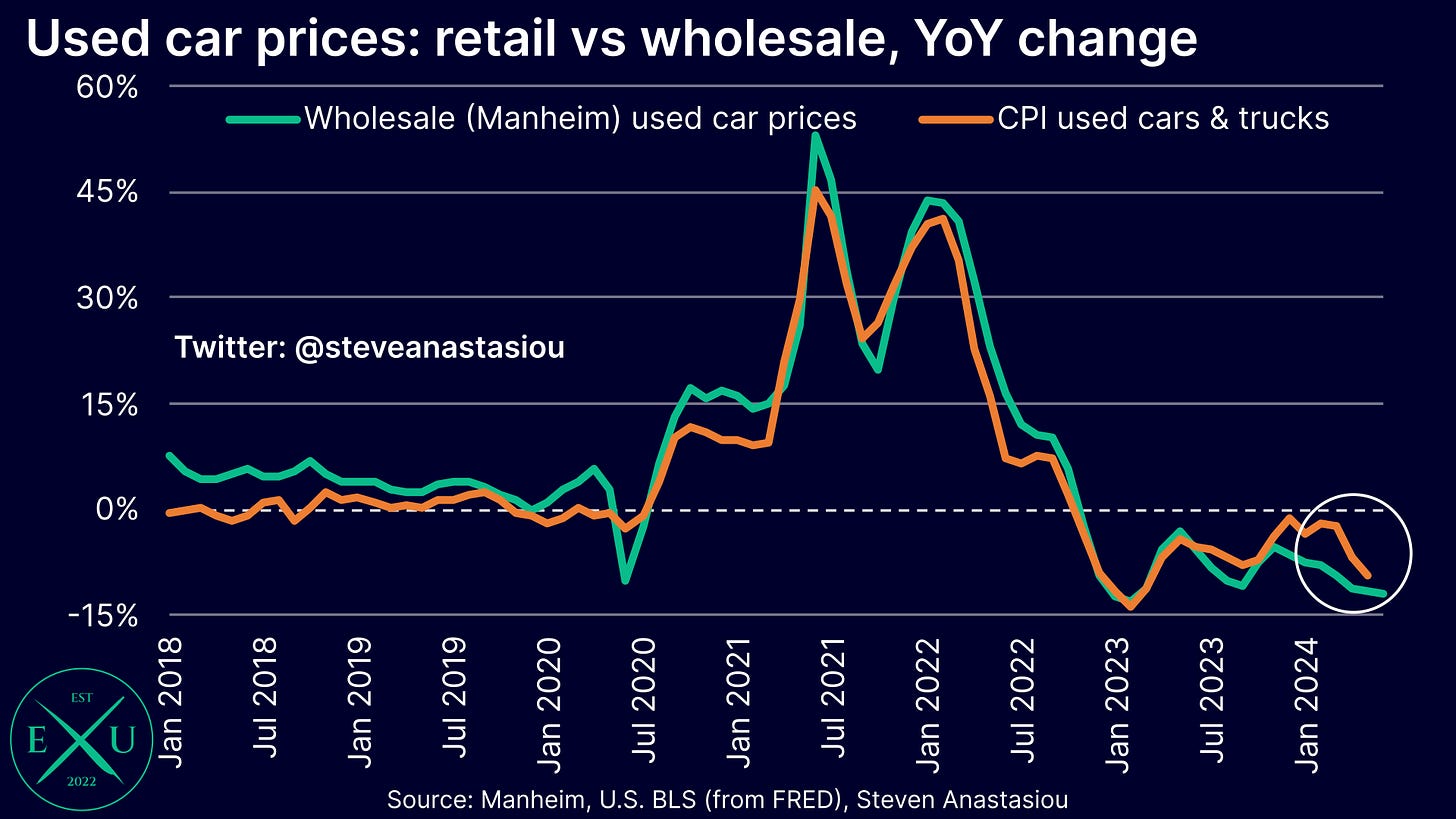
Evidence of such a shift playing out has already been seen over the past three months, with MoM growth in the CPI used cars and trucks index coming in below the change implied by the Manheim Used Vehicle Value Index after considering the seasonality present within CPI used car and truck prices.
This has seen the YoY growth rate of the CPI used cars and trucks index plunge from -2.2% in March to -9.3% in May. Significant YoY price declines are expected to continue in 2H24, as in order for the CPI used cars and trucks index to converge to the Manheim Index, a period of growth below that of the Manheim Index will be needed.
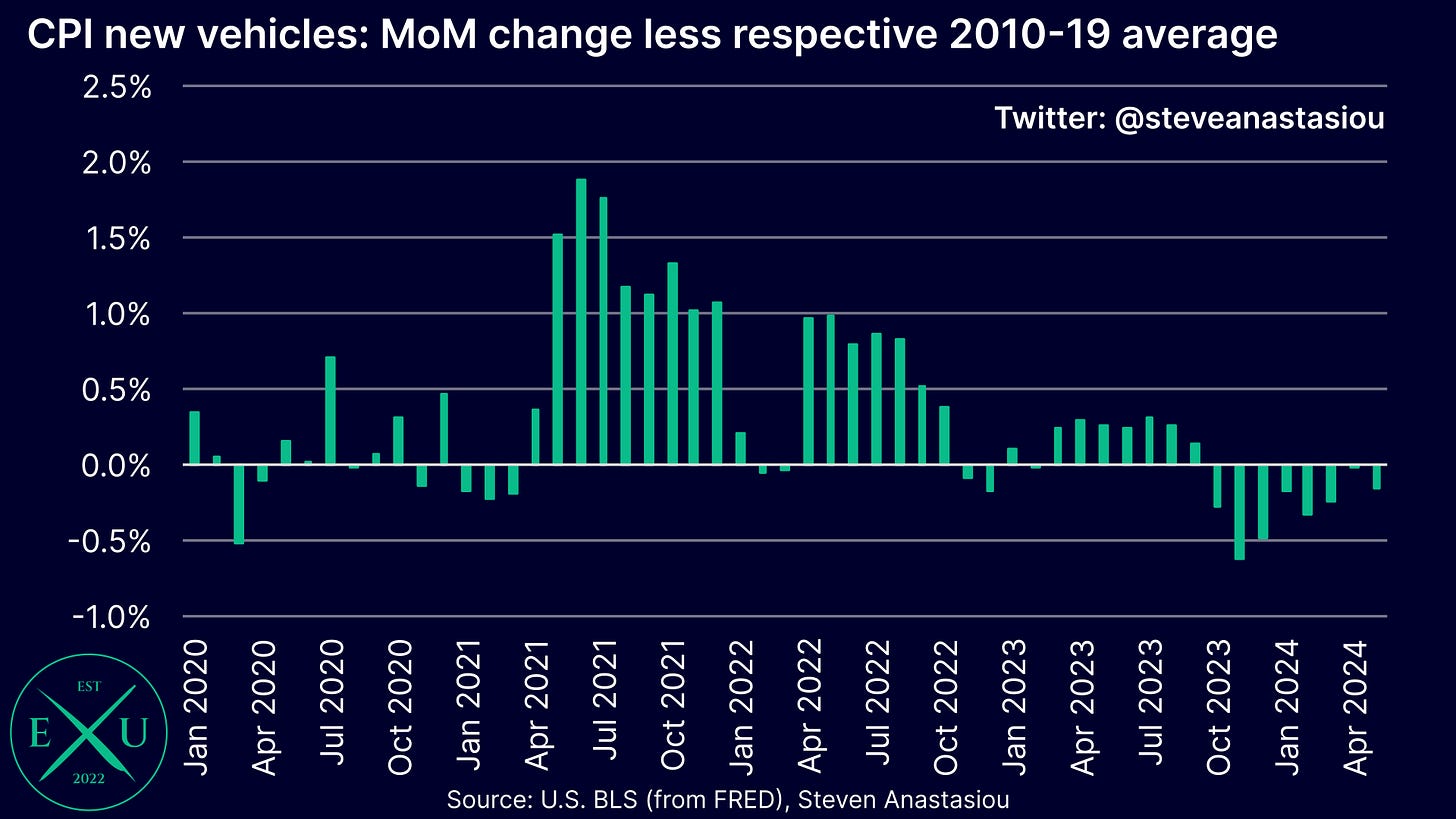
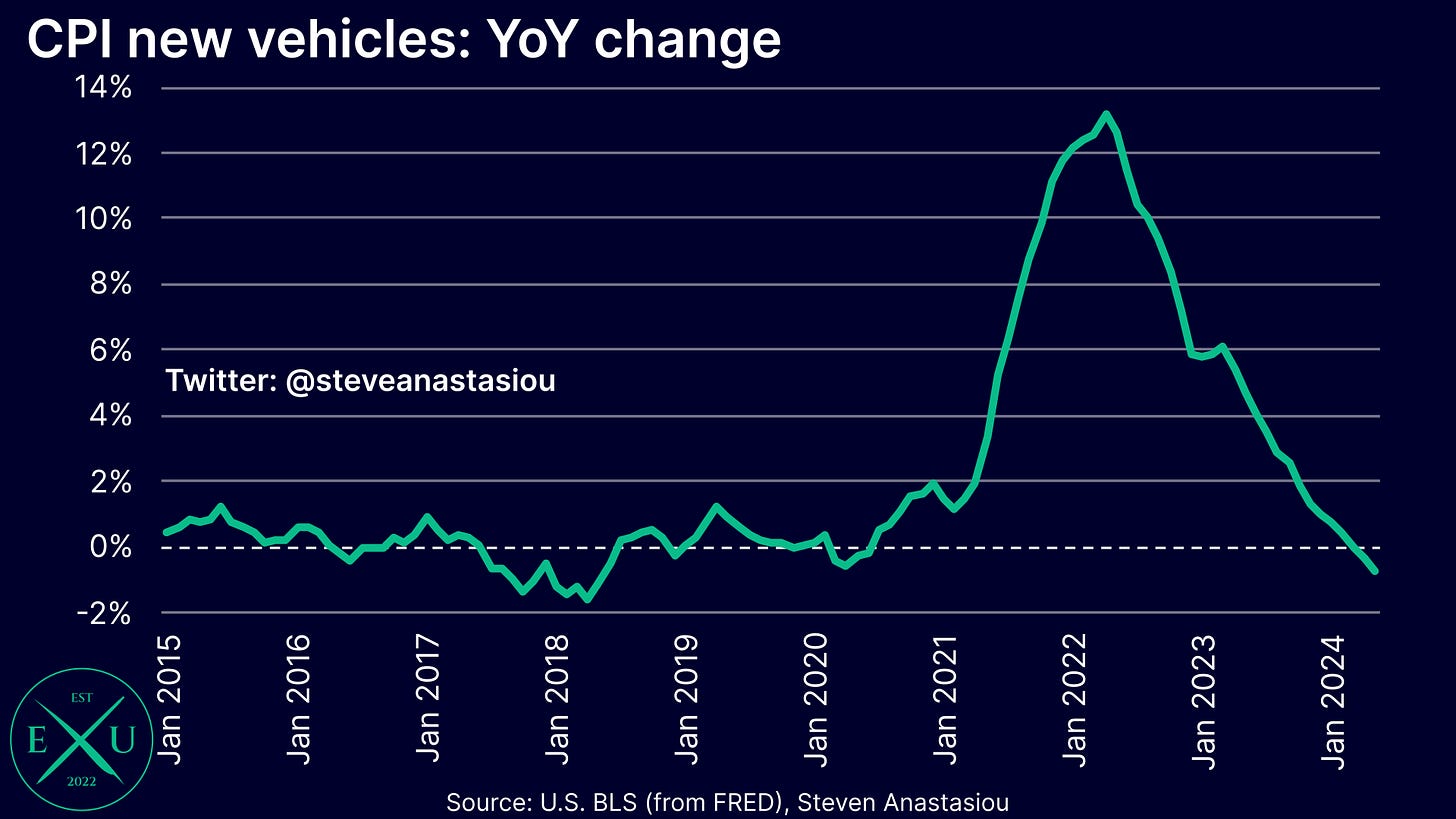
Weakness in car prices has not been isolated to used cars, with CPI new vehicle prices recording outright MoM declines in seven of the past twelve months and MoM growth below its respective historical average for seven consecutive months.
This has resulted in the YoY growth rate turning negative, with growth of -0.76% recorded in May, the largest decline seen since May 2018.
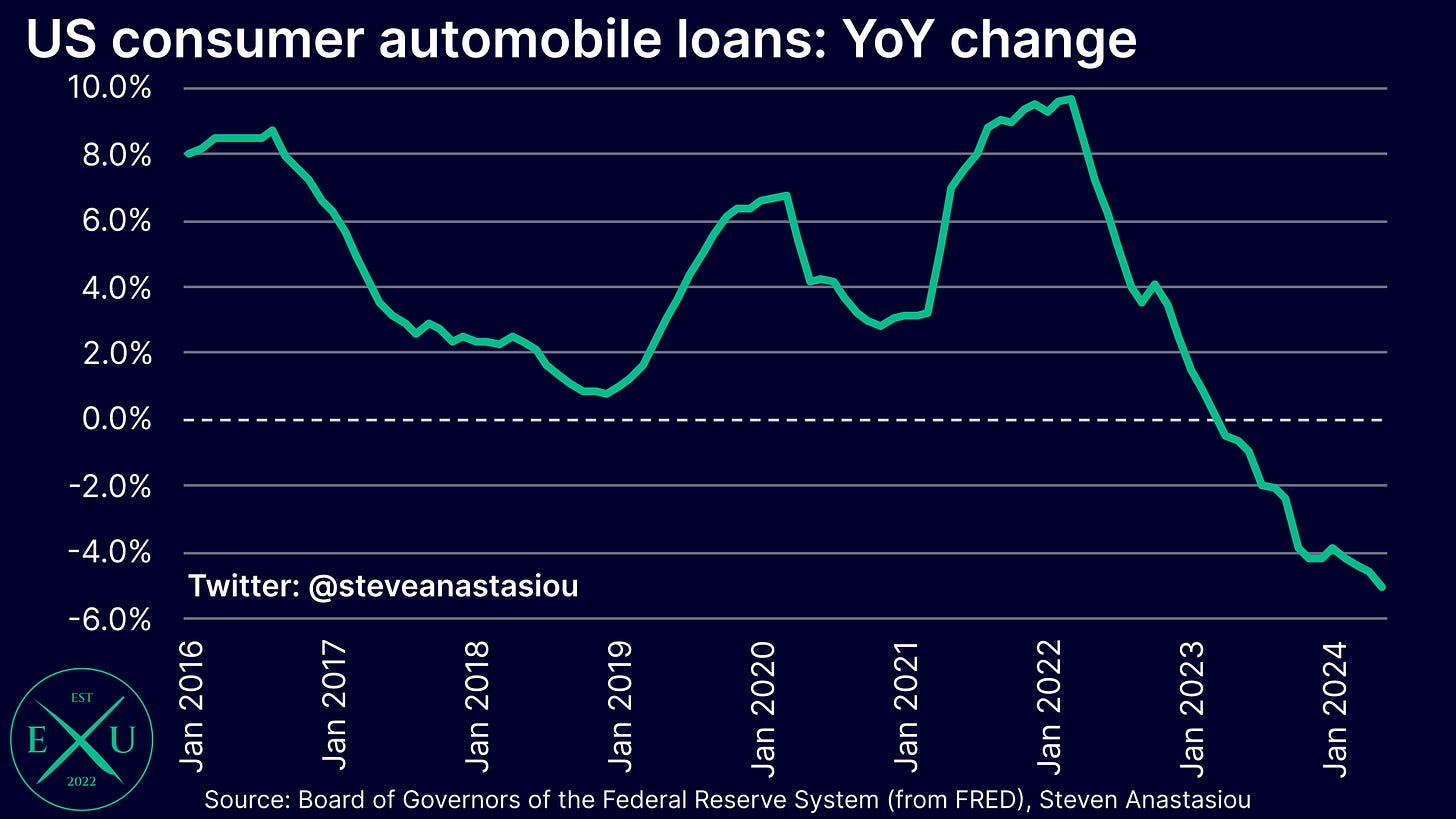
The broad weakness that is being seen in new and used vehicle prices is likely being driven to a significant extent by the Fed’s large increases in interest rates, with total outstanding automobile loans falling significantly, with YoY growth down from a peak of 9.6% in March 2022 to -5.0% in May.
Wage growth has moderated significantly with leading indicators pointing to a further slowdown ahead
Moving onto wages, leading indicators point to a further material reduction in wage growth over the months and quarters to come, which would be expected to gradually flow into slower services price growth.
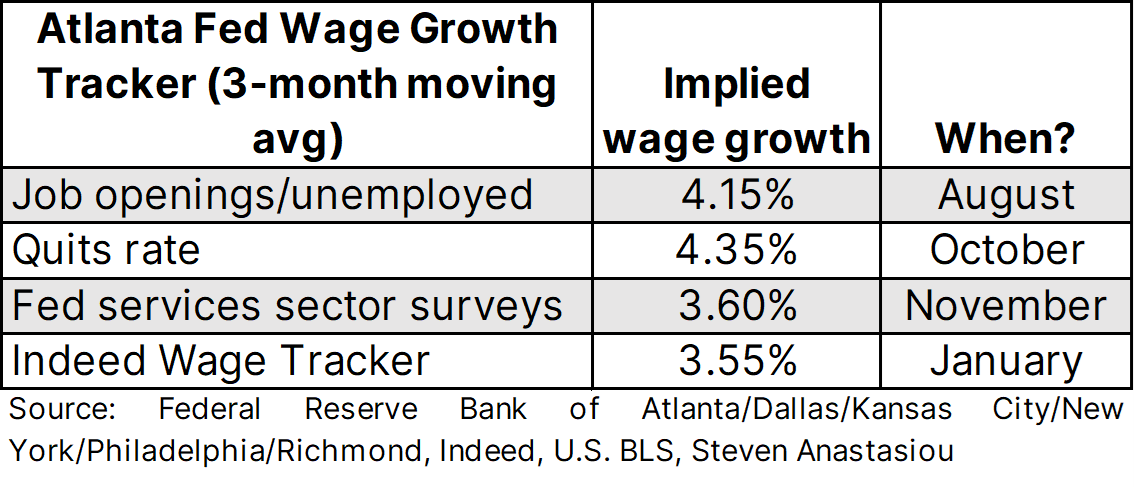
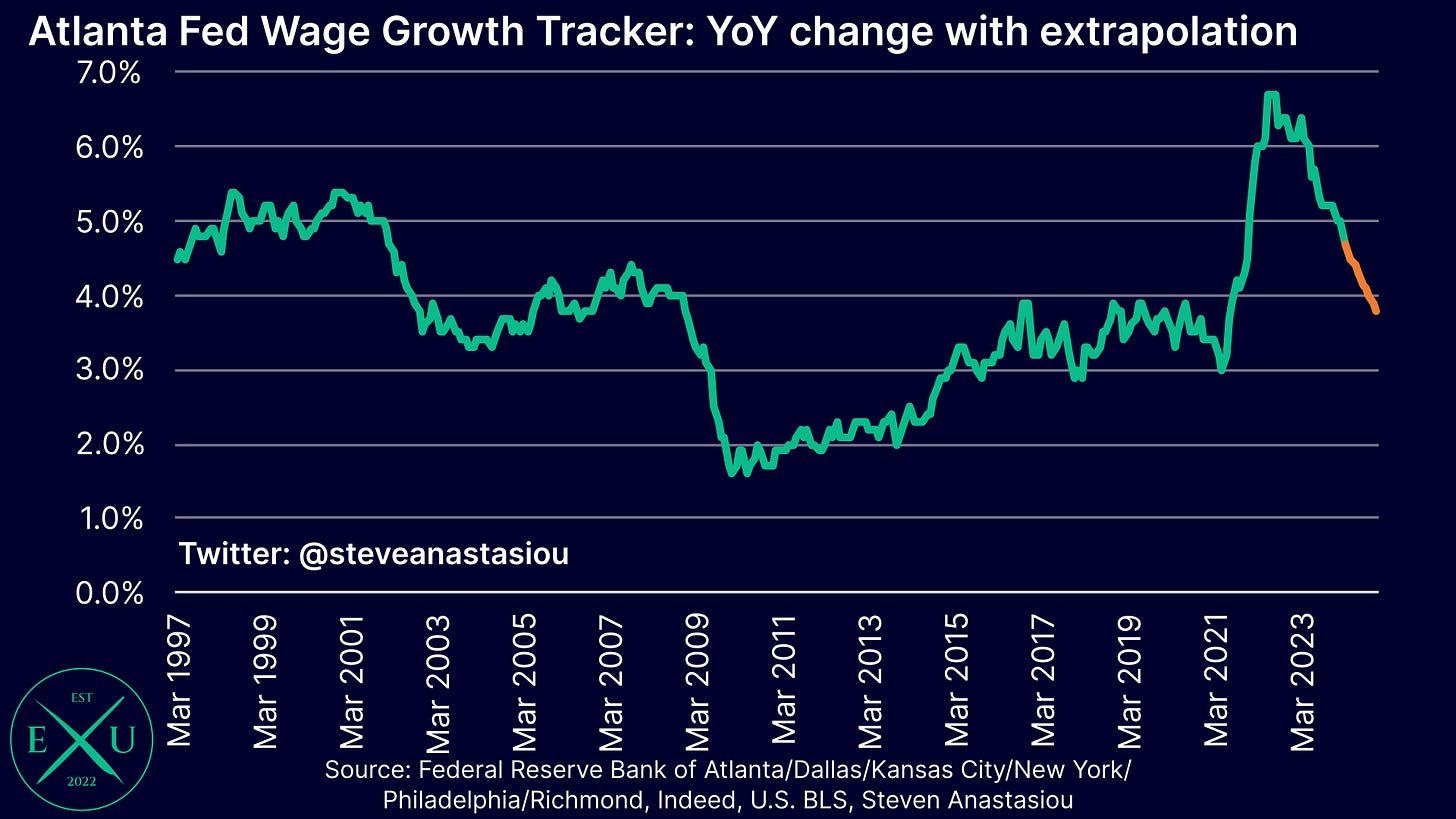
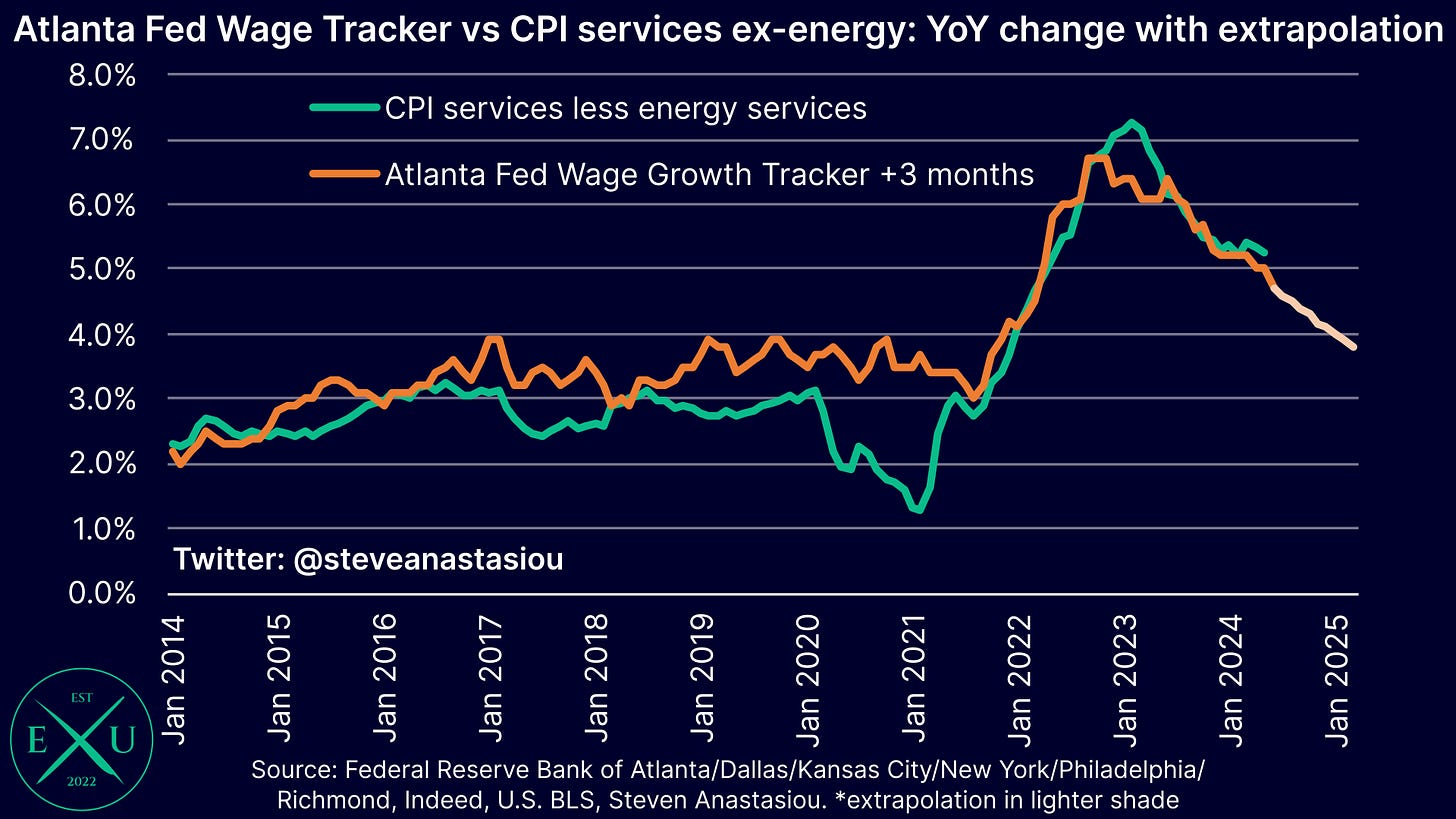
In terms of what the leading indicators currently suggest, the ratio of job openings to unemployed individuals points to the Atlanta Fed Wage Tracker falling from its current growth rate of 4.7% YoY to 4.15% by August. Meanwhile the average of the quits rate, Fed services sector surveys and the Indeed Wage Tracker suggest that growth may fall to ~3.8% by ~the end of the year, which would only be marginally above its 2019 average of 3.7%.
In terms of how this extrapolation looks on a chart, the below is a rough approximation using YoY growth of 4.15% in August and 3.8% in December as reference points. Looking at this extrapolation visually, suggests that the outlook implied by these four different leading indicators is a completely plausible one.
Given this wage growth extrapolation, the historical link between the Atlanta Fed Wage Growth Tracker and core services prices points to a major moderation in core CPI services price growth over the months and quarters to come.
Spot market rental data points to a major moderation in the CPI’s rent based measures during 2H24
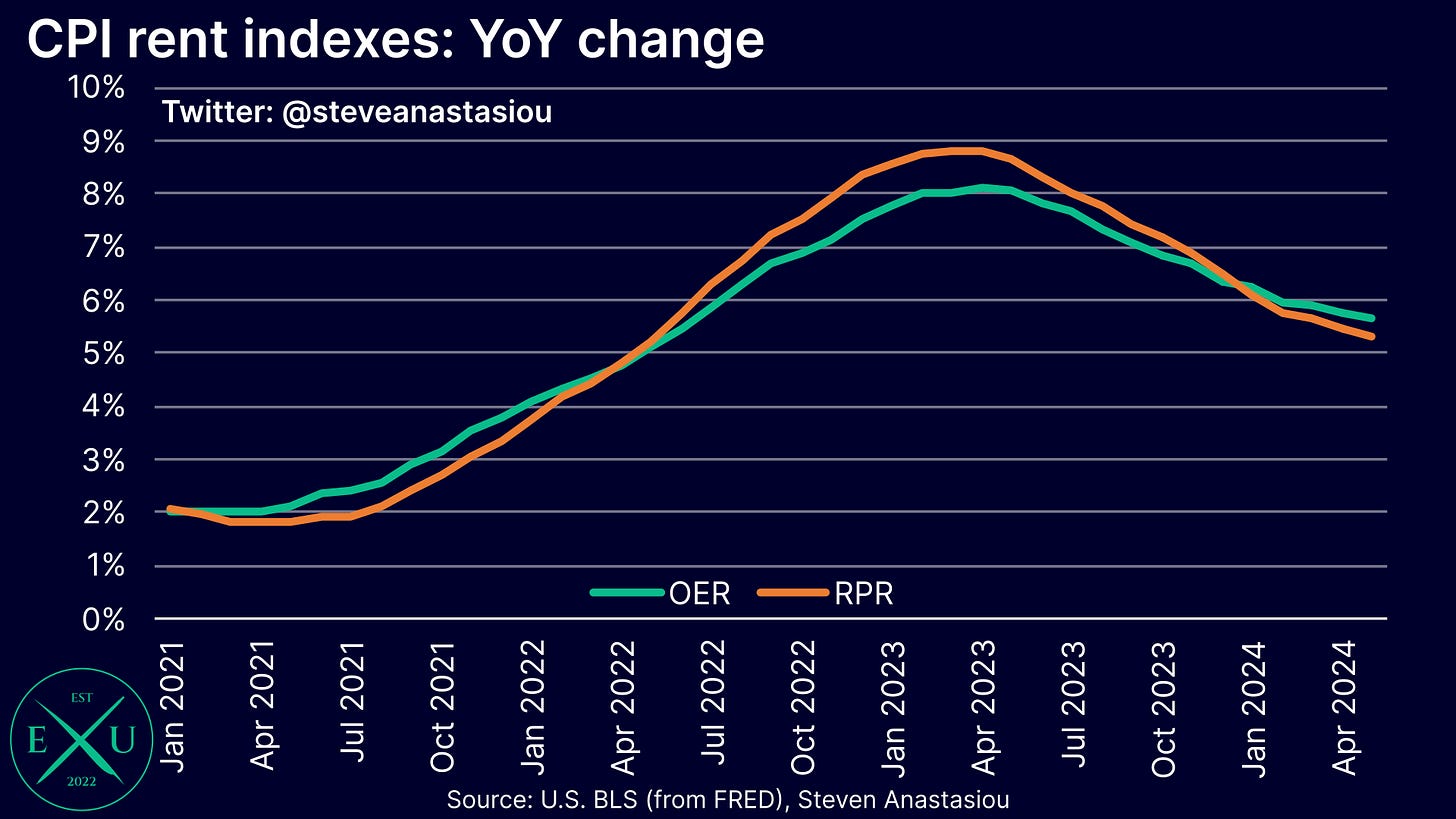
Likely to help underpin such a moderation in core services price growth, is the outlook for owners’ equivalent rent (OER) and rent of primary residence (RPR), which were responsible for 34.2% and 43.0% of the headline and core CPI respectively, in May.
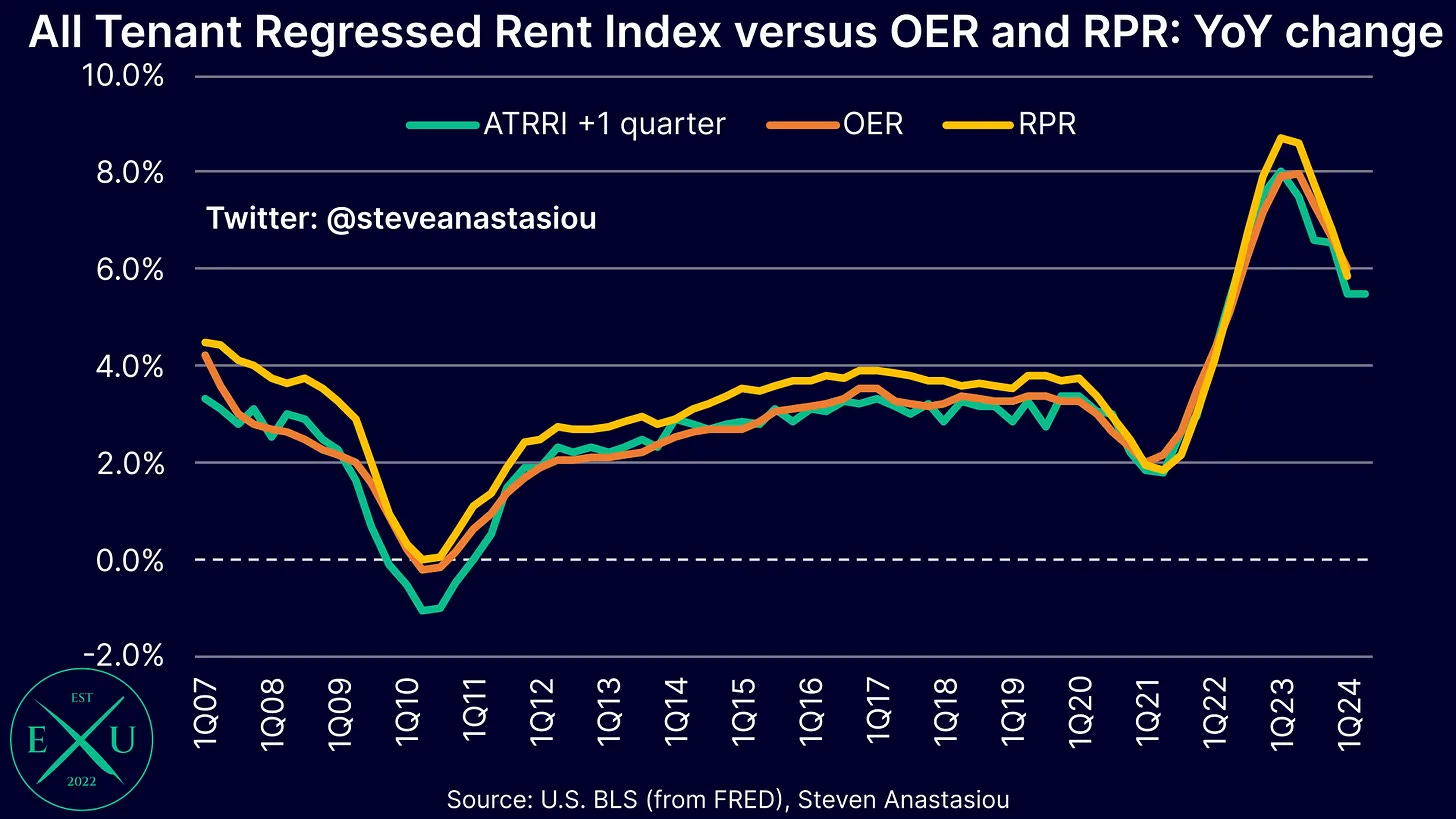
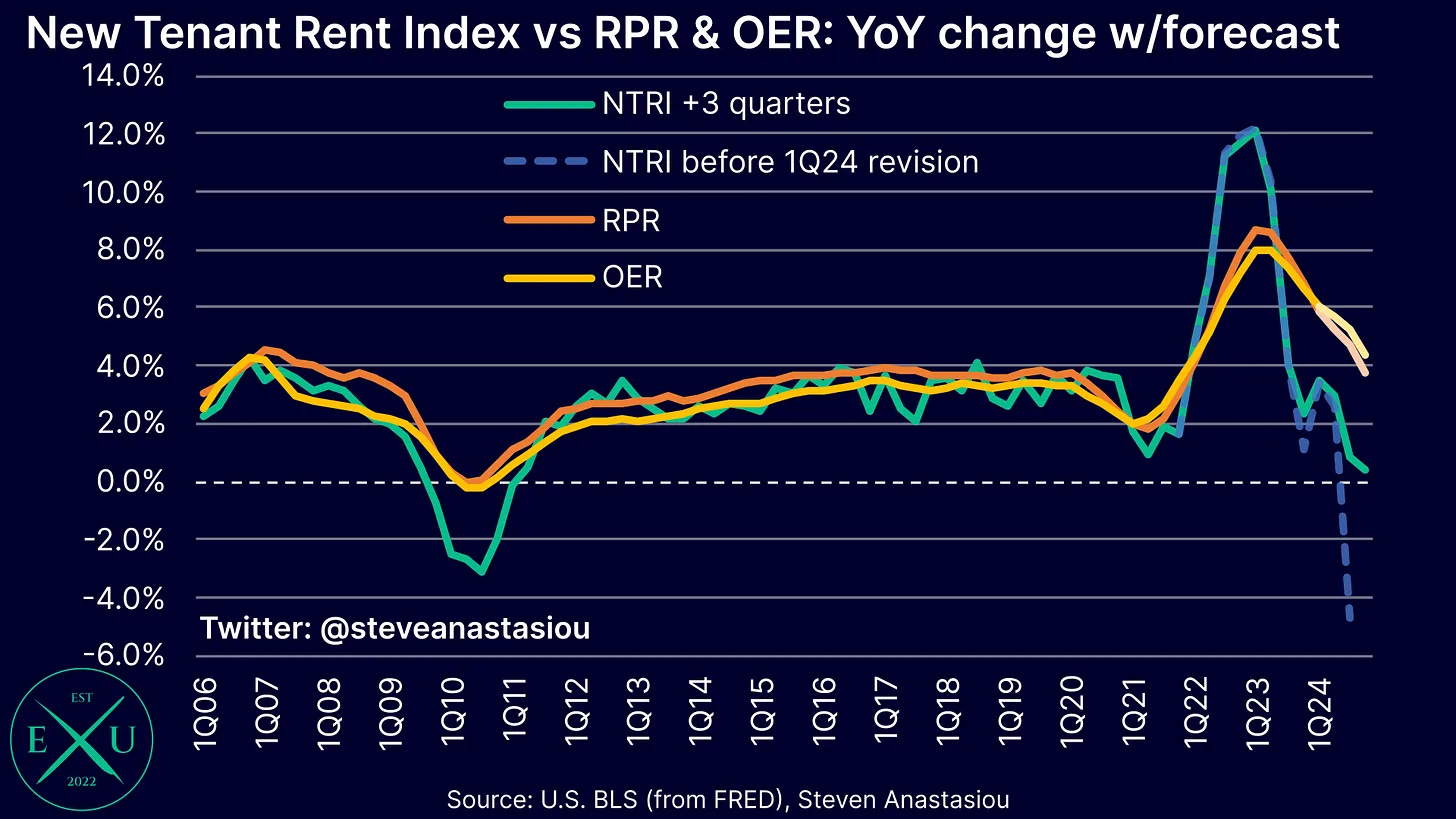
As explained in greater detail within “Alternative BLS rental data points to major disinflation in CPI rents”, both the New Tenant Rent Index (NTRI) and the All Tenant Regressed Rent Index (ATRRI) are leading indicators of OER and RPR.
The ATRRI generally leads OER and RPR by ~1 quarter and points to a potential modest reduction in the YoY growth rate of OER and RPR in 2Q24.
The NTRI, which is a type of spot market rent measure, leads OER and RPR by ~3 quarters, and points to a major reduction in the YoY growth rate of OER and RPR over the quarters to come. While a major moderation is incorporated into my latest medium-term US CPI forecast, a material gap to the NTRI is forecast to remain in 2H24. Such gaps are typical during major shifts in the NTRI — see the 2009-10 period for reference.
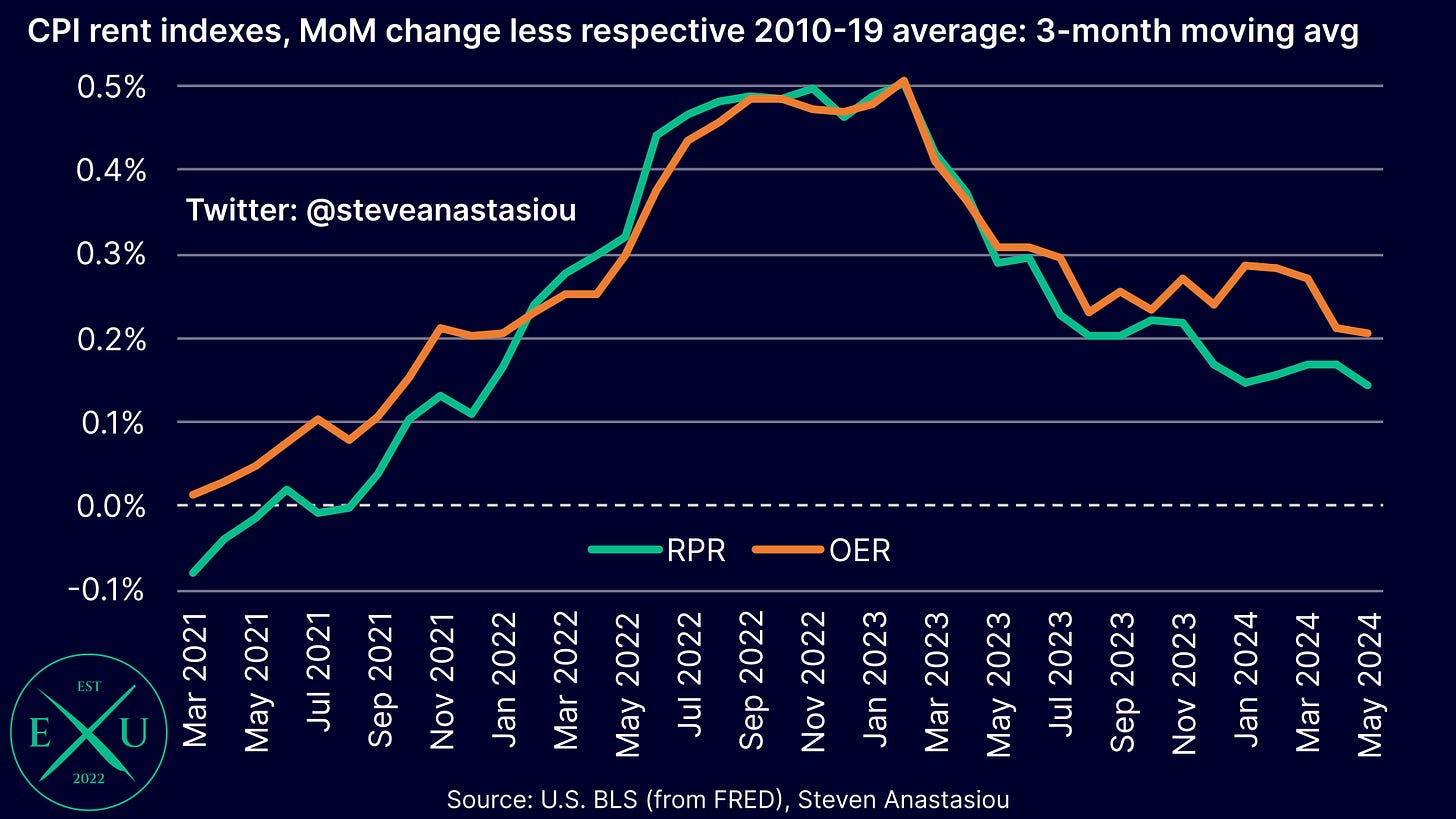
The latest monthly CPI data continues to show that both OER and RPR are indeed recording a gradual moderation in the relative rate of price growth.
On a 3-month moving average basis, relative MoM growth in OER is currently 0.21% above its 2010-19 average, the lowest rate of increase since January 2022. For RPR, the current 3-month moving average relative MoM growth rate is 0.14%, the lowest level seen since December 2021.
This moderation has resulted in the YoY growth rate of OER and RPR falling to 5.7% and 5.3%, respectively.
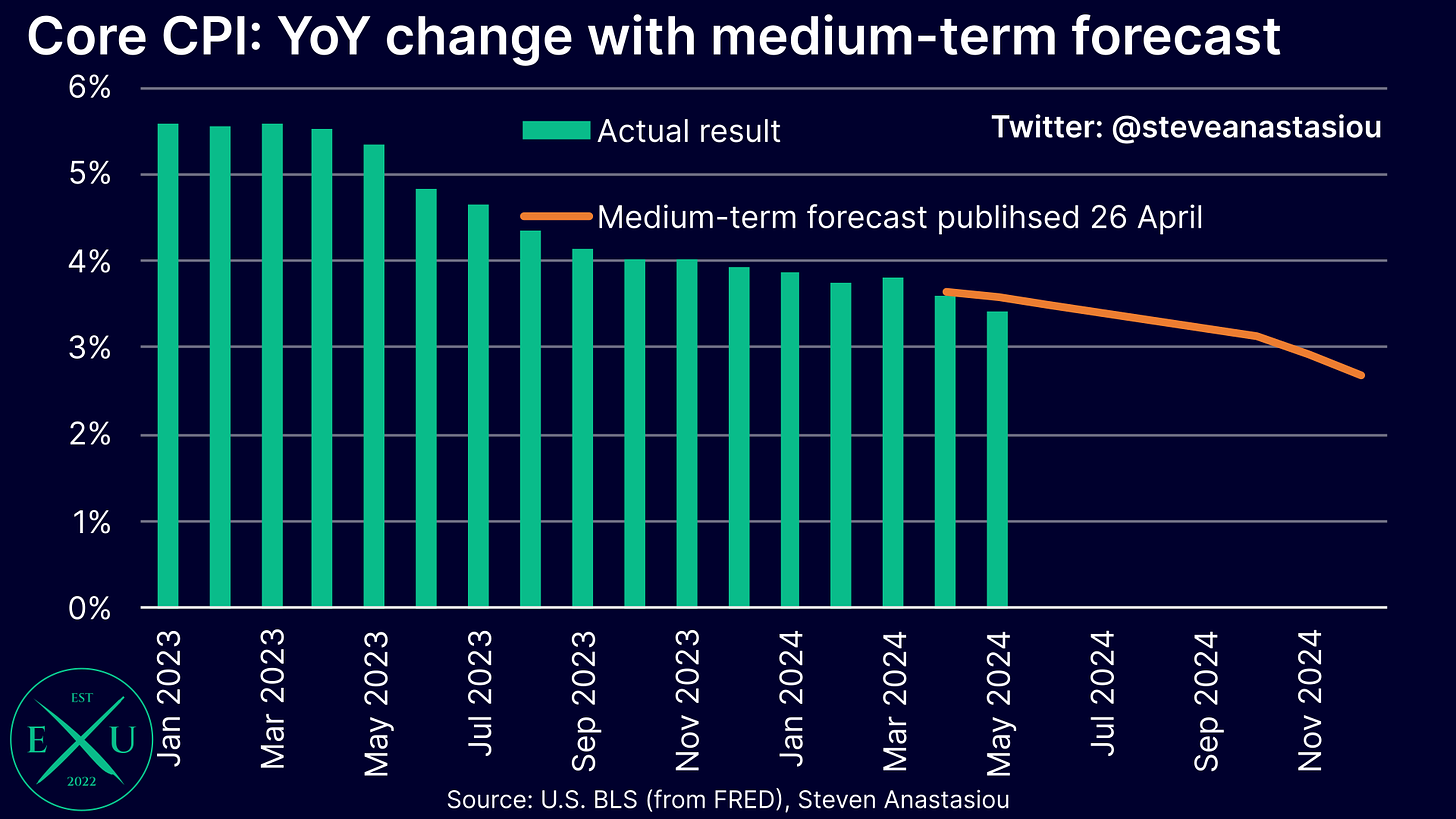
CPI growth is now tracking below my latest medium-term US CPI forecast
The major moderation in supercore services price growth in May has meant that core CPI growth is now tracking notably below my latest medium-term forecast — my latest medium-term forecast had expected core CPI growth of 3.6% YoY in May, versus its actual level of 3.4%.
I currently intend to update my medium-term US CPI forecast following the release of US CPI data for June.
The PCE Price Index tends to grow at a materially slower pace than the CPI
While many may look at my core CPI forecast for YoY growth of 2.9% in 4Q24 and conclude that this is at odds with multiple interest rate cuts in 2H24, this is not the case once two key points are taken into account.
The first point, is to remember that core CPI growth is now tracking 0.2 percentage points below my latest medium-term estimate.
The second point, is that the CPI tends to record materially higher growth than the PCE Price Index (PCEPI).
Since 2000, the core CPI has averaged YoY growth that is 0.33% above the core PCEPI.
The present gap is even larger, with the core CPI 86 basis points above the core PCEPI in April. While an expected moderation in rent based measures and motor vehicle insurance price growth is likely to reduce the extent of the gap between the CPI and PCEPI as the year progresses, a large gap is likely to nevertheless remain.
The current and historical gap suggests that core CPI growth of 2.9% YoY in 4Q24 should translate into core PCEPI growth of 2.6% or less across the same time period.
When the current divergence of 0.2 percentage points between my latest medium-term US CPI forecast and the latest monthly US CPI report is also taken into account, then this points to the potential for core PCEPI growth to come in at 2.4% or less in 4Q24.
As discussed within the “Fed policy outlook” section below, such a rate of growth would firmly point to multiple 2H24 interest rate cuts.
Overarching US Economic Summary & Outlook — continued expansion or a recession?
Last updated: 20 June 2024
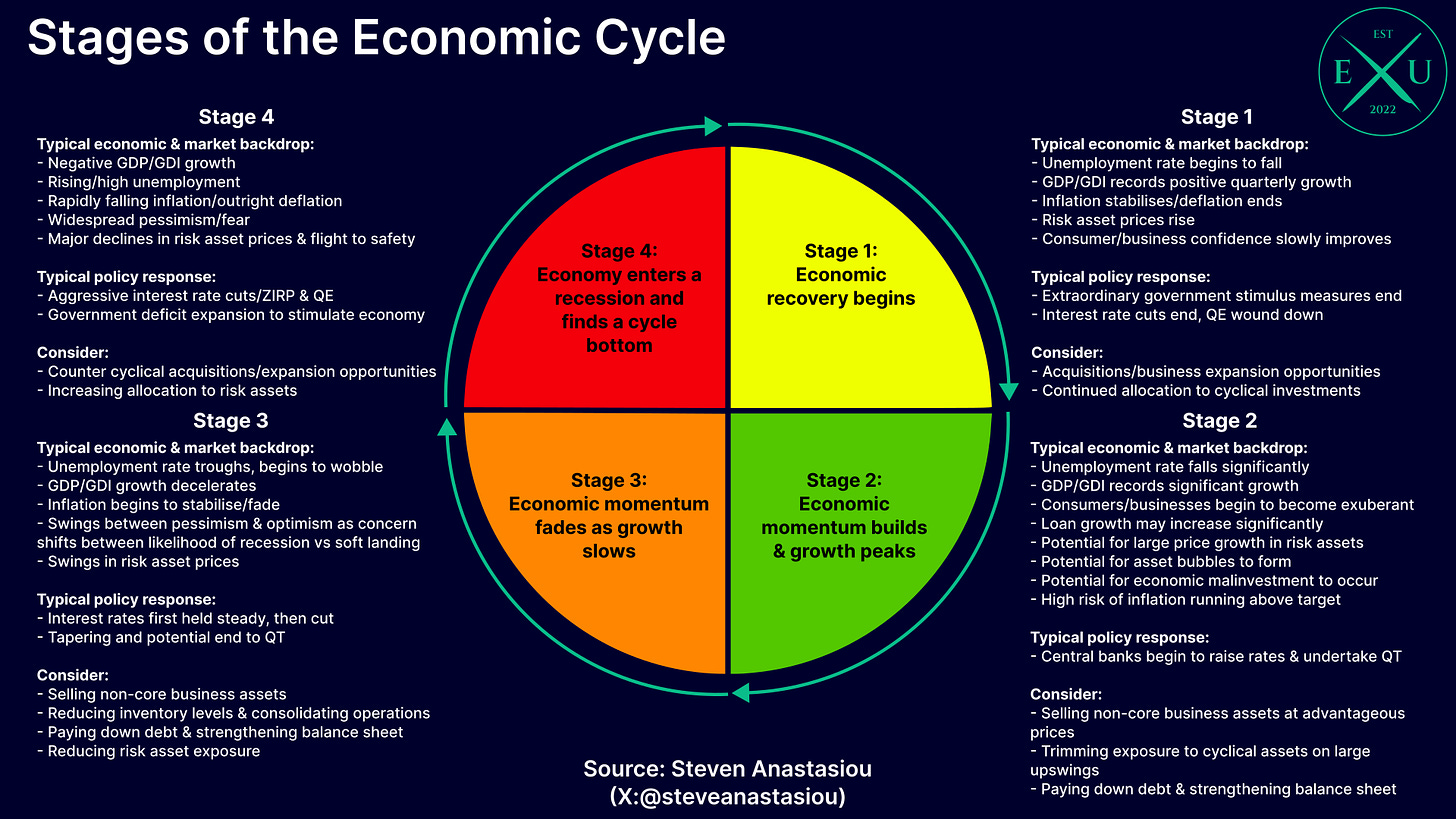
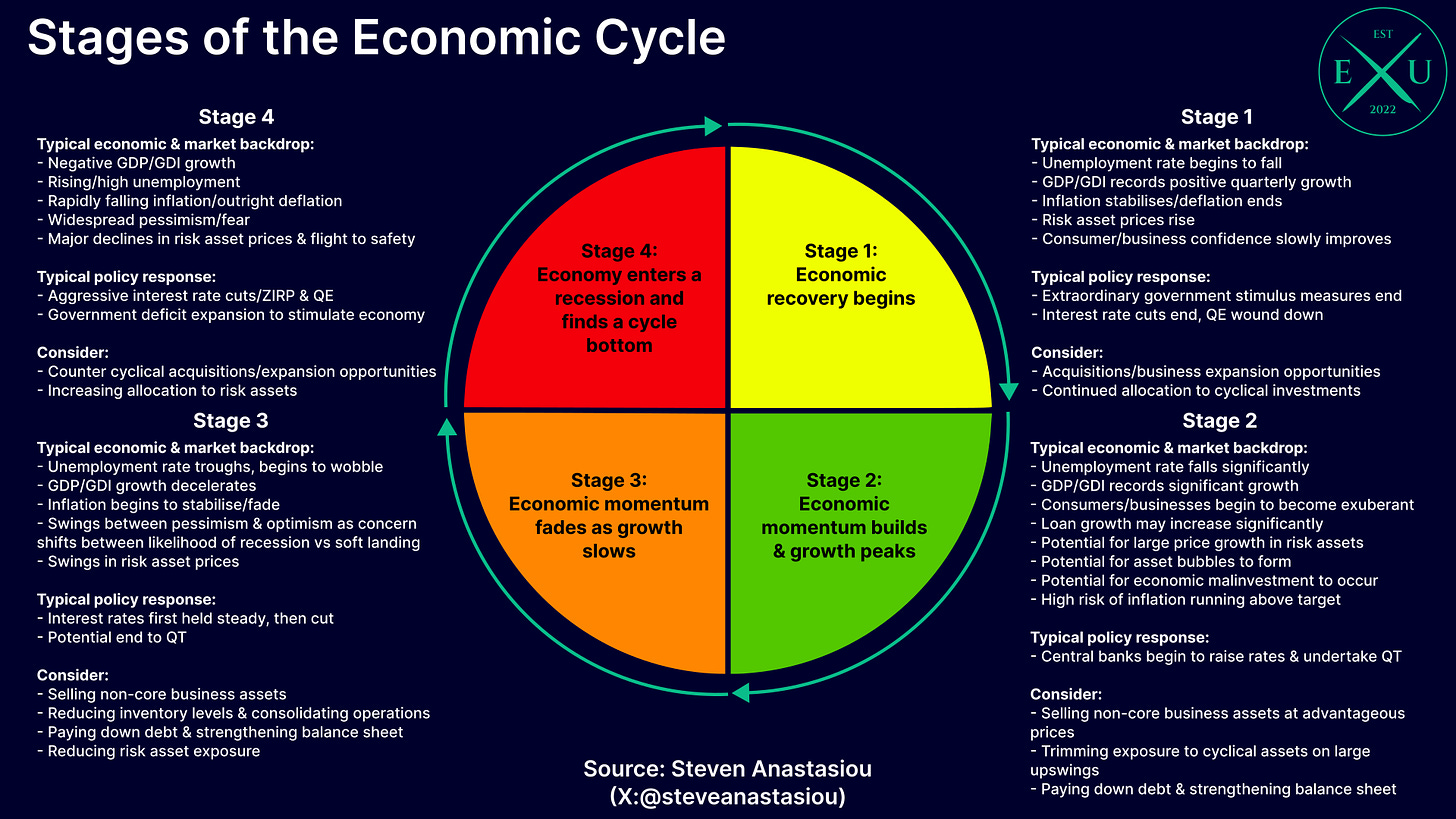
Stage 3: Economic momentum fades as growth slows
Taking everything into account, I currently believe that the US is within Stage 3 of the Economic Cycle that I have created and detailed within the chart below.
The unemployment rate has risen from a trough of 3.4% in April 2023 to 4.0%, while the U-6 unemployment rate, which also measures underemployment, has risen from a trough of 6.5% in December 2022 to 7.4%.
Alongside this growing labour market slack, wage growth has slowed significantly, with leading indicators pointing to a further material reduction in wage growth ahead.
While price growth remained significant in 1Q24, inflation has decelerated materially from its cycle peak and significant MoM disinflation was seen in May. Continued price declines in more cyclical categories like vehicles also points to fading economic momentum.
While personal consumption growth has remained relatively solid, it has been propped up by falling savings rates, with real disposable income growth falling to just 1.0% YoY in April. Given moderating wage growth and the unsustainability of PCE growth being driven by continued declines in savings rates, this points to a likely material moderation in both PCE and GDP growth in 2H24.
Given that M2 growth remains relatively constrained by the Fed’s tightening (6-month annualised growth was just 1.3% in April versus its 2010-19 average of 5.8%), this also suggests that there is likely to be continued downward pressure on both inflation and nominal economic growth over the medium-term.
In addition to key economic indicators all pointing to fading economic momentum, the policy backdrop is also consistent with Stage 3 of the Economic Cycle, with the Fed:
shifting to a period of keeping interest rates on hold;
indicating that its next interest rate move will be a cut; and
significantly reducing the pace of QT.
Currently in Stage 3, but for how long?
After establishing that the US economy is likely within Stage 3 of the Economic Cycle, the next question to examine, is whether or not the US economy is likely to remain within Stage 3 for the remainder of this year, or whether it will instead enter Stage 4, being a recession.
In addition to the above mentioned data points, the liquidity outlook and immigration are important factors to consider.
In terms of liquidity, with large federal government deficits on the way, significant net T-bill issuance is set to recommence in 3Q24. Given that ~$375bn remains within the Fed’s RRP facility and that the pace of QT is being pared back from June, this is likely to result in a broadly positive backdrop for bank deposits and bank reserves. While this may result in a stimulatory impulse, given that net T-bill issuance is slated to be well below 1Q23-1Q24 averages in 3Q23, the extent of any stimulatory impulse is likely to be materially below that of the year ago period.
In addition to the extent of any potential stimulatory impulse, it’s also important to consider what hundreds of billions of dollars remaining within the Fed’s RRP facility means — that liquidity remains in abundance. This indicates that the Fed’s tightening has not yet reached a level that is likely to encourage an imminent economic bust.
The economic impact of immigration can perhaps most clearly be seen within the employment market, where nonfarm payroll growth remains strong despite a material increase in the unemployment rate. This dichotomy suggests that nonfarm payroll growth is being driven by higher levels of immigration.
This makes determining the outlook for the US economy more nuanced, as while a continued increase in the unemployment rate is likely to hit consumption and consumer confidence, it may occur alongside continued increases in aggregate employment levels, which will help to push nominal economic activity higher.
Given the current rate of headline nonfarm job growth (6-month moving average: 255k), a reduction in the pace of QT and significant further net T-bill issuance in 2H24, my current base case is for a significant slowdown in the US economy in 2H24, but for it to avoid a recession. Though as opposed to a “no landing” or acceleration of growth, I currently view the key risk for 2H24 as being that the US enters a recession.
Looking a little further ahead, with the Fed’s RRP facility likely to be largely extinguished by the end of the year, QT is likely to result in a much more potent drag on liquidity and the US economy in 2025 (that is, if it continues into 2025). It’s also worth remembering that if inflation slows further (which I expect to occur), real interest rates will rise, acting to further discourage borrowing and further promote an economic deleveraging. A further encouragement of deleveraging is also likely to occur over time as more fixed rate loans expire and face the prospect of refinancing at far higher interest rates. These factors add significant additional risk to the economic outlook for 2025, for which my current base case is for the US economy to enter a recession.
Further emphasising that the key risk for the US economy is that it enters a recession (as opposed to a “no landing”), is that in light of the recent inflationary experience, the Fed may be far less responsive to an economic slowdown than it has been since the GFC. This may act to exacerbate an economic slowdown, increasing the odds of the US entering a recession, as well as its potential severity.
Fed policy outlook
Last updated: 20 June 2024
When considering the Fed policy outlook, it’s important to not only consider the economic outlook that I have articulated above, but the Fed’s own expectations.
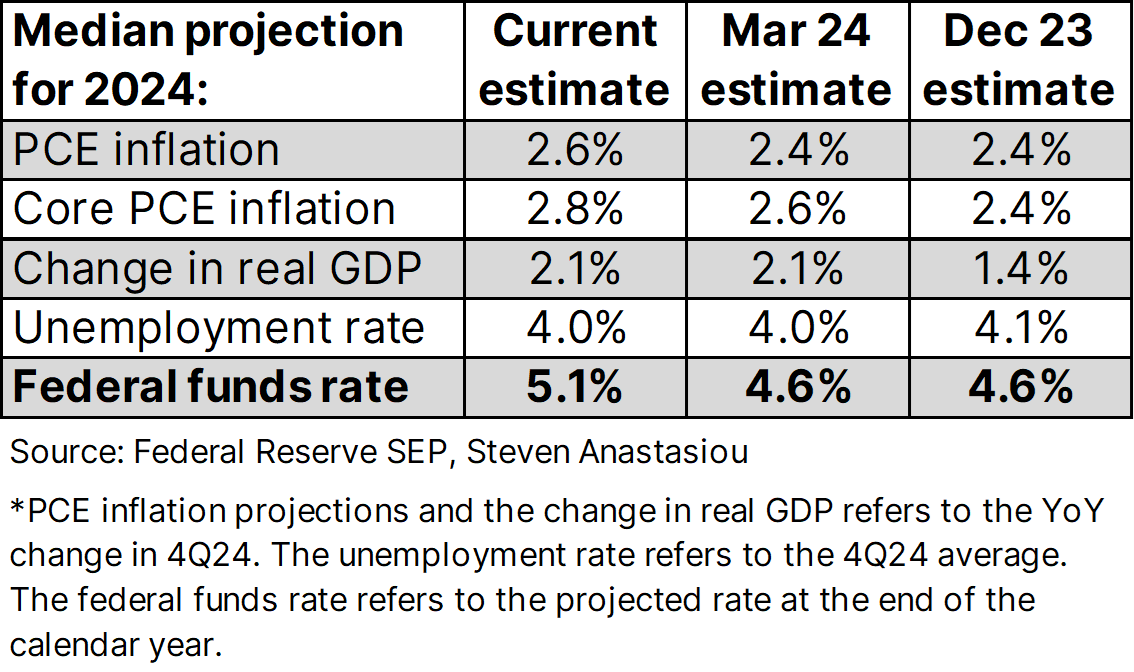
In its latest Summary of Economic Projections (SEP), which was updated at the June FOMC meeting, the Fed’s median inflation projections were increased and expectations for 2024 interest rate cuts were reduced to one, down from its previous median projection of three.
While the Fed’s latest projections are now at odds with my expectation for multiple 2H24 interest rate cuts, I expect that core inflation will come in below the Fed’s median projection and that the unemployment rate will come in above the Fed’s median projection.
As discussed above, not only does the historical gap between the core CPI and core PCEPI suggest that my latest medium-term US CPI forecast is consistent with core PCEPI growth of 2.6% or less in 4Q24, but the latest CPI data is tracking 0.2 percentage points below my latest medium-term estimate, suggesting that core PCEPI growth could fall to 2.4% or below in 4Q24.
As opposed to needing to be revised up, the latest inflation data thus points to the growing need for the Fed’s inflation projections to be revised lower. Reflecting this potential future need, Fed Chair Powell noted within his latest press conference that the Fed’s latest PCEPI estimates were “fairly conservative”.
Given that core PCEPI growth of 2.4% or less would be below the Fed’s median March projection, and given that the unemployment rate has already reached the Fed’s median projection of 4.0%, this backdrop strongly points to multiple 2H24 interest rate cuts, with the Fed having expected three 2024 rate cuts at the time of its March meeting.
The change in mindset that would likely come from core CPI growth more clearly indicating that it will fall below the Fed’s current median projection of 2.8% was made clear by the following comment from Fed Chair Powell at his June FOMC press conference: “if you're at 2.6[%], 2.7[%] … that's a really good place to be”.
Given that I also expect a further material weakening in the employment market during 2H24, which would be expected to see the unemployment rate rise materially above the Fed’s current median projection of 4.0%, then this would only further add to the likelihood of multiple interest rate cuts in 2H24.
In terms of the timing of the first rate cut, given that I had expected monthly core CPI growth to begin decelerating significantly from June, I hadn’t expected the first rate cut to be delivered before September. While I still view September as the most likely meeting in which an initial rate cut will be delivered, should material disinflation be seen again in June alongside a material further weakening in employment data, then this could see an initial rate cut brought forward to July.
Given that reserve levels remain abundant and that I currently expect the US economy to avoid a recession in 2H24, I currently expect the Fed to continue with QT until at least the end of 2024. Though in the event that the US economy does show more clear signs of entering a recession, then I would expect the Fed to relatively quickly pivot towards ending QT altogether.
Market overview & outlook
Last updated: 20 June 2024
Note that the information and analysis provided within this research report is general in nature and is only provided for informational and educational purposes to relate how economic conditions may impact the financial markets. The information presented is not a recommendation and does NOT constitute personal investment advice to any person. This report must be read with the full disclaimer contained at the end of this report.
The impact of the Fed’s decision to taper QT
While many may be perplexed by the strength seen in equities and precious metals markets amidst broadly higher bond yields and reduced interest rate cut expectations from where they began the year, the liquidity backdrop and its outlook, has likely been the much more important driver for many asset markets.
The most important factor that has recently impacted the liquidity outlook has been the Fed’s decision to significantly scale back QT with reserves still in abundance. This sent markets a clear signal, being that monetary policy is likely to remain highly accommodative for asset prices (see: “Why the Fed's reduction in the pace of QT is critical for markets” and “Fed turns increasingly dovish, adding further fuel to financial markets” for prior research pieces on this topic).
Since writing in March that the Fed’s decision to foreshadow a near-term tapering of QT would provide “significant further fuel for asset prices”, the gold price has risen 8.0%, silver has risen 19.5%, the S&P 500 has risen 6.0% and the Nasdaq has risen 10.5%. Since the Fed formally announced a significant reduction in the pace of QT in May, the S&P 500 has risen 9.0%, the Nasdaq by 14.1%, gold by 2.0% and silver by 13.3% — stated equity returns to 18 June and gold and silver returns to 19 June. Gold and silver price changes are compiled from spot data provided by Investing.com.
In addition to reserves remaining abundant, the reduction in the pace of QT comes on the back of reserves growing over the past year, as the drawdown in the Fed’s RRP facility amidst significant net T-bill issuance has more than offset the impact of the Fed’s QT.
By significantly tapering QT with reserves in abundance and hundreds of billions of dollars remaining within the RRP facility, this increases the likelihood that bank reserves will increase further in 2H24.
Significantly tapering QT whilst reserves remain in abundance, also suggests that the Fed is significantly concerned about bank reserves falling materially. This suggests that once the RRP facility is fully drained, that the Fed may not continue with QT for an extended period, and may relatively quickly revert back to an expansionary stance in the event of a major economic weakening.
All-in-all, this highlights an accommodative liquidity backdrop for equities and precious metals. Once this is understood, the rally that has been seen in both of these asset markets following the Fed’s recent QT related announcements, should not be surprising.
Stages of the Economic Cycle — investment implications
In addition to the backdrop for liquidity, it’s important to also analyse the investment implications that stem from where the US economy is within the broader business cycle, as this will impact the outlook for interest rates, corporate earnings and liquidity, whilst providing a useful guide for investors and business owners alike.
Recall that I earlier detailed why I believe that the US economy is in Stage 3 of the Economic Cycle and why it’s likely to remain there during 2H24 — albeit with the key risk being that it may slip into Stage 4 (being a recession).
Providing the relevant chart again below for easy reference, note that I include potential investment/business related implications to consider under a countercyclical (or leading) investment approach. I consider a countercyclical approach to be the most intuitive, as if timed fairly well, it should lead to selling assets for premium valuations near the top of the economic cycle and purchasing assets for discounted valuations near the bottom of the economic cycle.
It should also allow business owners/management teams to avoid overexpanding near a cyclical peak (which would compromise profitability and solvency during the economic bust) and to instead prudently move to a more conservative balance sheet structure ahead of potential economic weakness. Not only should this place businesses in a better position to weather an economic storm, but it will better allow business owners/management teams to take advantage of favourable expansion opportunities during Stage 4 and Stage 1 of the economic cycle.
Given that the US economy is likely in Stage 3 of the Economic Cycle and gradually transitioning towards Stage 4, now would be an appropriate time to consider (remember, this information is general in nature, does not consider personal circumstances, does not represent personal advice and is provided only for informational and educational purposes):
Selling non-core business assets;
Reducing inventory levels & consolidating operations;
Strengthening balance sheets; and
Reducing cyclical risk asset exposures whilst prices remain broadly favourable.
Equity market review
Prices
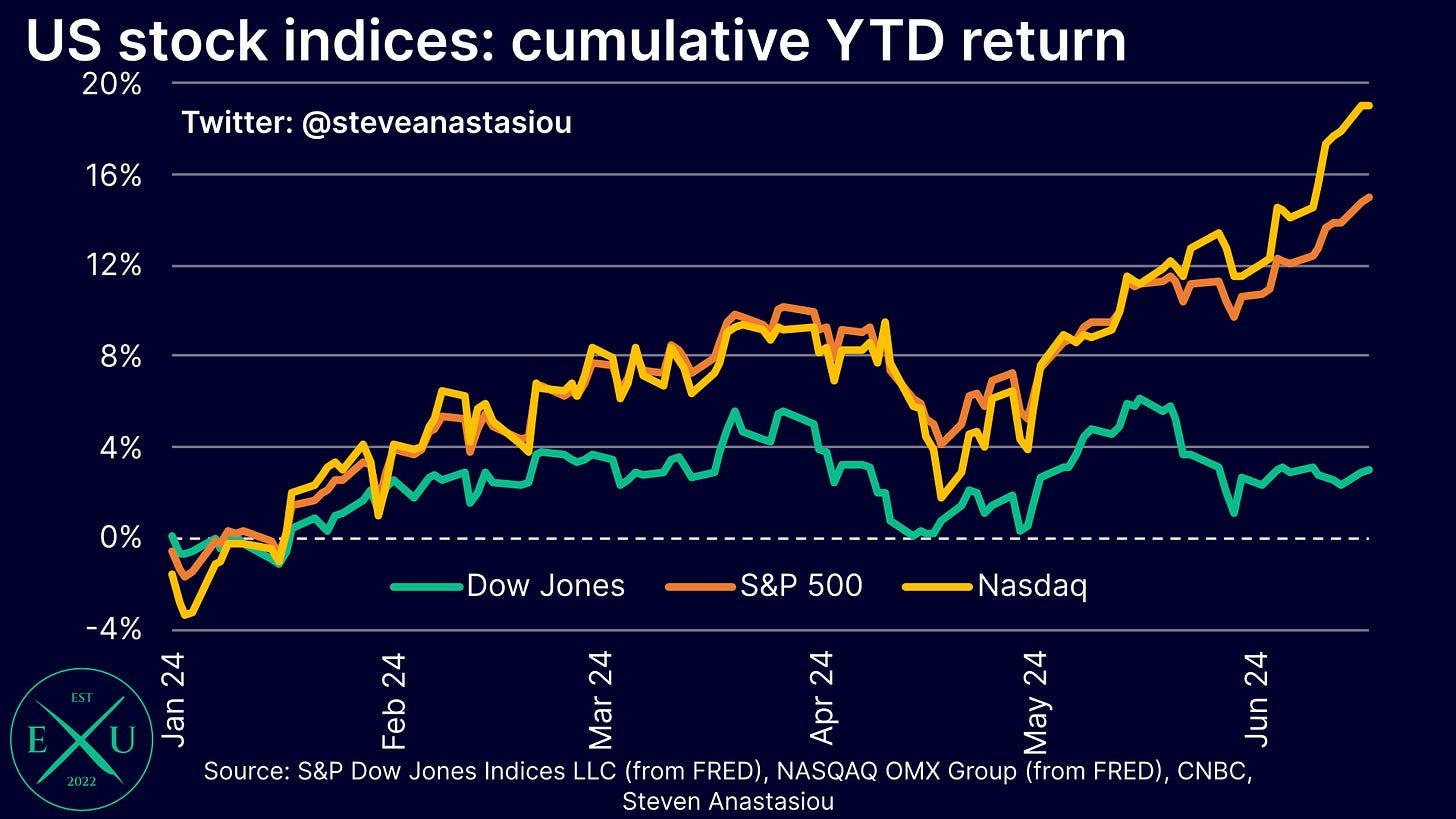
With the half-way point of the year not far away, US stock market indices have so far recorded significant growth.
As of 18 June, the Dow Jones Industrial Average (Dow) is up 3.0% YTD, the S&P 500 is up 15.0% YTD and the Nasdaq is up 19.0% YTD.
Earnings
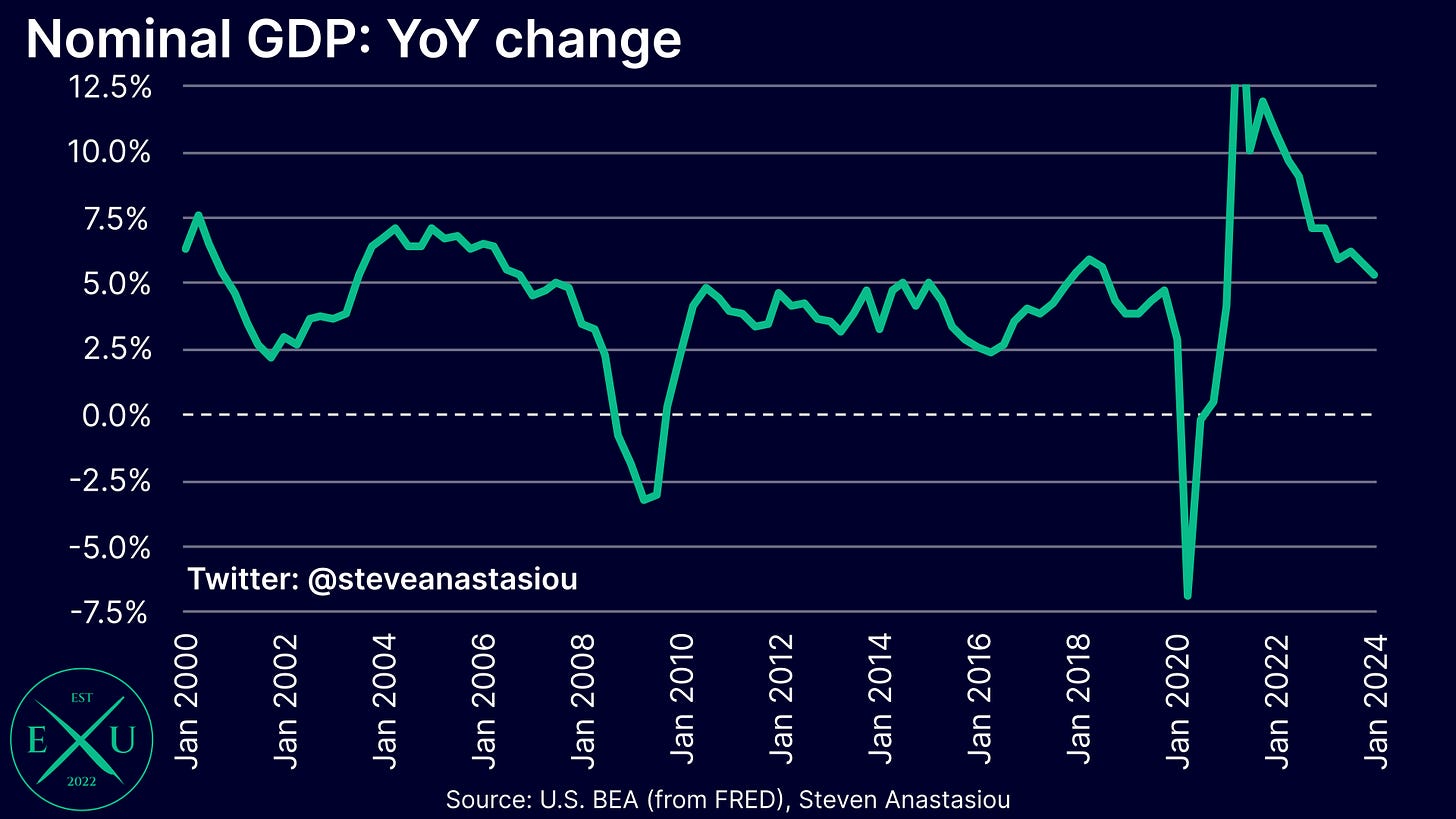
Given that nominal economic growth has remained robust over recent quarters — nominal GDP was up 5.4% YoY in 1Q24 — corporate earnings growth has unsurprisingly remained relatively strong, which has benefited stock prices.
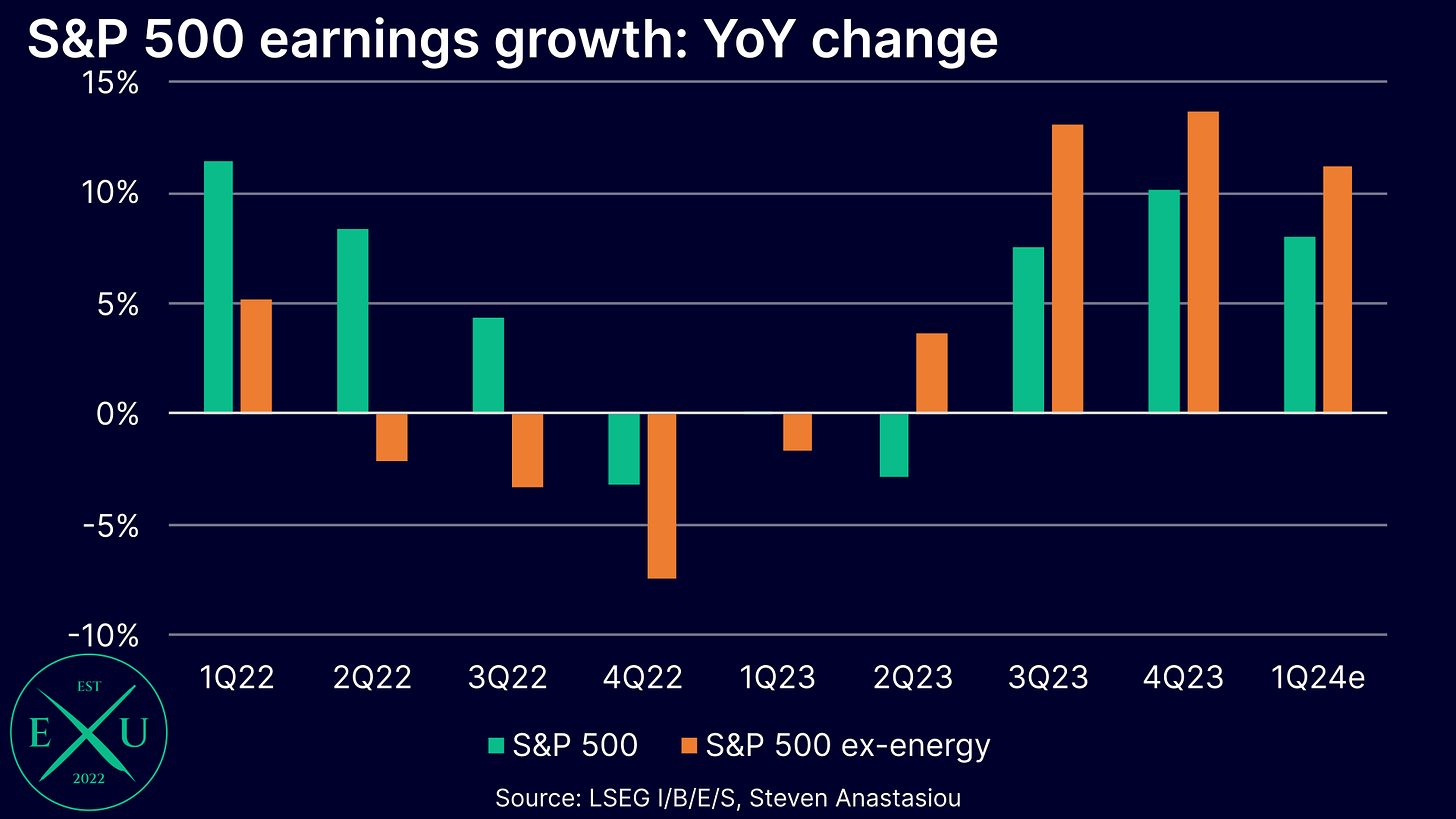
According to LSEG data, S&P 500 earnings growth was 10.1% YoY in 4Q23 or 13.7% on an ex-energy basis. With the great bulk of company earnings for 1Q24 now incorporated (498 companies), earnings growth is estimated at 8.0% YoY or 11.2% on an ex-energy basis.
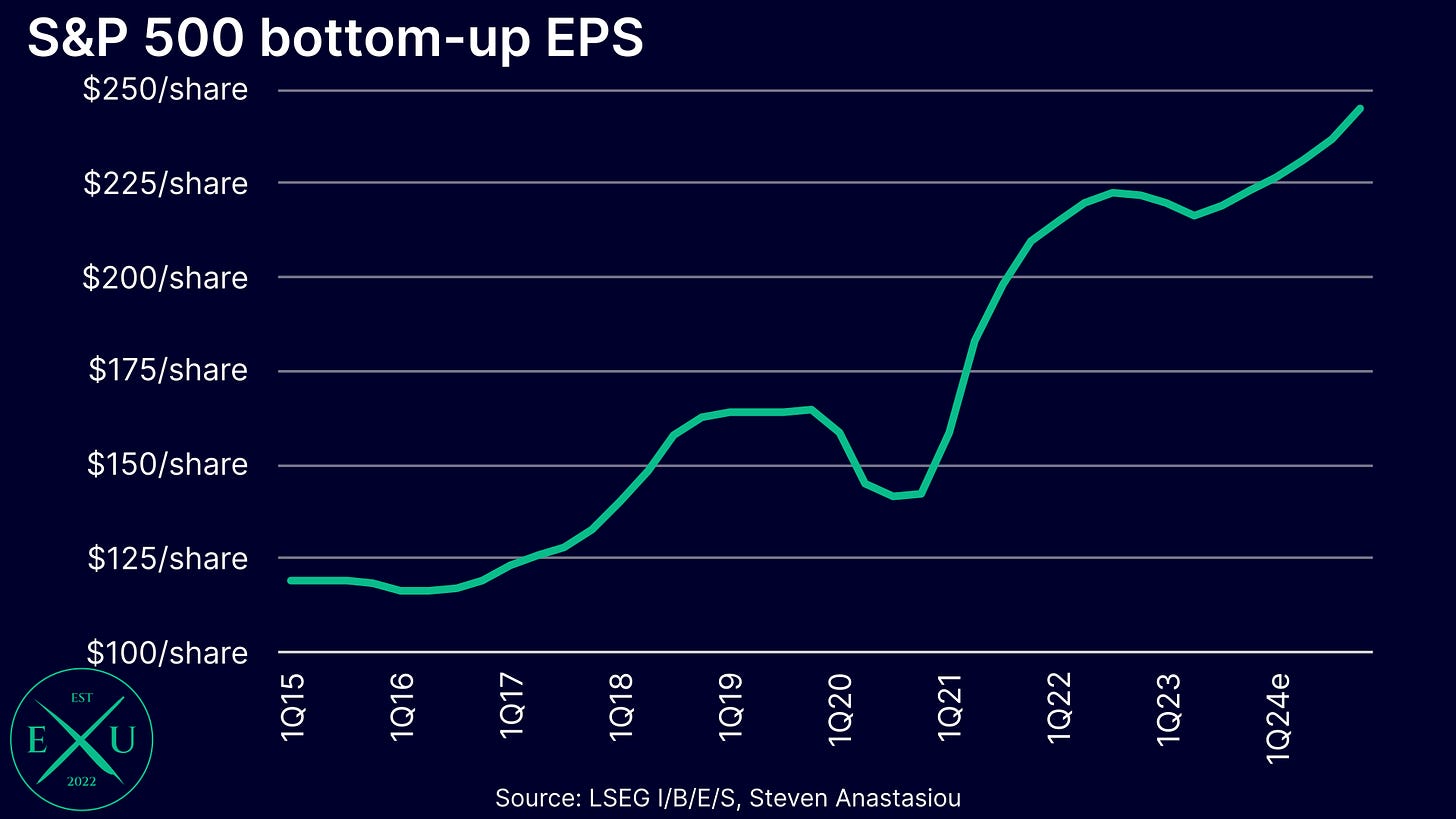
On a bottom-up basis, rolling 4-quarter earnings to 1Q24e for the S&P 500 are estimated to rise to $226.6/share in 1Q24, up from $222.9/share in 4Q23.
Valuations
Given rolling 4-quarter earnings to 1Q24e of $226.6/share, this results in a trailing P/E ratio of 24.2x as of 18 June. Current analyst expectations for continued earnings growth to $244.7/share for CY24e would see the S&P 500’s P/E ratio fall to 22.4x by the end of this year and 19.6x based on the current CY25e of $279.1/share.
Equity market outlook
Last updated: 20 June 2024
While equity valuations may seem elevated, they are being supported by liquidity levels that remain abundant and the Fed’s recent decision to significantly reduce the pace of QT. Relatively strong nominal economic growth, which has been supporting robust earnings growth, is also continuing to support equity valuations.
Though given my expectation for a material economic slowdown in 2H24, this rather ideal backdrop for equity markets may shift materially, as earnings growth would be expected to slow significantly as economic weakness grows. Earnings growth is also likely to slow as inflation moderates further, which acts to place downward pressure on nominal economic growth.
Given that a material economic slowdown would also be expected to negatively impact investor sentiment and could lead to an increase in concerns surrounding the possibility of the US entering a recession, equity valuations could also be hit by a rotation out of cyclical risk assets.
Though likely acting to support equity valuations in the event of a material economic slowdown, would be looser Fed policy. With the Fed’s significant reduction in the pace of QT already sending a clear signal that the Fed is significantly concerned about reducing the level of reserves, the Fed may end QT entirely or even revert to pumping in additional liquidity should material economic weakness emerge.
Given that I expect a material economic slowdown to coincide with significant additional disinflation, I currently expect multiple interest rate cuts in 2H24, which could also act to provide further support to equity valuations.
Though given the recent inflationary experience, it’s important to consider that the Fed may deliver a far more muted response to a potential material economic weakening than the aggressive policy measures that investors have become accustomed to since the GFC, which may significantly increase the severity of an economic slowdown and catch investors off guard.
While I currently expect the US to avoid a recession in 2H24, I view the bigger risk as firmly being slanted towards a recession as opposed to a “no landing”. In the event that a recession does occur, then this may result in a potentially major short-term decline in equity prices, with the subsequent medium- to longer-term outlook for equities to be largely dictated by the aggressiveness of any fiscal and monetary policy response. As noted above, in light of the recent inflationary experience, it’s important to consider that the Fed may adopt a delayed/less aggressive response to an economic contraction than has been typically seen since the GFC, which could increase the risk of a recession and its severity, with flow-on negative implications for equity prices.
After a strong start to the year, I thus consider the second half outlook for equities to be much more nuanced, with the price support provided by abundant liquidity expected to be increasingly offset by growing risks to the economic outlook, with the extent of any potential economic slowdown and subsequent policy response set to have a big bearing on the direction that equity prices head.
Though in the event that US economic growth instead remained resilient in 2H24, then this could lead to a continuation of solid earnings growth and the current broadly positive backdrop for equities.
While note an exhaustive list, key factors that may be supportive of equity prices include:
The Fed’s decision to reduce the pace of QT amidst significant sums remaining in the Fed’s RRP facility — given the outlook for the federal government deficit, this could result in bank reserves not only remaining abundant, but growing further during 2H24.
The potential for multiple 2H24 interest rate cuts.
The potential for material disinflation to provide further support to equity multiples.
The US economy remaining more resilient than anticipated, with nominal economic growth continuing at a robust pace, which would be supportive of continued earnings growth.
While note an exhaustive list, key factors that could lead to declines in equity prices include:
The potential for a significant decline in inflation to materially reduce nominal economic growth, placing significant downward pressure on earnings growth.
An increase in concerns surrounding the economic outlook, which could significantly impact investor sentiment and lead to reduced allocations to equities and lower valuation multiples.
Inflation failing to moderate as expected in 2H24, which could see interest rates kept on hold or raised further in 2H24, compressing valuations.
The US economy entering a recession and Stage 4 of the Economic Cycle, which could see both corporate earnings and equity allocations plunge.
The potential for the Fed to be less responsive to a potential economic weakening than investors have grown accustomed to since GFC in light of the recent inflationary experience, which could exacerbate an economic weakening and further hit investor confidence.
Bond (Treasury) market review
Yield movement
While there have been lots of ups and downs along the way, from the end of last year to 17 June, the 6-month Treasury yield has risen from 5.26% to 5.39%, the 1-year yield has risen from 4.79% to 5.11%, the 2-year yield from 4.23% to 4.75%, the 10-year yield from 3.88% to 4.28% and the 30-year yield from 4.03% to 4.40%.
Market interest rate cut expectations
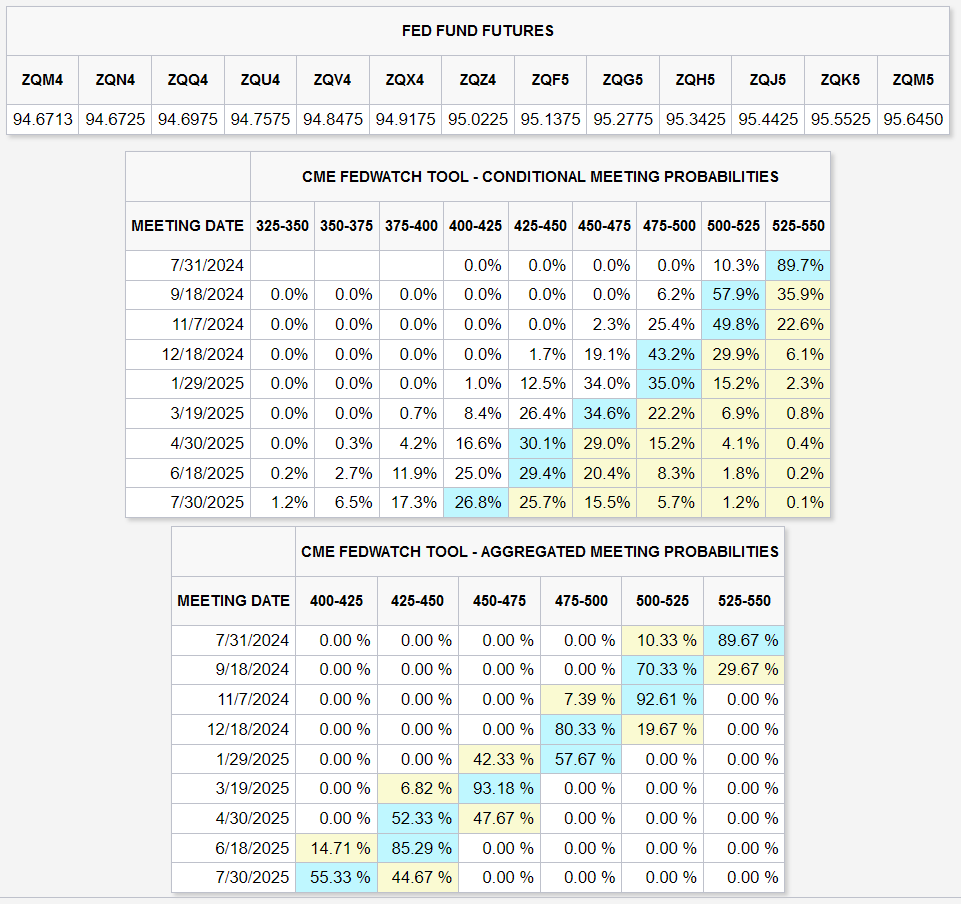
Market expectations for interest rate cuts in 2024 have fallen from a peak of seven in January, to two at the time of writing. While this is a significant reduction, expectations fell to as low as just one interest rate cut at some points during this calendar year.
Bond (Treasury) market outlook
Last updated: 20 June 2024
While seeing lots of ups and downs, the increase in Treasury yields since the beginning of the year has come on the back of a string of relatively hot inflation readings and nonfarm payroll growth that remains elevated by historical standards.
Though with 1Q24 GDP growth being revised lower, personal consumption spending MoM negative in April and May’s US CPI report showing major disinflation, the moderation in yields that has been seen over recent weeks points to the type of backdrop that I expect to grow as the year progresses.
By backdrop, I am referring to my expectation for a material economic slowdown and material disinflation in 2H24, which is an environment that I expect to be broadly supportive of lower Treasury yields.
This is in large part predicated on my expectation that this will lead to multiple 2H24 interest rate cuts and a material reduction in investor concerns surrounding the medium-term inflation outlook.
Should an economic weakening spark a material increase in concerns surrounding the potential for a recession, then this could also spark a significant flight to safety and much more defensive asset allocations, which would also be expected to benefit Treasury prices.
The above discussion of the Fed’s decision to significantly scale back QT whilst reserves remain abundant, which points to the Fed having significant concerns about reducing bank reserves, suggests that in the event of a major economic weakening, that the Fed could end QT altogether. This would act to reduce downward pressure on Treasury prices. In the event that the US economy entered a recession, then this could prompt the Fed to restart QE, which would act to place upward pressure on Treasury prices.
Though given the Fed’s current effort to reduce high inflation, it’s important to note that any potential future policy easing may be kept much more muted than in response to prior economic downturns, which may act to limit the relative level of upside for Treasury prices.
Furthermore, should the US economy and/or inflation prove more resilient than expected, then this could see interest rates kept on hold (or raised further), whilst also increasing concerns about the medium- to longer-term interest rate outlook, which could see Treasury yields move higher still. Continued large federal government deficits under such a economic scenario could also spark significant market concern and lead to a significant increase in term premiums.
While note an exhaustive list, key factors that could lead to increases in Treasury prices/a reduction in Treasury yields, include:
The Fed cutting interest rates in 2H24 and signalling more easing ahead.
Inflation moderating significantly, leading to reductions in expectations for future interest rate levels.
Economic growth weakening significantly, leading to reductions in expectations for future interest rate levels.
Investor confidence surrounding the economic outlook weakening significantly, leading to more defensive asset positioning.
A recession, leading to a flight to safety and drastically more defensive asset allocations.
While note an exhaustive list, key factors that could lead to decreases in Treasury prices/an increase in Treasury yields include:
Inflation failing to moderate as expected in 2H24, which could see interest rates kept on hold or raised further.
Inflation failing to moderate as expected in 2H24, which could result in investor expectations for the medium- and long-term interest rate outlook rising.
Nominal economic growth remaining elevated, which could result in market expectations for the terminal rate moving materially higher.
US budget deficits widening significantly, resulting in materially increased net issuance.
Thank you for supporting an independent economics research alternative via your subscription to Economics Uncovered.
I hope that this latest research piece provides you with significant value.
To help improve the reach of this update, please consider “liking” this article by clicking the heart icon at the top of this post/email.
If you have any questions regarding this latest update, ideas for future research pieces, or for how Economics Uncovered could be improved to provide you with even more value, feel free to send me a message, or email me at steven@economicsuncovered.com


