US CPI Review & Flash Forecasts: core CPI expected to hit a key milestone in December
Disinflation continued to strengthen in November, with all key price categories showing a moderation in price pressures - a key core CPI milestone is now on the verge of being hit.
Executive summary
Disinflation continued to strengthen in November, with all key price categories (durables, nondurables and services) showing a moderation in price pressures.
While used car prices have been recording YoY deflation for an extended period, new vehicle prices have also begun to show material disinflation, with a second consecutive MoM decline seen in November.
In addition to another significant decline in gasoline prices, apparel prices saw a record-breaking decline in November.
Many services categories saw another month of material disinflation, with overall adjusted core services price growth seeing a second consecutive month of relatively more moderate growth.
While base effects are expected to result in annual headline CPI growth rising in December, the core CPI is expected to record a ninth consecutive month of moderating YoY growth and mark an important disinflationary milestone in the process.
High level review
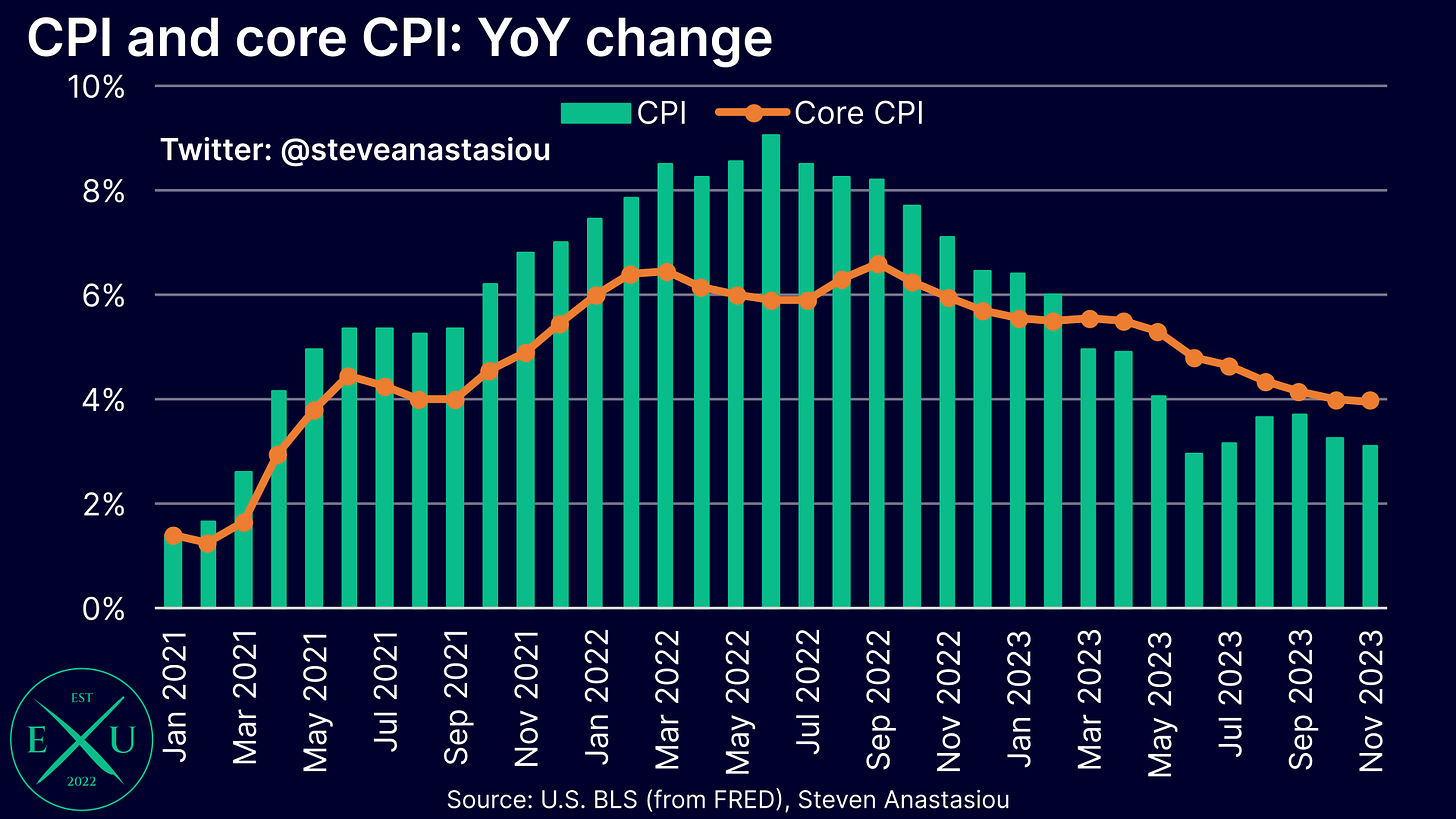
Annual CPI growth declines to 3.1%, while core CPI growth ekes out an 8th consecutive month of disinflation
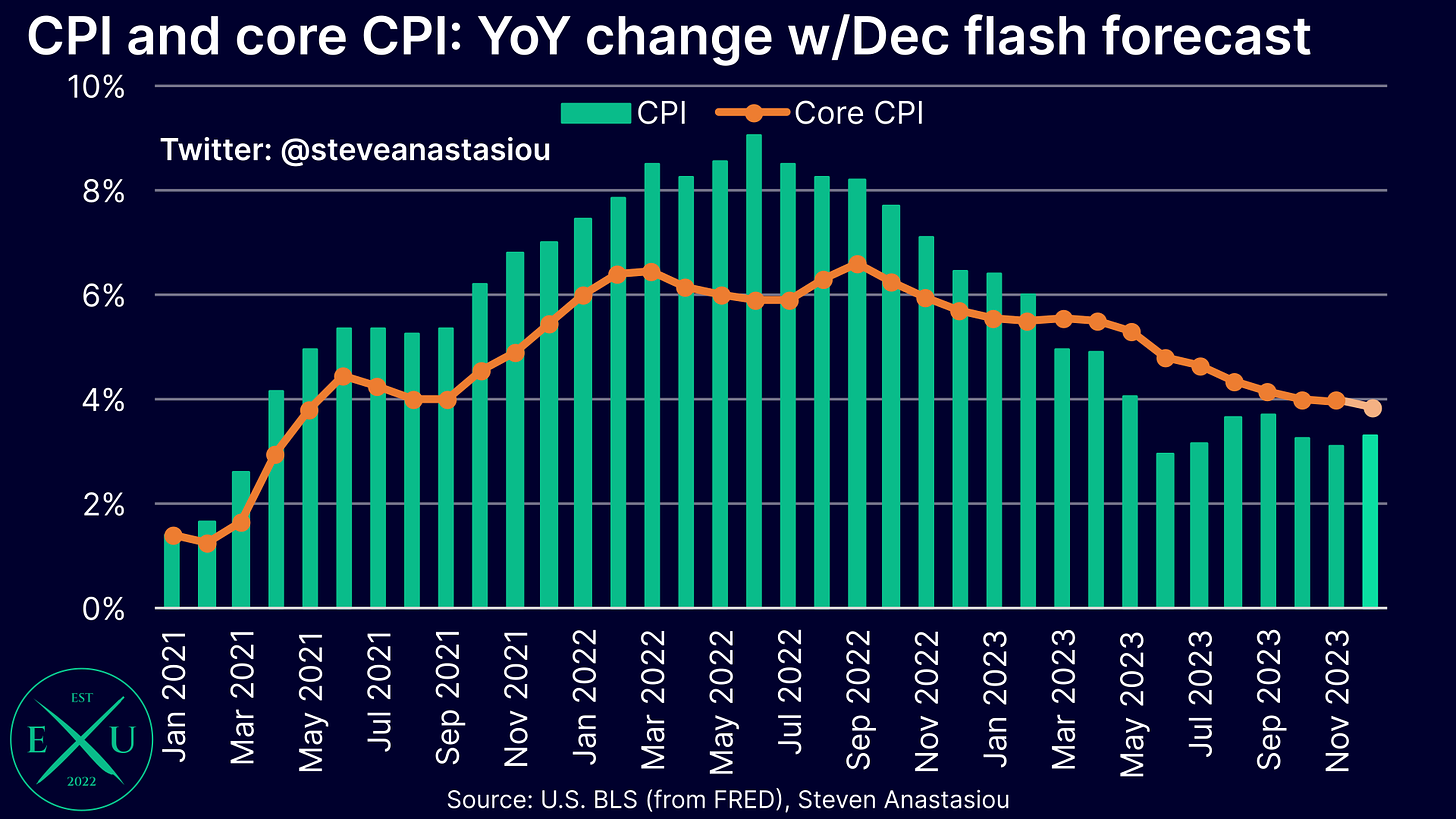
Headline CPI growth fell from 3.2% in October, to 3.1% in November, while core CPI growth managed to eke out an eighth consecutive month of disinflation — while growth remained at 4.0%, it fell from 4.03% to 4.01% on a two decimal place basis.
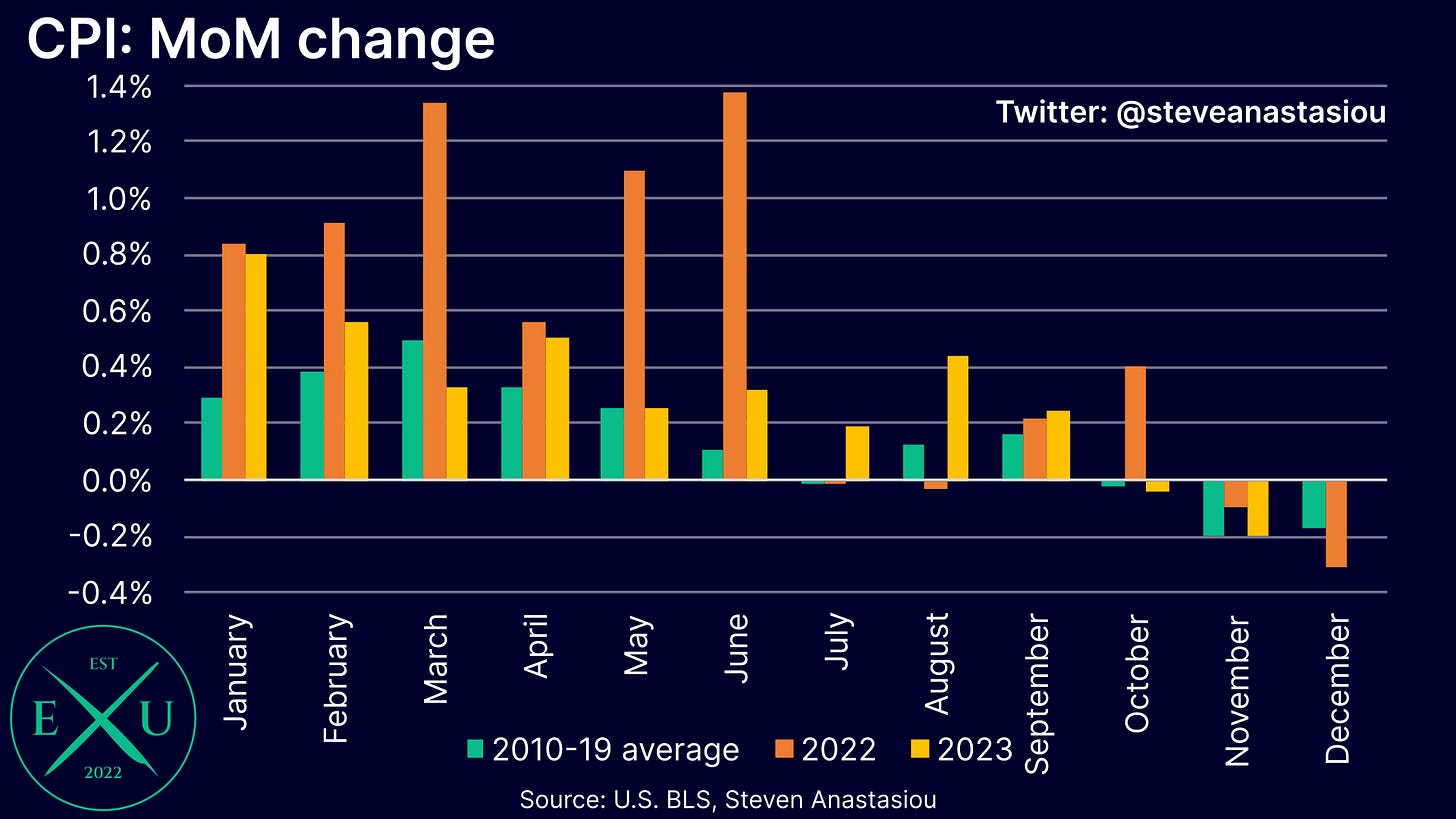
Headline CPI growth records 2nd consecutive MoM decline, with growth again in-line with the historical average
On a MoM basis, the headline CPI saw its second consecutive month of deflation, with a large decline in gasoline prices again being a major driver.
This resulted in MoM growth being in-line with its respective 2010-19 average for a second consecutive month.
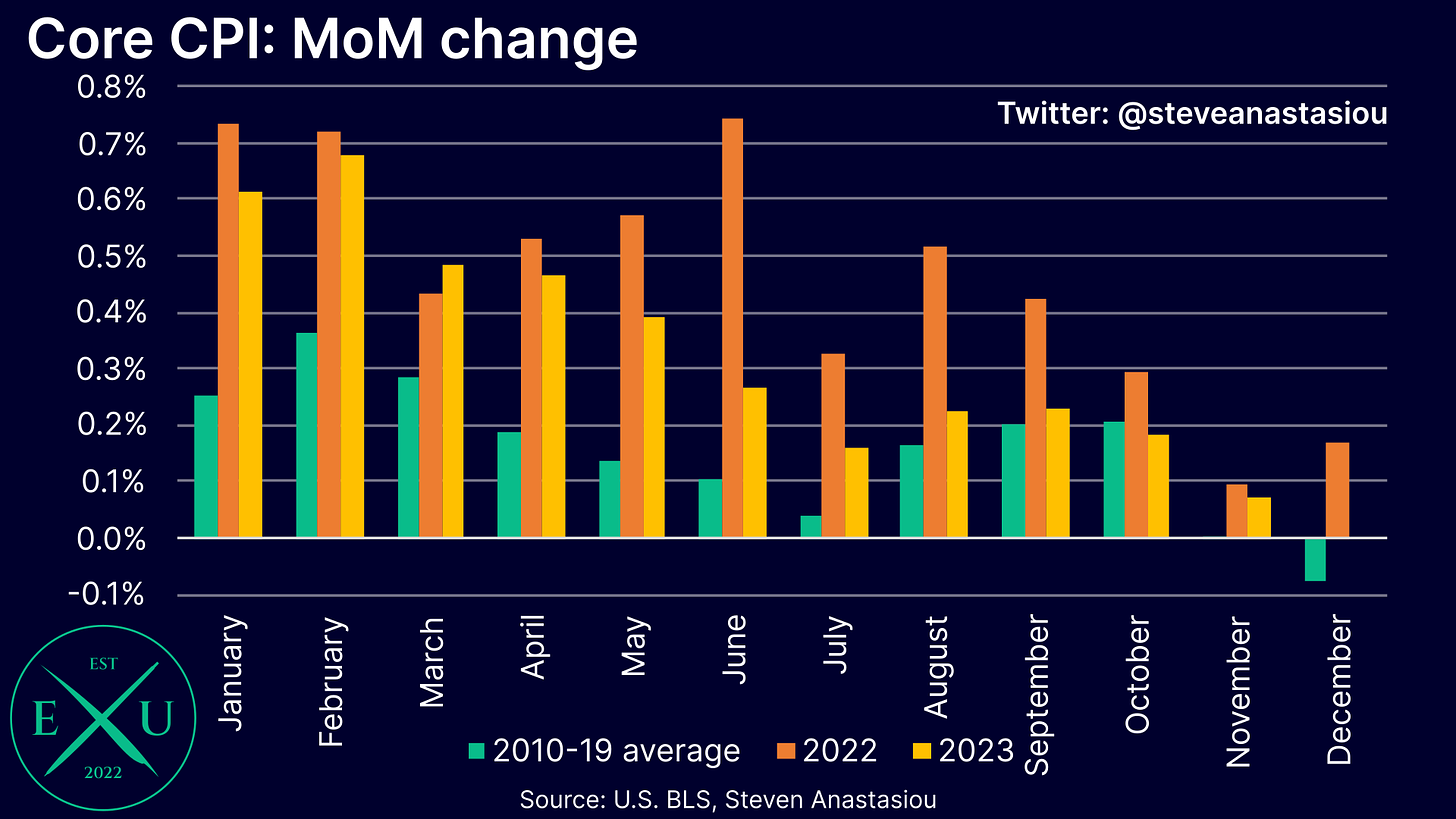
MoM core CPI growth largely in-line with its historical average for the 4th consecutive month, providing a strong signal for the Fed’s 2% target
For the first time since April, monthly core CPI growth accelerated versus its respective historical monthly average.
While I had expected an increase in relative growth, the actual increase was less than I had anticipated, with MoM growth only modestly above its respective historical average (0.07%).
This marks four consecutive months of MoM growth being largely in-line with its respective 2010-19 average — a time period in which the core CPI saw average YoY growth of 1.8%.
With monthly core CPI growth a cumulative 0.14% above its 2010-19 average over the past four months, this implies an annualised growth rate of ~2.3%. Given that annual core CPI growth has tended to overstate annual core PCE Price Index growth by 0.3% since 2000, this would be expected to largely correlate to ~2.0% annual core PCE growth — which would be expected to largely correlate to the Fed’s 2.0% headline PCE target.
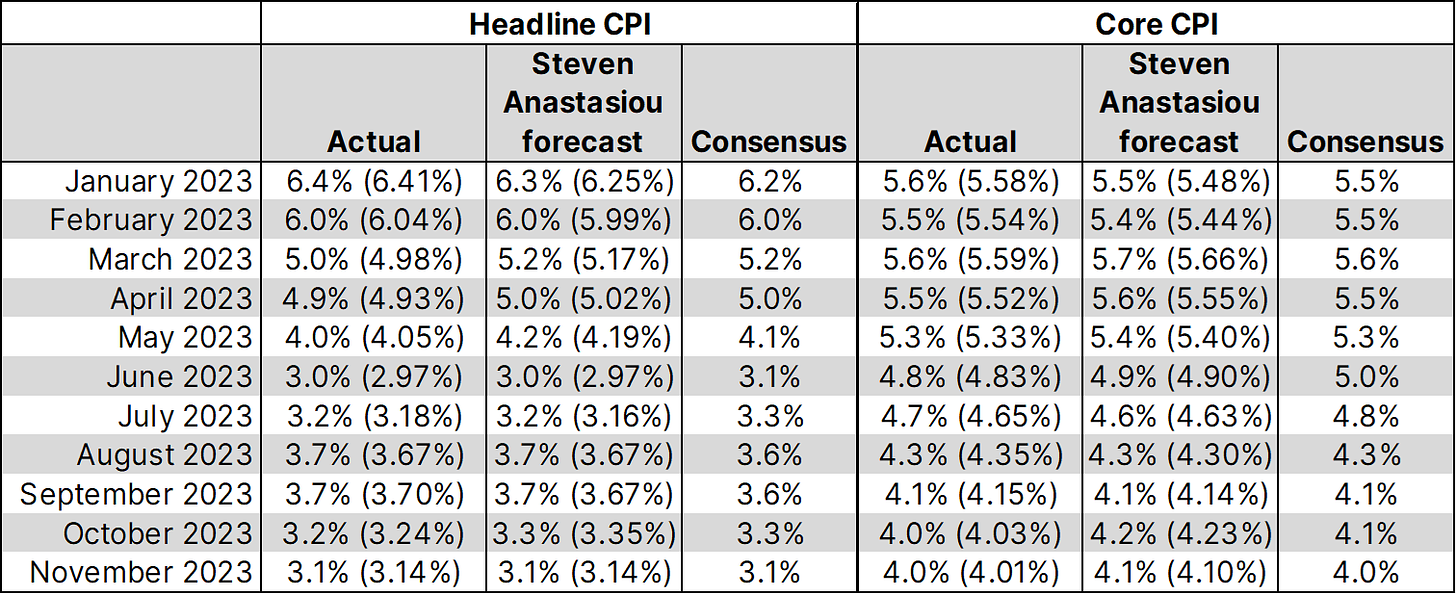
Headline CPI forecast equals the actual result, core CPI growth comes in slightly below forecast
Comparing the actual CPI numbers to my forecast, for the third time in the past six months, my headline CPI forecast was exactly in-line with the actual result to two decimal places (3.14%).
For the core CPI, YoY growth came in below my estimate for a second consecutive month (4.01% vs 4.10% forecast).
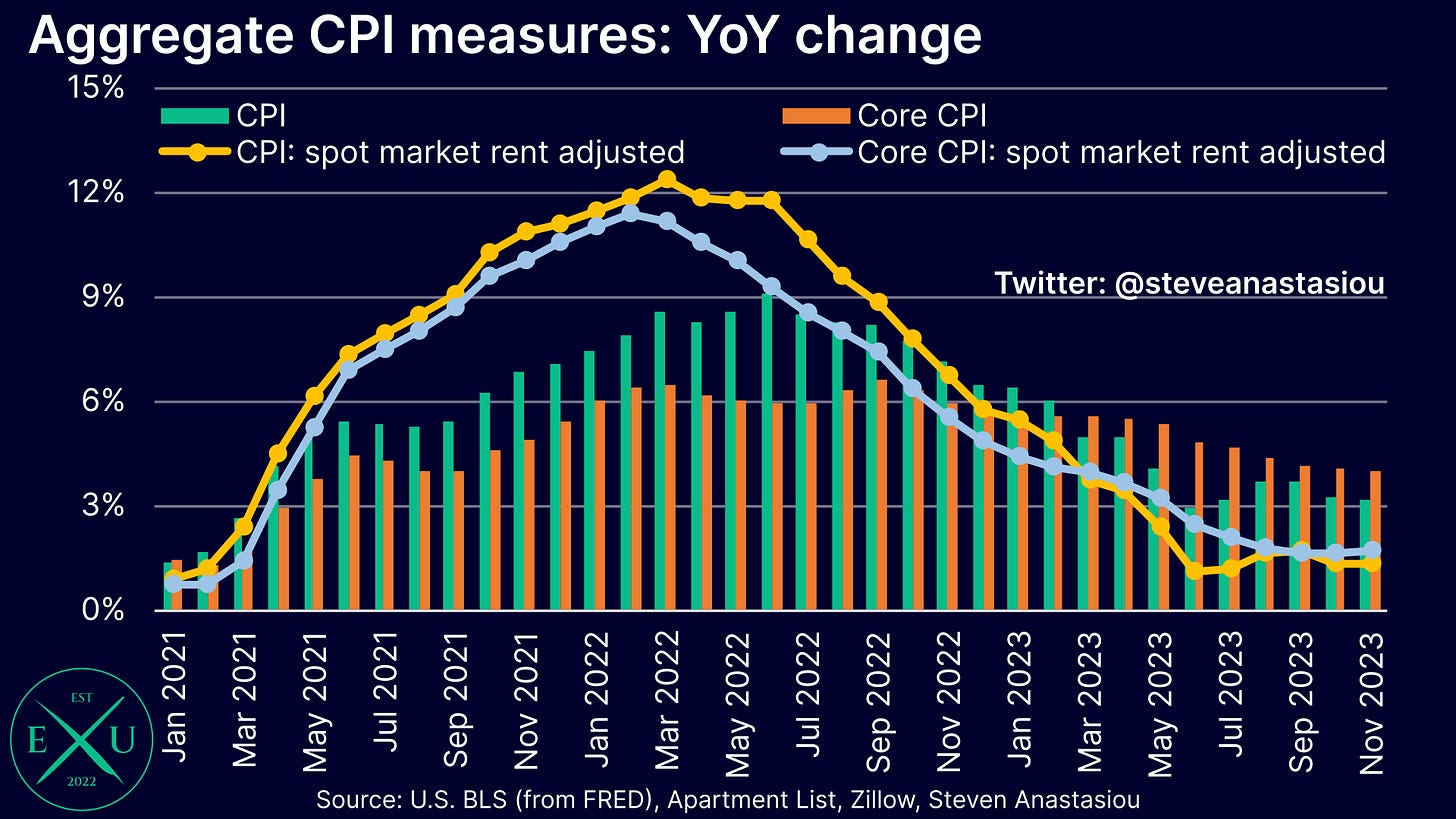
Spot market rent adjusted CPI growth remains <2% YoY
On a spot market rent adjusted basis, headline CPI growth remained at 1.3% YoY in November. This marks the sixth consecutive month of YoY growth being below 2%.
Meanwhile, core CPI growth adjusted for spot market rents rose slightly, from 1.6% in October, to 1.7% in November. This marks the fourth consecutive month of YoY growth being below 2%.
Given that this measure provides a better reflection of underlying rental growth rates (as opposed to the lagging rental price measurement in the CPI), it suggests that the underlying rate of inflation has already normalised — just as it earlier suggested that inflation was significantly worse than was being reported for much of 2021/22, as the CPI’s lagging rental price measurement understated the change in underlying spot market rents.
CPI ex-shelter has seen MoM growth below its historical average for 3 consecutive months
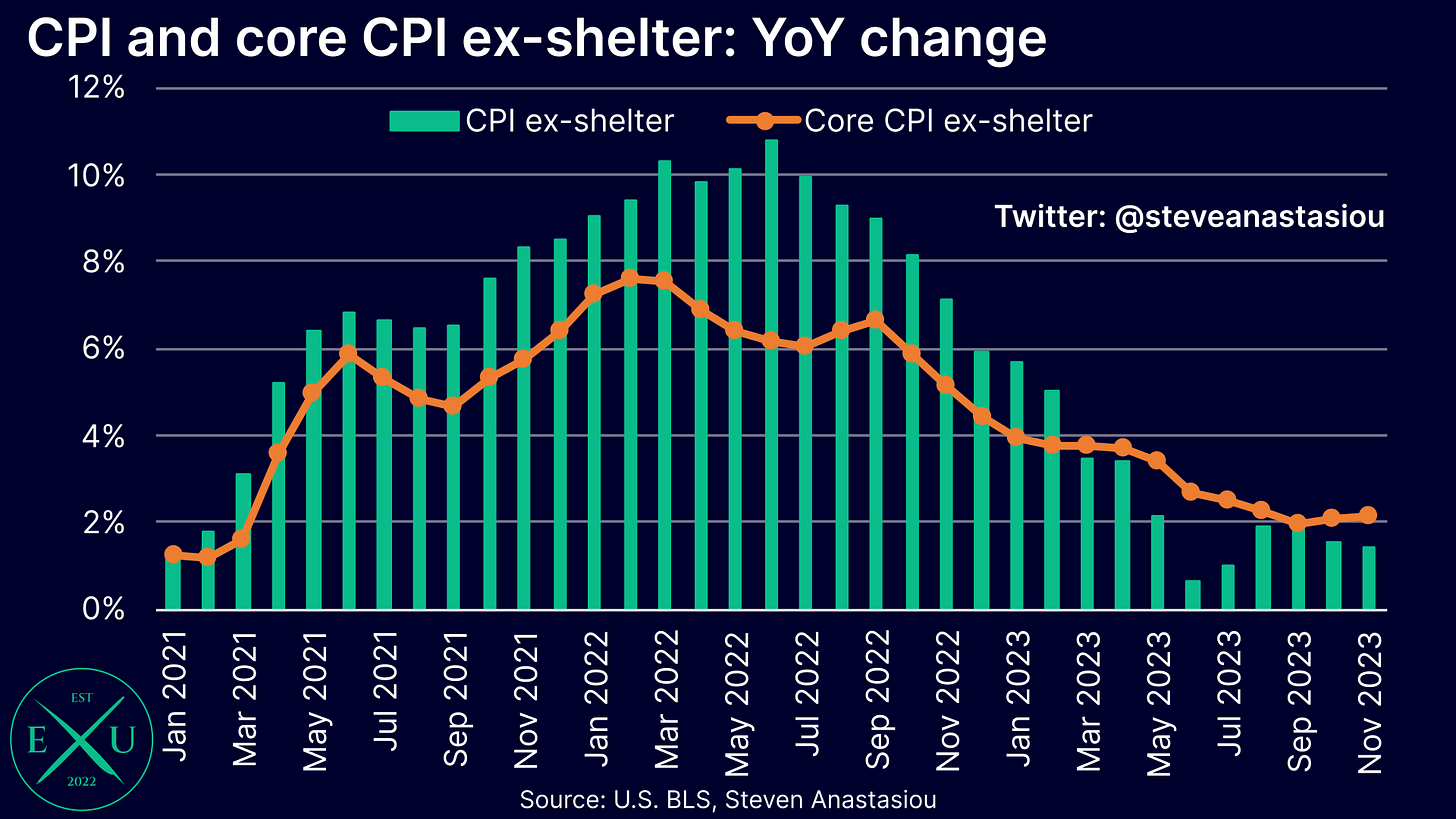
Another way to gauge underlying price growth, is to exclude lagging shelter from the CPI equation.
On such a basis, annual headline CPI growth fell from 1.5% in October, to 1.4% in November. As is the case with the CPI adjusted for spot market rents, this marked six consecutive months of growth being below 2% YoY.
For the core CPI less shelter, growth rose slightly — from 2.0% in October, to 2.1% in November.
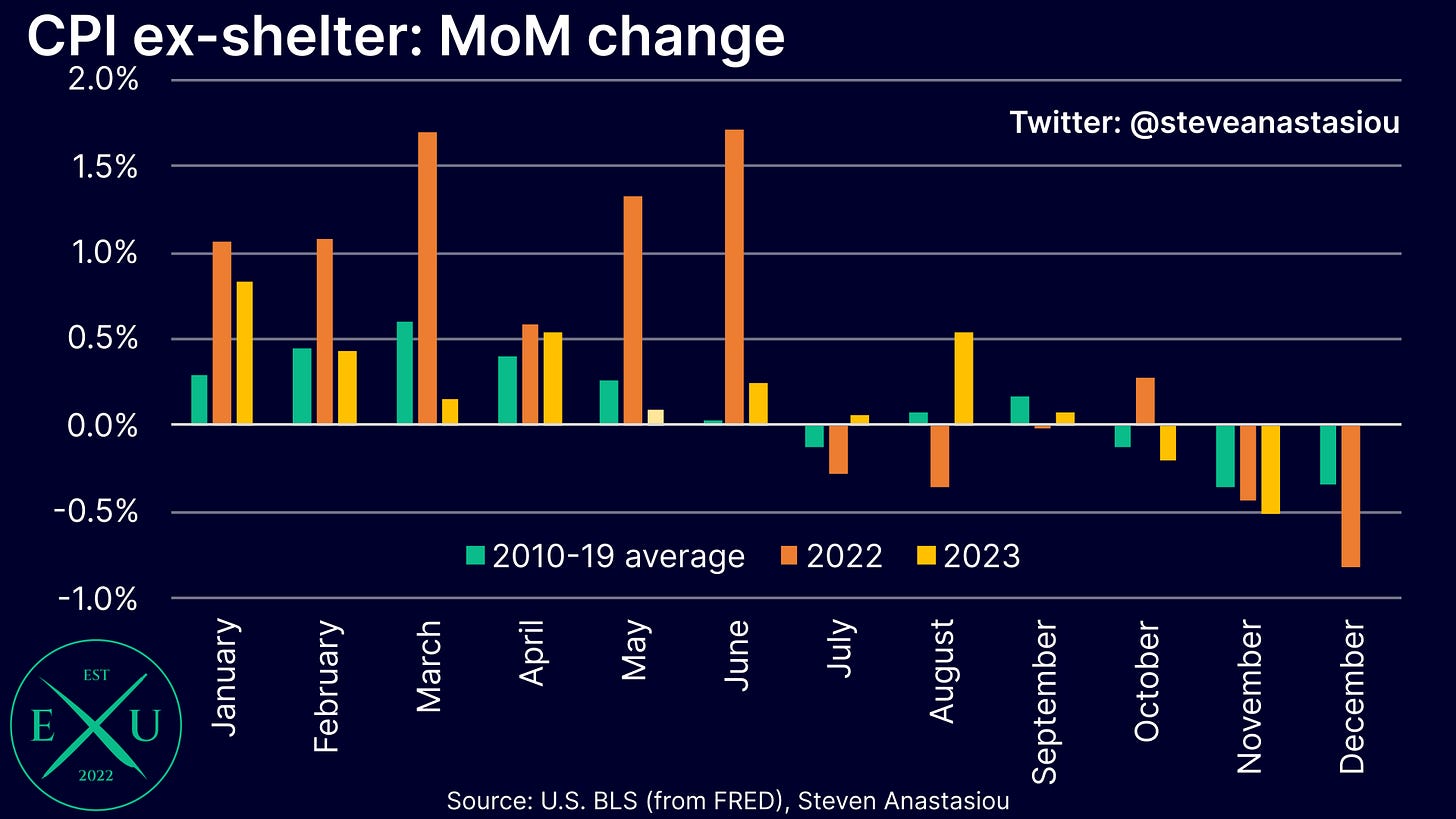
On a monthly basis, CPI ex-shelter growth has been below its respective 2010-19 average for three consecutive months.
While much of the MoM moderation in CPI ex-shelter growth can be attributed to falling gasoline prices over the past two months, the moderation in price pressures has been much broader.
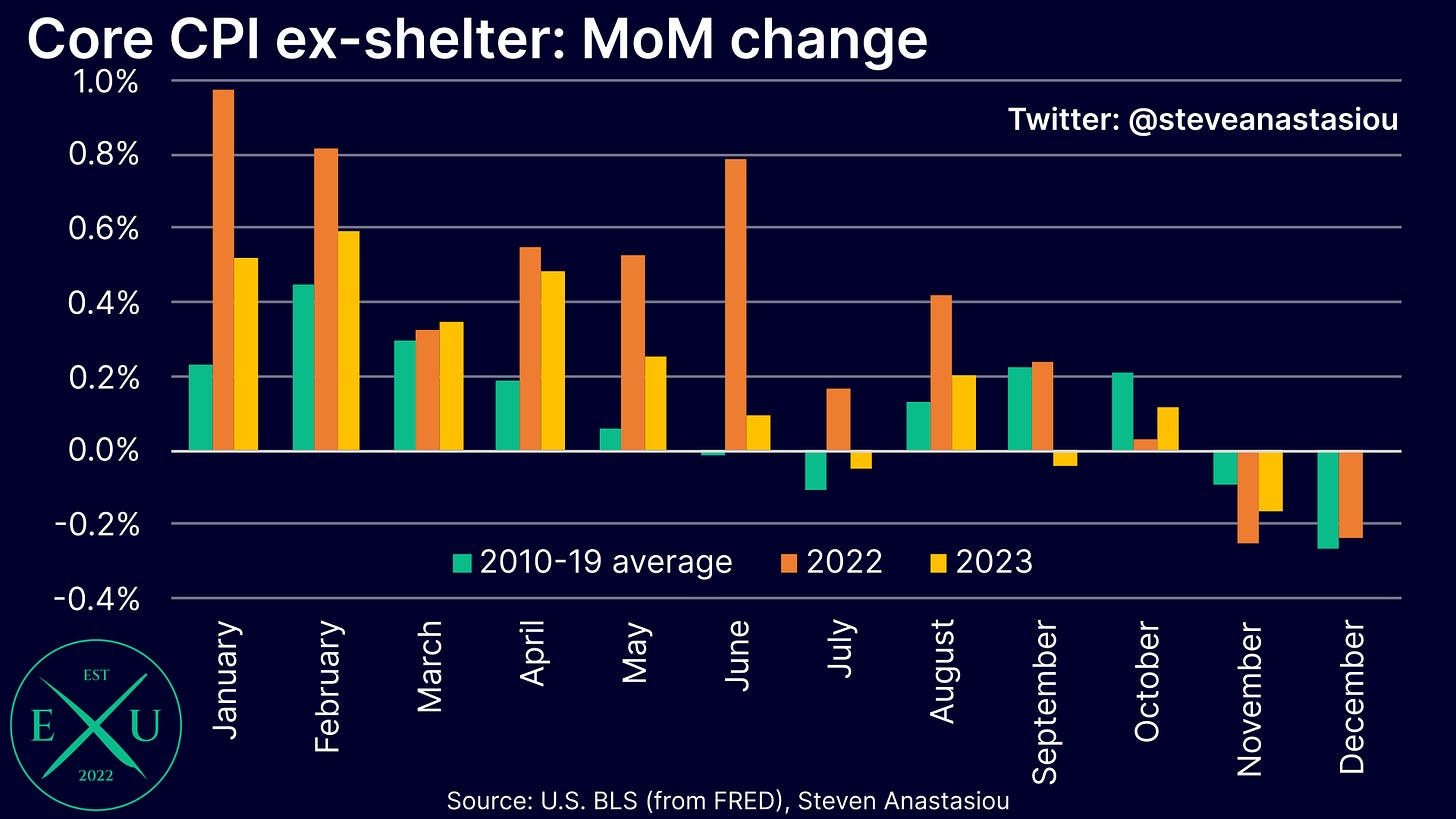
This is illustrated by the fact that monthly core CPI ex-shelter growth has also been below its respective 2010-19 average for three consecutive months.
In conjunction with spot market rent adjusted CPI growth consistently coming in at less than 2% YoY, CPI ex-shelter data, including recent MoM growth trends, strengthens the case that inflation has already normalised, with a further reduction in M2 growth risking a move to deflation over a longer time horizon.
The granular detail
Used car prices unexpectedly rise, but new car prices unexpectedly fall
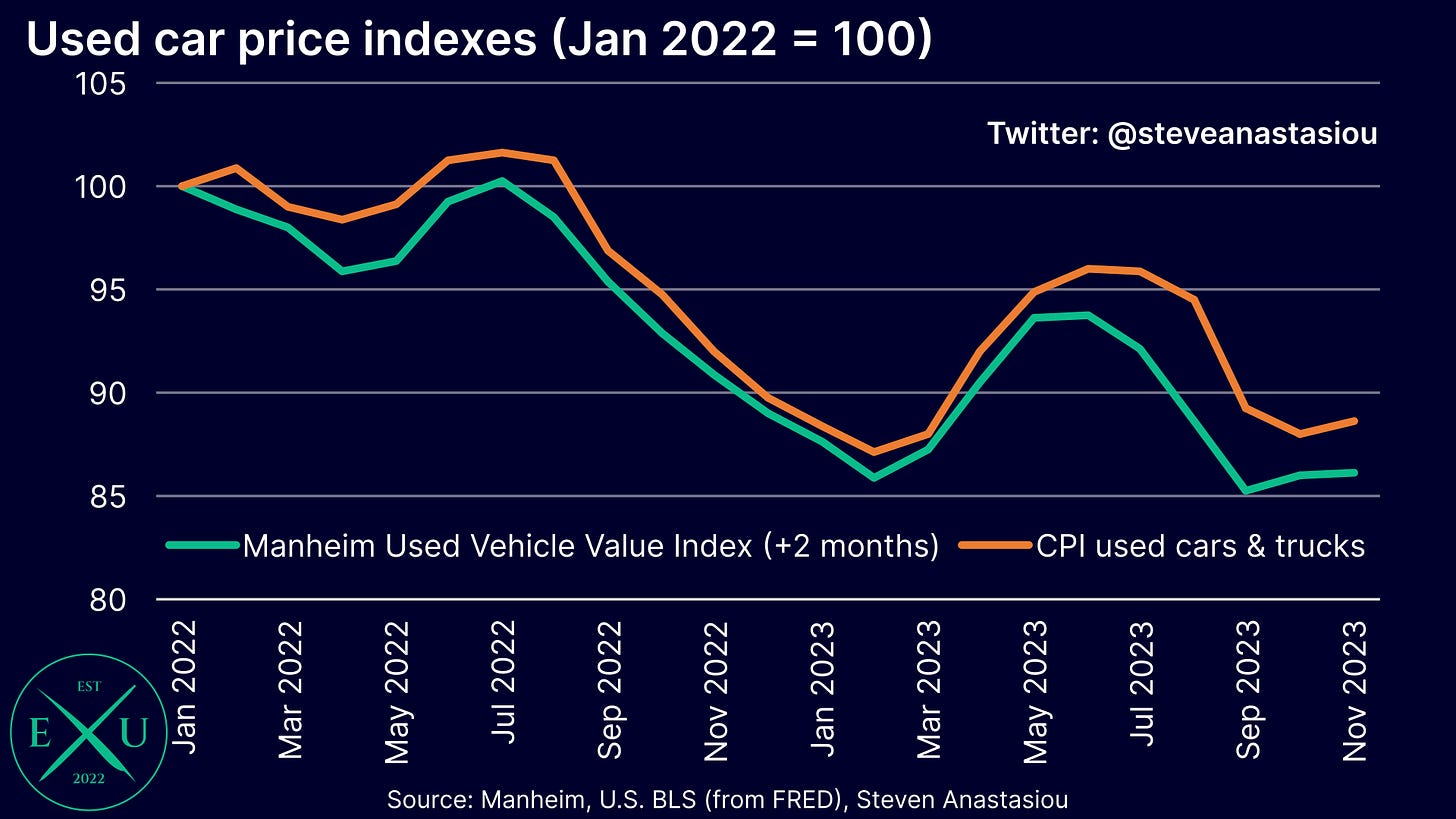
Given the prior move in wholesale prices, the seasonality in retail used car prices, and the relative levels of wholesale vs retail used car prices, I had expected monthly used car prices to decline for a 5th consecutive month — instead, they rose.
This has once again increased the gap that exists between wholesale and retail used car prices, which should act to pressure CPI used car & truck price growth in relation to wholesale prices over the months ahead.
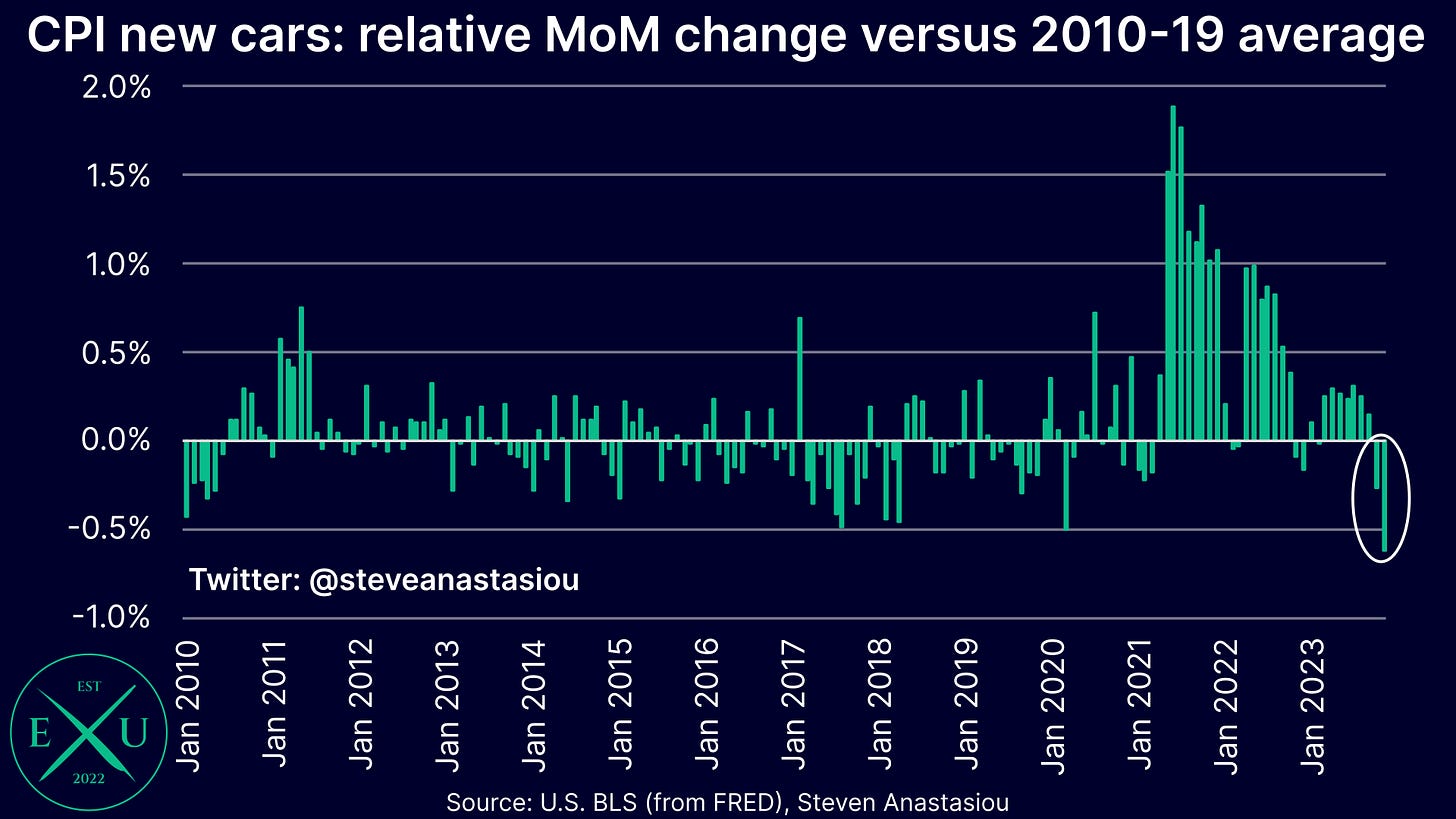
The unexpected increase in used car prices was offset by an unexpected decline in new car prices. This resulted in MoM growth being below the respective 2010-19 average for a second consecutive month — in November, MoM growth was 0.6% below the 2010-19 average. Going all the way back to 2010, this was the lowest relative MoM growth that has been recorded.
After long stretches of significantly above average MoM growth since April 2021, new car price growth has thus now shown significant signs of material disinflation.
Overall durables prices record a fifth consecutive month of deflation
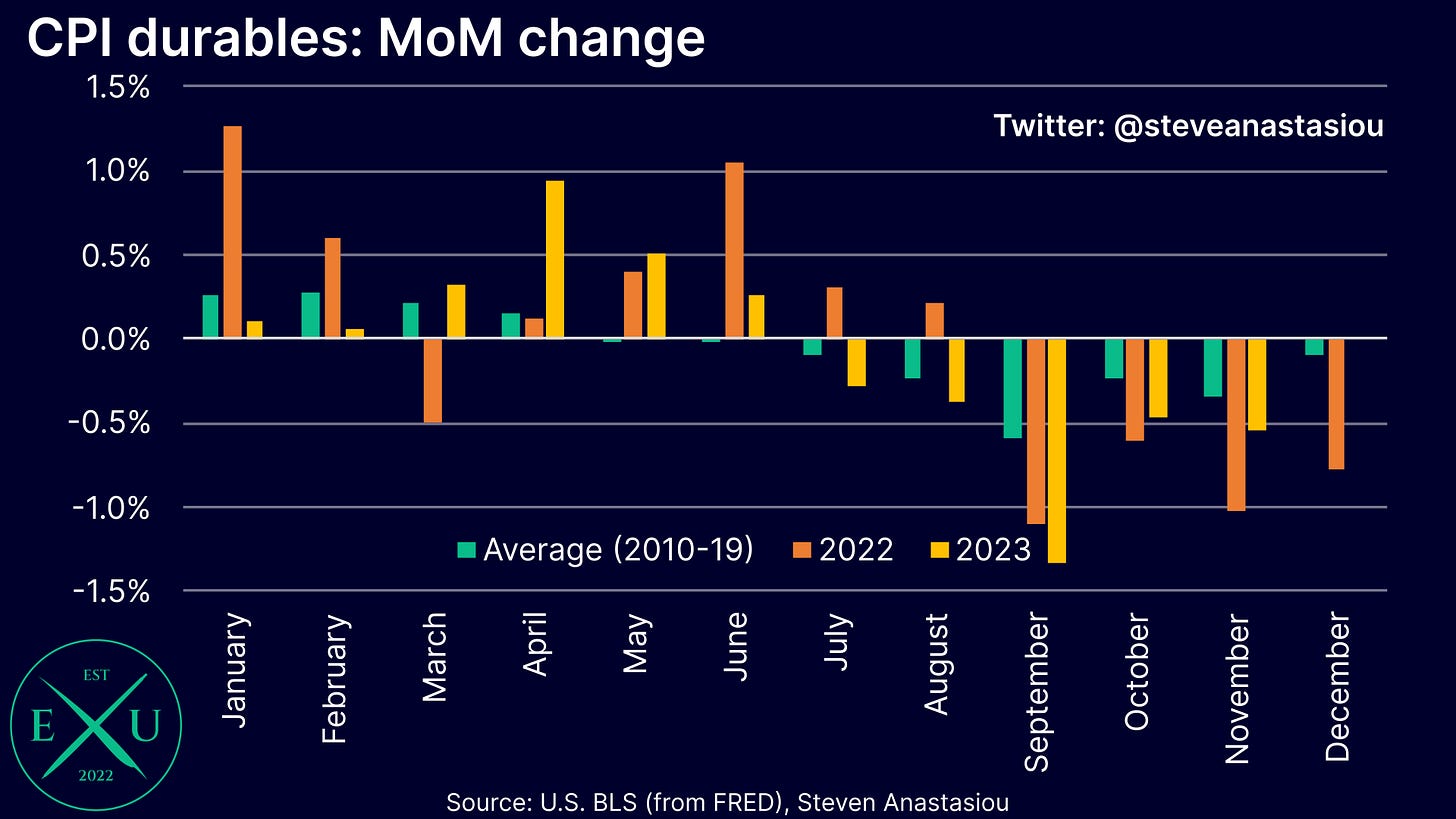
Looking at durables prices as a whole, a fifth consecutive month of falling prices was recorded. Also for the fifth consecutive month, the relative price change was below its historical average.
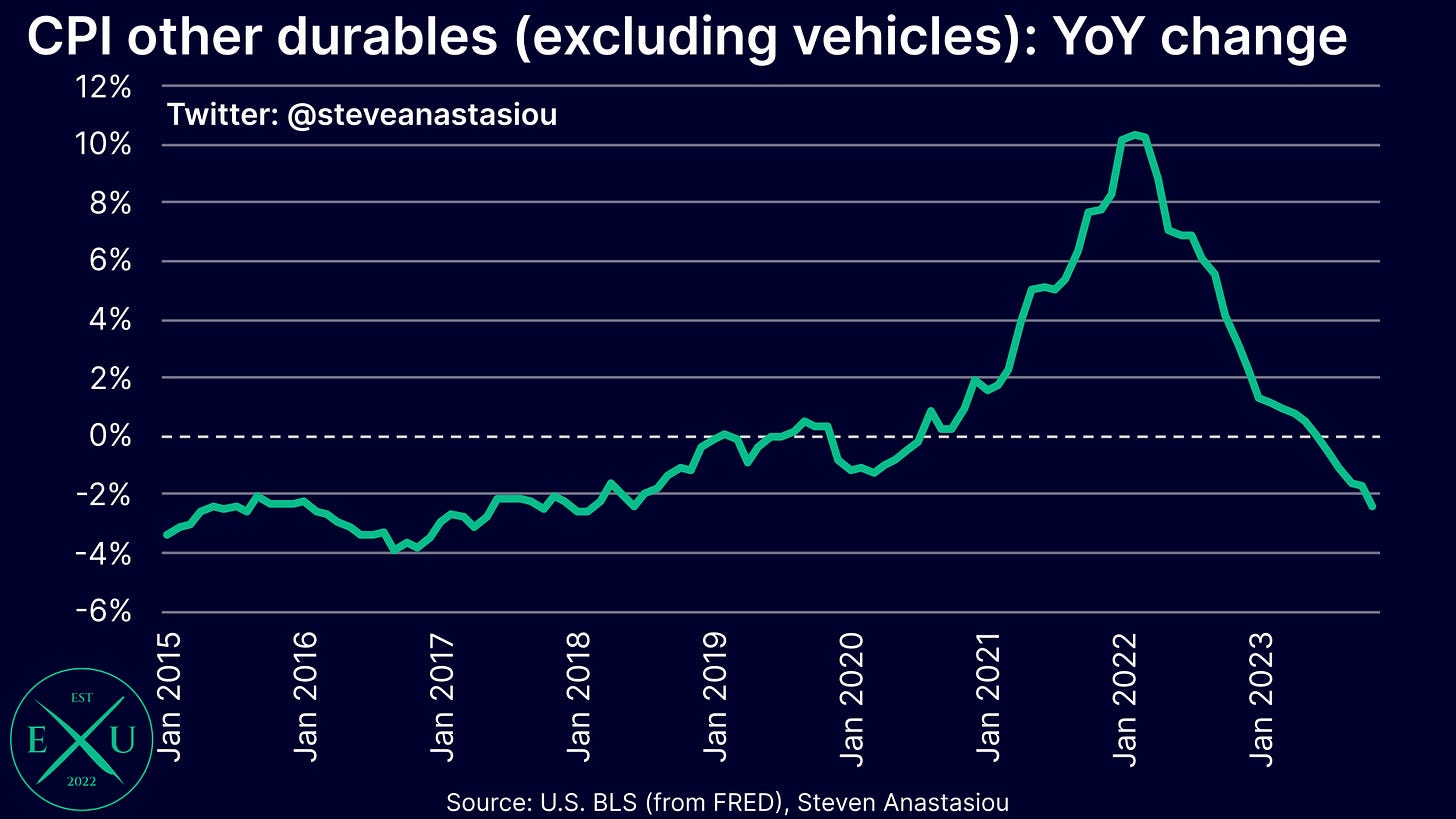
This highlights how durables price deflation is broader than just car prices — indeed, durables price growth excluding vehicles is now -2.4% YoY, with annual price growth moderating for an enormous 21 consecutive months.
Food at home price growth falls below 2% YoY, but food away from home price growth re-accelerates
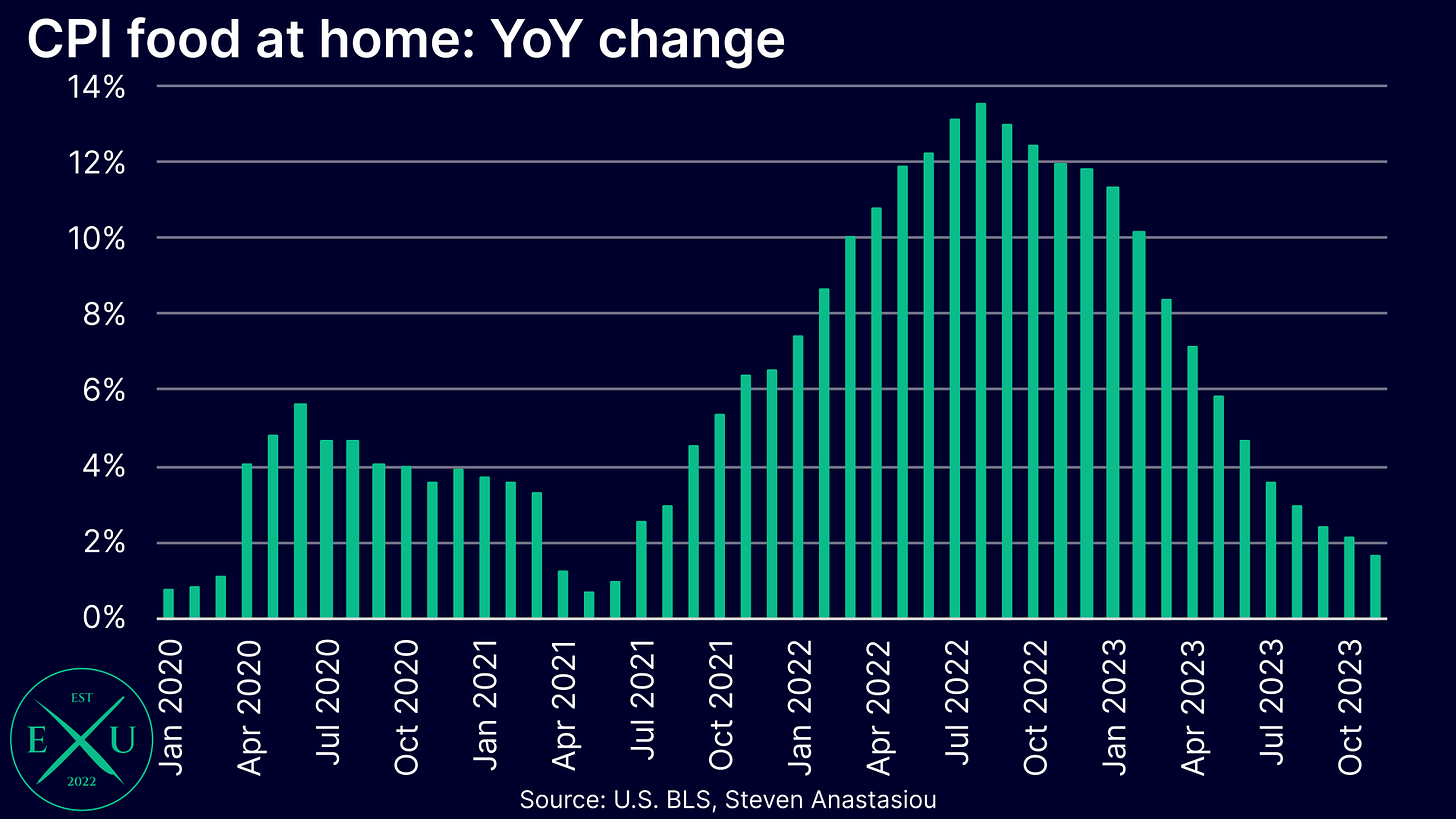
For the first time since June 2021, food at home price growth has fallen below 2% YoY. With MoM price growth an average of 0.1% below its 2010-19 average over recent months, annual price growth could potentially fall below 1% YoY at some point over the months ahead.
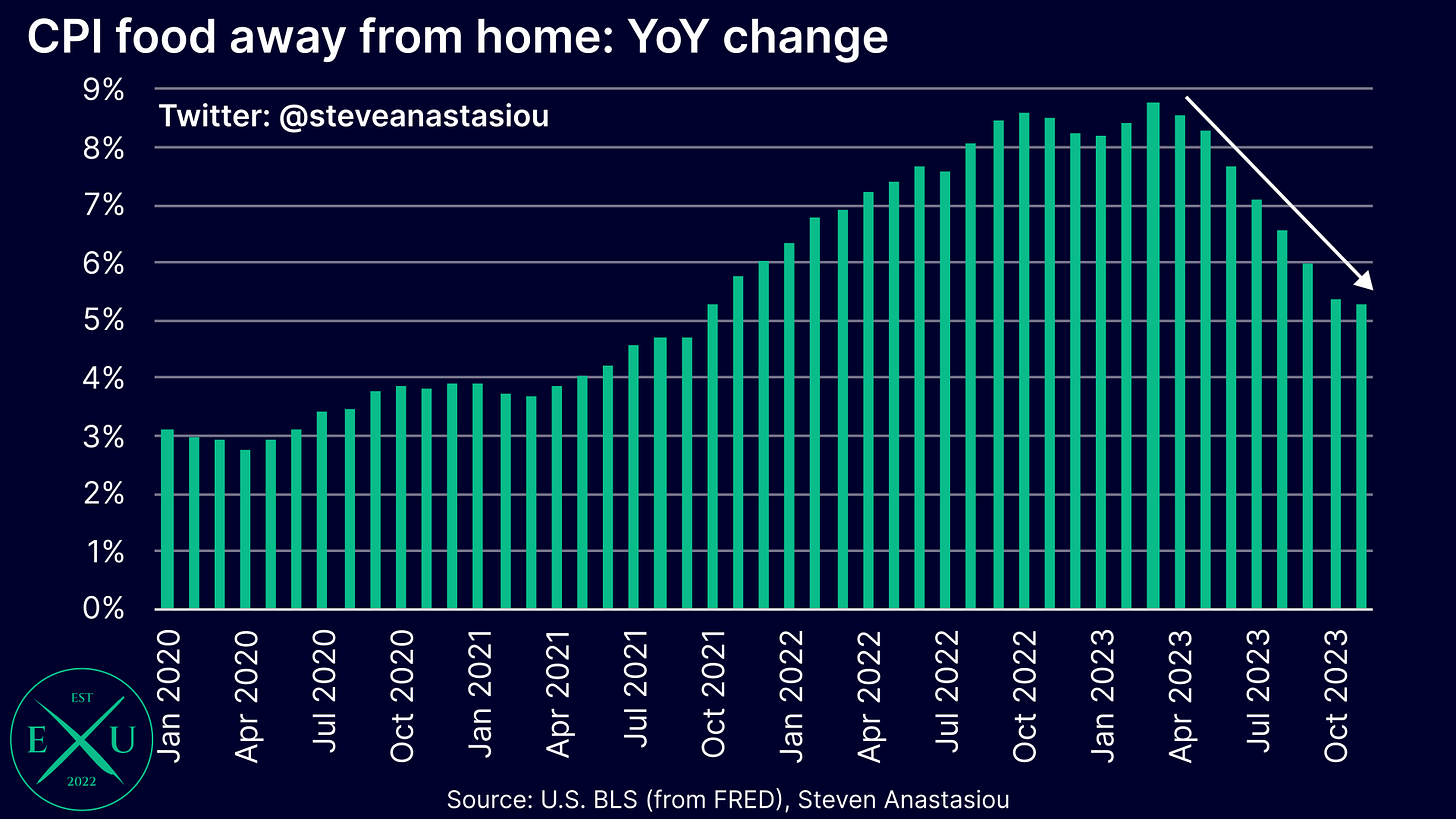
While CPI food at home prices have continued to moderate, CPI food away from home prices have seen MoM growth reaccelerate over recent months.
Despite this acceleration, annual CPI food away from home price growth continued to moderate slightly, falling from 5.4% in October to 5.3% to November — though in order to see YoY growth return to its historical average, monthly price growth will need to moderate further.
Apparel prices plunge MoM, recording the largest ever November decline
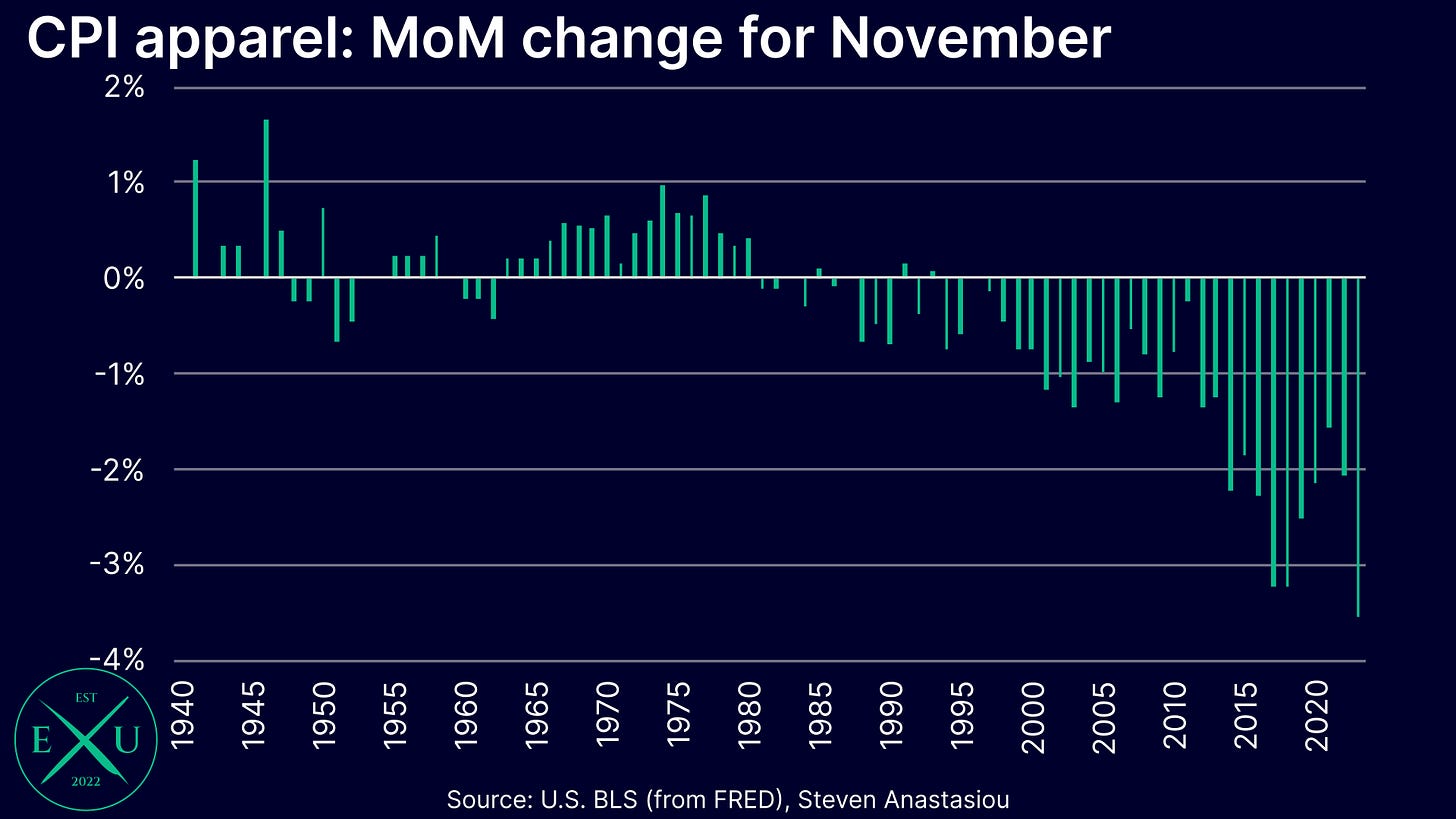
In addition to another very large decline in the CPI energy commodities index (-6.9% MoM), apparel prices recorded a very large MoM decline of 3.5%. While November is an historically weak month for apparel prices (average 2015-19 change of -2.6%), the most recent decline is the largest ever November fall that has been recorded.
In addition to being the largest ever November decline, one can see how discounting patterns have shifted over time, with November becoming a month of increasingly aggressive apparel discounting.
RPR and OER see growth largely in-line with expectations — remember, the moderation is likely to remain gradual
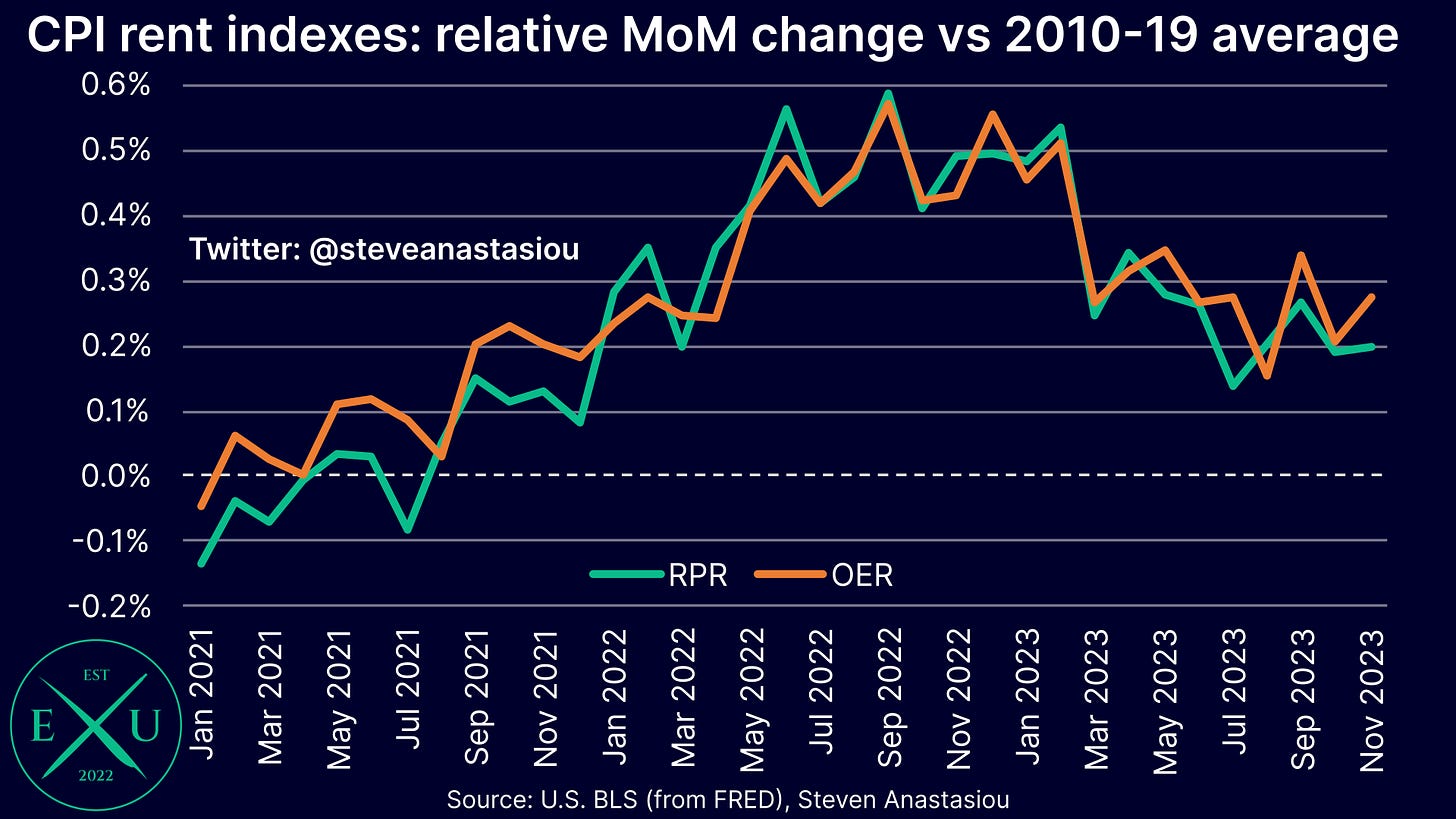
While many are eagerly awaiting a further material moderation in the CPI’s rent based categories of owners’ equivalent rent (OER) and rent of primary residence (RPR), I have continued to note that as opposed to an abrupt deceleration, it is instead likely to be gradual.
The reason for this, is that in addition to being lagging, the manner in which OER and RPR are calculated, also means that the two measures are smoothed in nature.
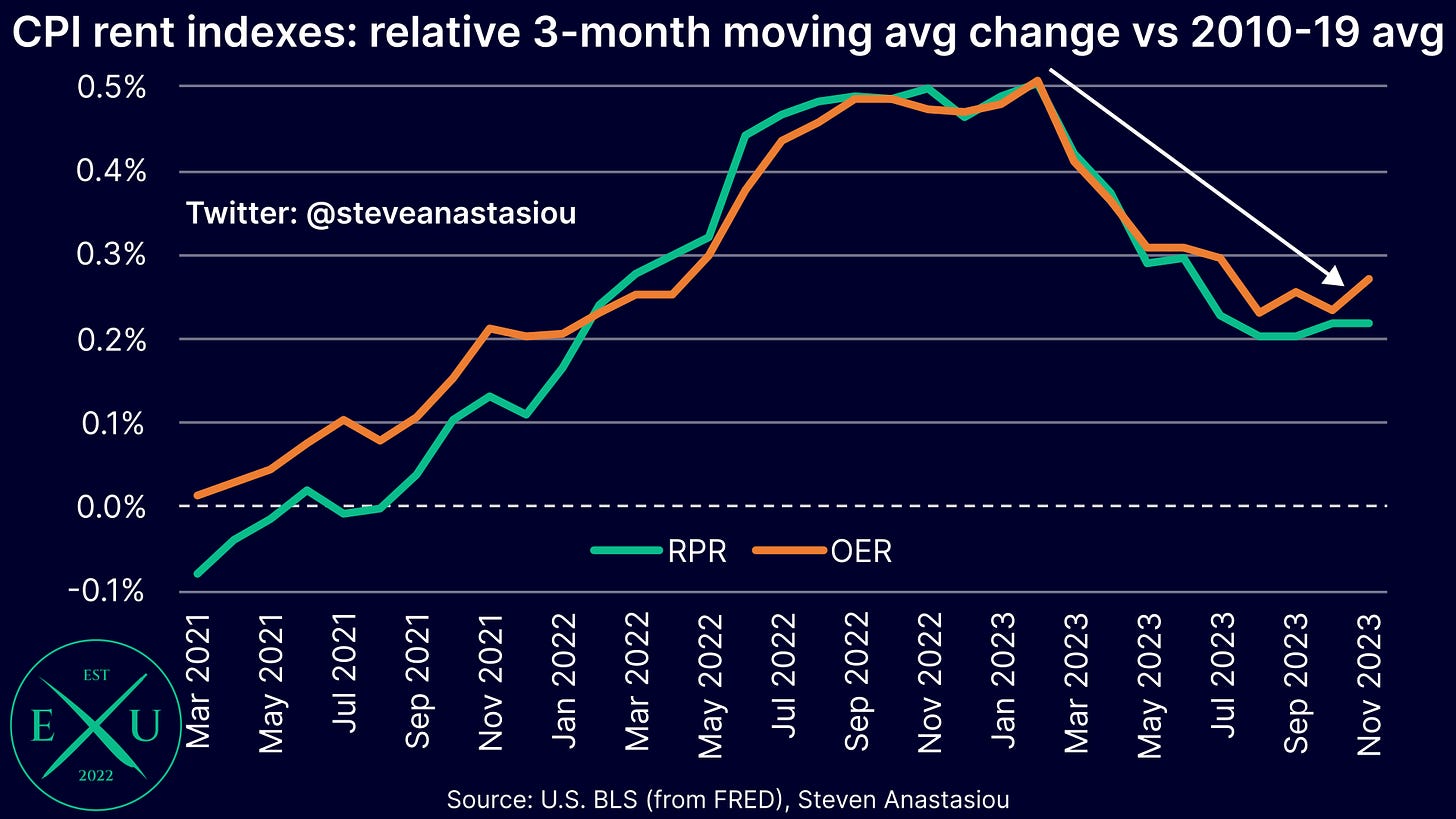
Further evidence of this phenomenon was seen in November, where in comparison to the respective historical (2010-19) monthly average, MoM growth was again largely in-line with rates seen over recent months.
On a 3-month moving average basis, a gradual downtrend can be more clearly seen. While OER saw a noticeable uptick in its relative 3-month average growth in November, I expect this to largely reverse in December, as the relatively larger increase in September falls out of the 3-month moving average.
Given the smoothed nature of these indices, and in light of recent trends, I currently expect MoM growth for OER and RPR to remain above their respective historical averages across 1H24.
Several services categories show strengthening disinflationary trends in November
In my CPI Preview for November, I noted the potential for some services categories to establish more clearly pronounced disinflationary trends — importantly, material additional evidence was observed.
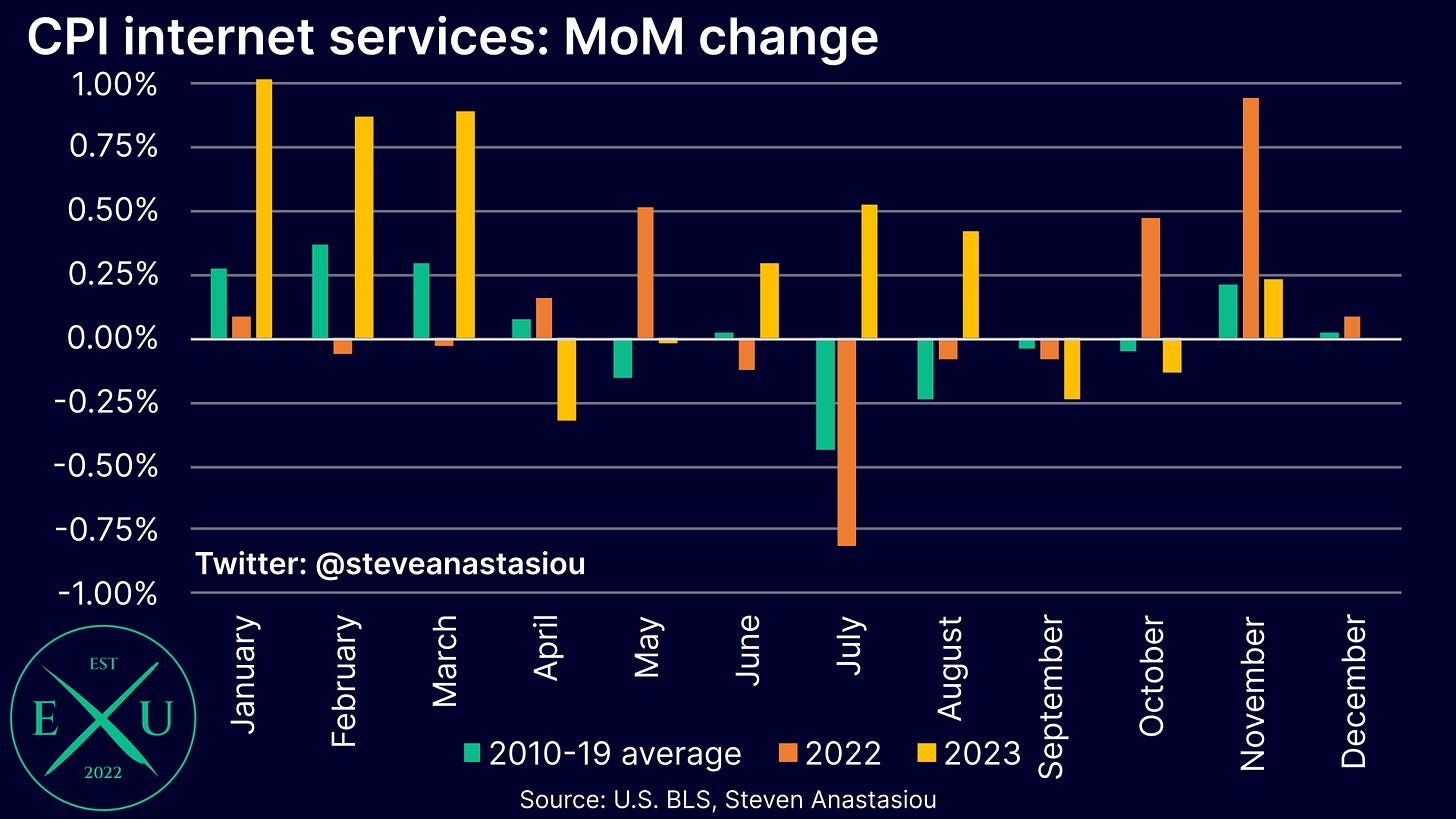
Following two consecutive months of relatively lower price growth versus the historical average, MoM growth in internet services prices was broadly in-line with the historical average in November.
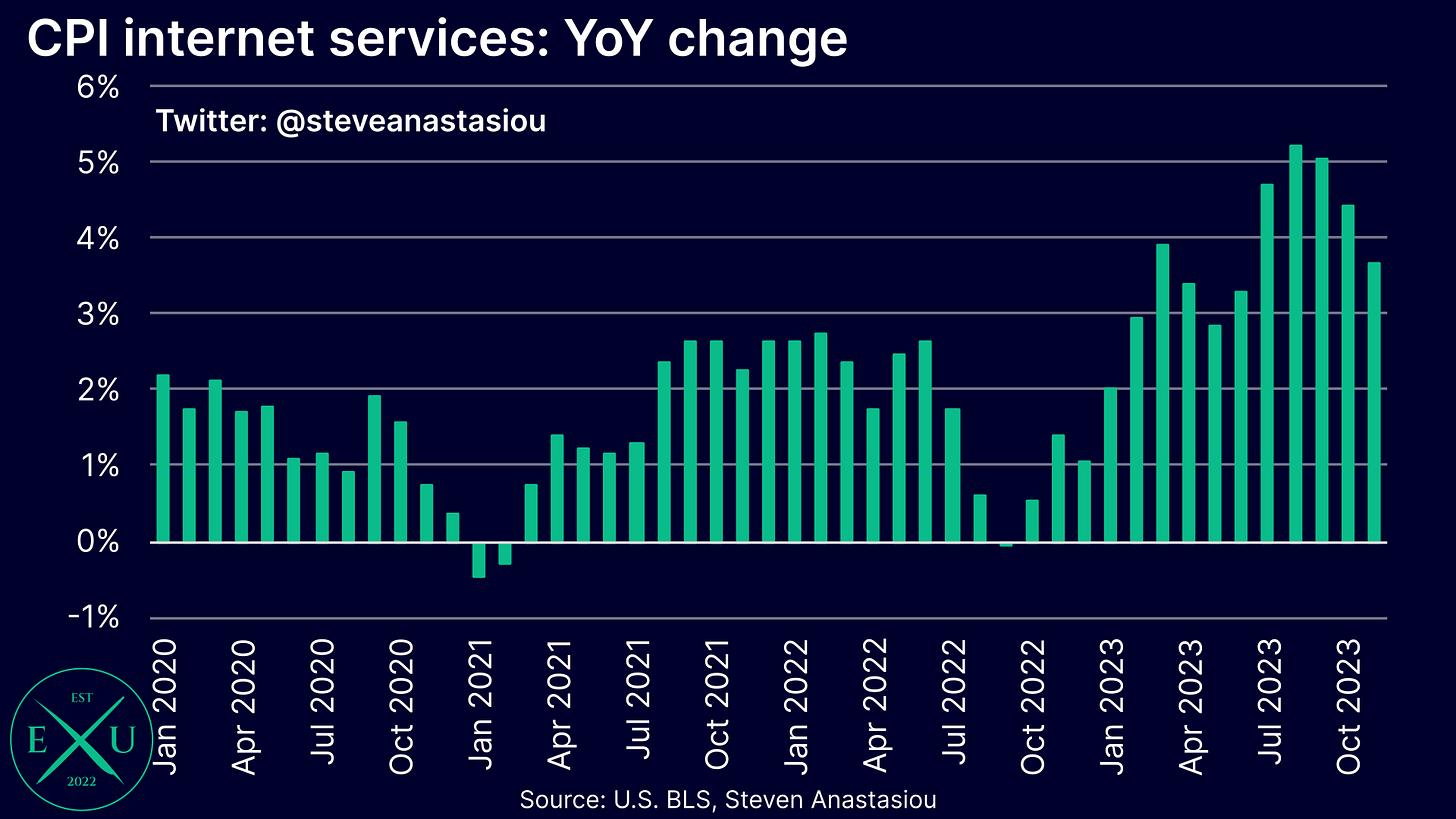
With three consecutive months of negative/average MoM growth, a significant disinflationary trend has now been established. This has taken YoY growth from a peak of 5.2% in August, to 3.7% in November.
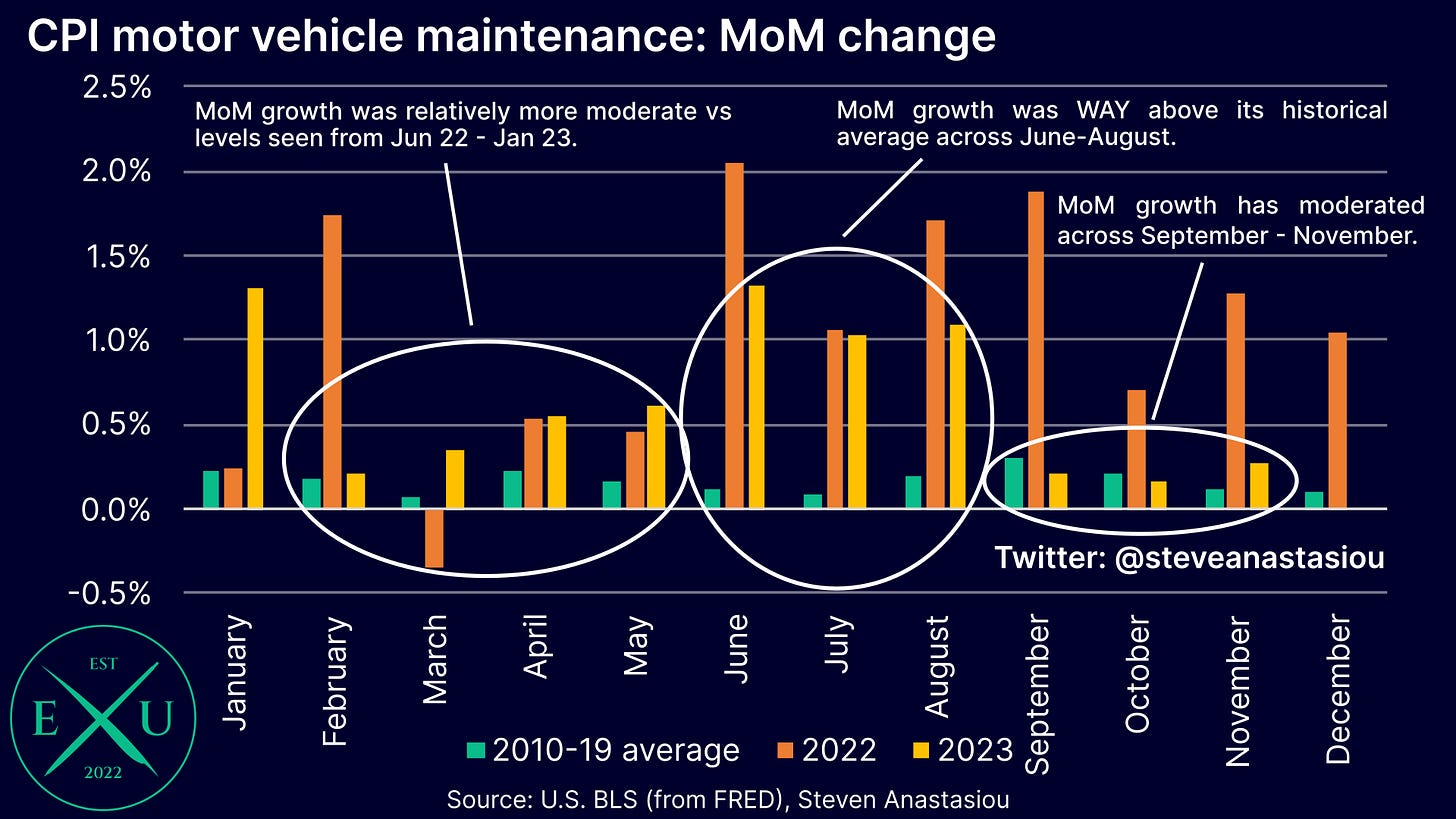
Turning now to the CPI motor vehicle maintenance category, where following two consecutive months of relatively lower MoM growth, monthly price growth was moderately above its 2010-19 average in November.
While growth was moderately above its historical average (0.16%), it was much less so than the often very high MoM growth seen across June 2022 to August 2023.
The last three months have thus established a notable disinflationary trend, but not yet to an extent that suggests that price growth has fully reached its historical average.
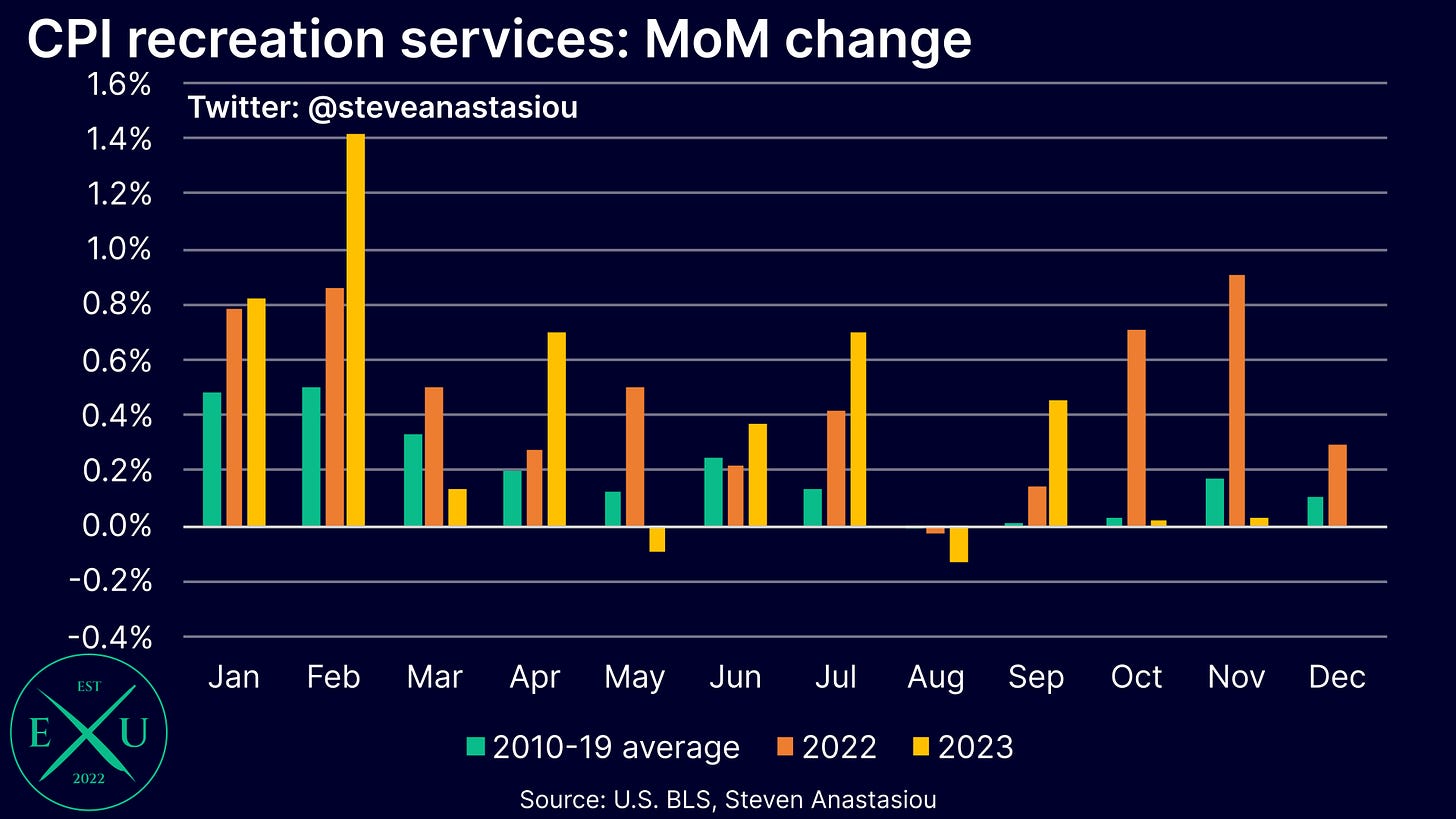
For a second consecutive month, and for the third time in the past four months, recreation services prices saw MoM growth that was below its historical average. This is suggestive of a significant deceleration in price growth, with YoY growth falling from 6.4% in September, to 4.8% in November.
Several other services categories show positive signs in November, leading to a second consecutive month of relatively more moderate growth
In addition to the services categories which are showing more clearly established disinflationary trends, some additional categories provided some positive signs in November.
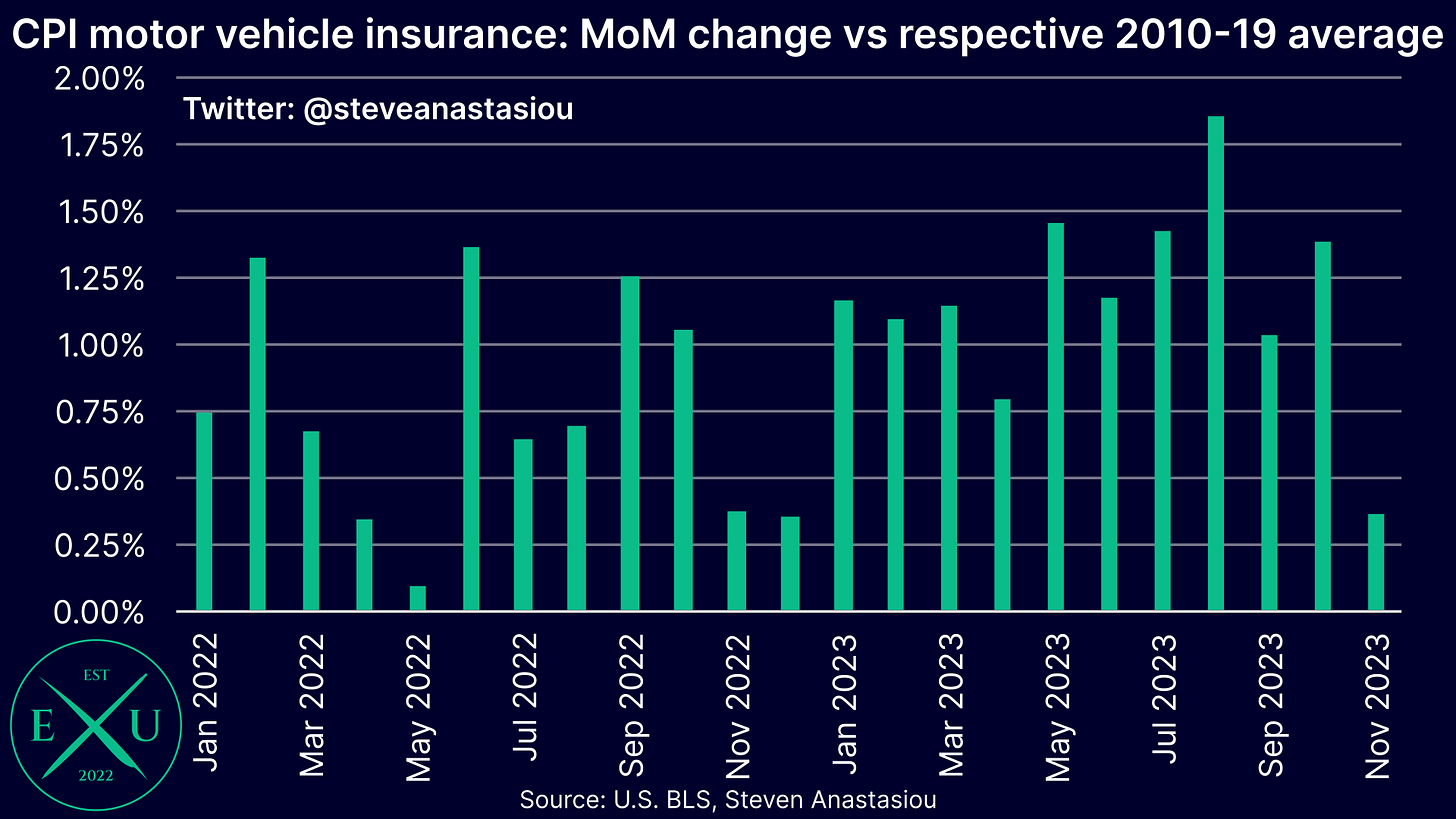
One such category was CPI motor vehicle insurance, which saw MoM growth that was 0.36% above its 2010-19 average for November — a major deceleration from an average of 1.4% over the prior six months.
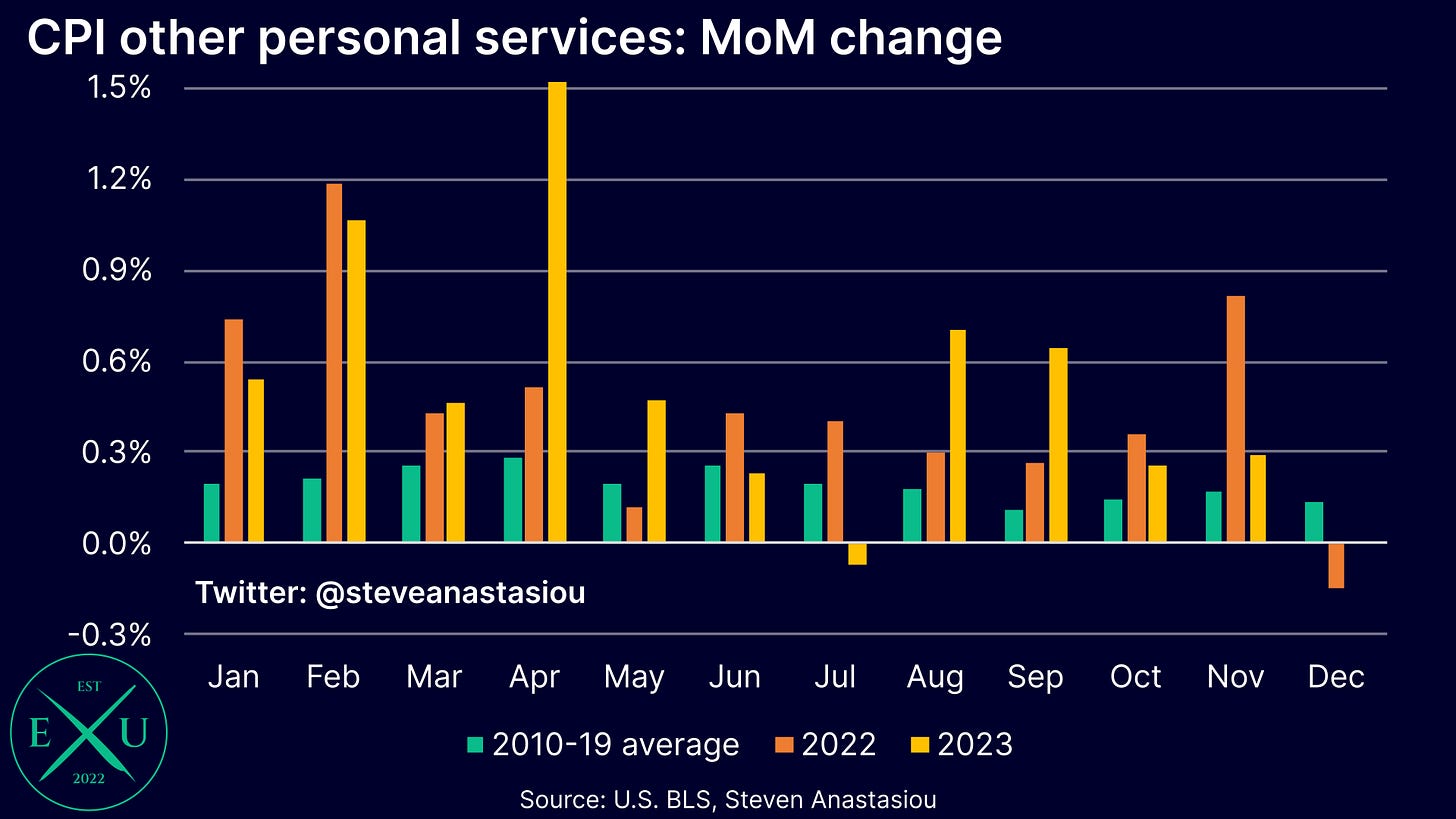
While still seeing MoM growth that is above its historical average, for a second consecutive month, the CPI other personal services category saw much more moderate growth than has been seen across much of 2022-23.
Looking at services prices as a whole, one can see a material deceleration in growth over the past two months.
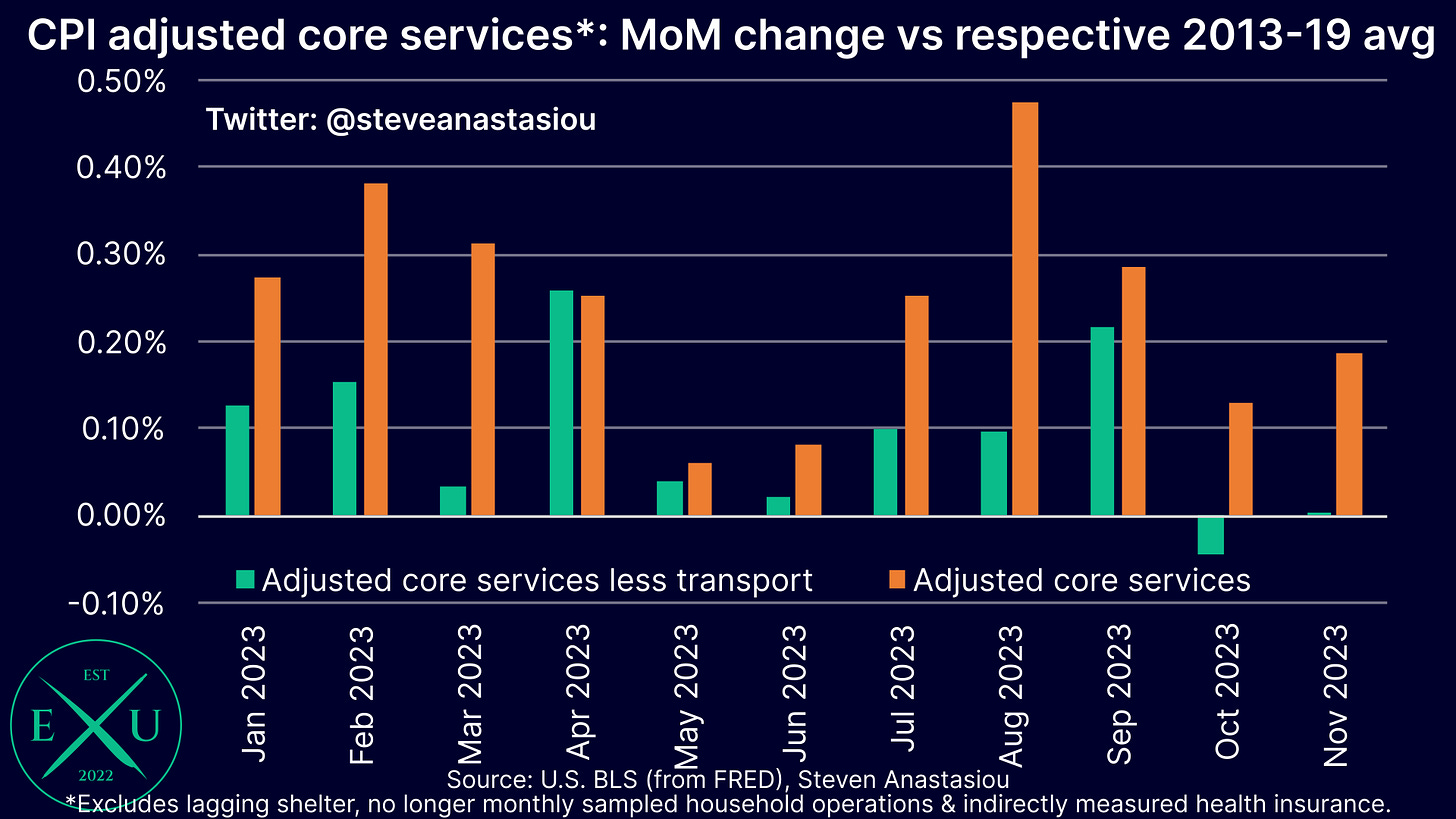
In order to assess underlying services price trends, I adjust the CPI’s core services index to exclude lagging shelter, inconsistently measured household operations, and indirectly measured health insurance.
On such a basis, MoM growth was an average of 0.16% above its respective 2013-19 average over the past two months, down from an average of 0.26% over the first nine months of 2023.
Though remembering that the very strong growth in automobile insurance is having an outsized impact on services price growth, it is also useful to look at adjusted core services prices excluding the transport component. Here, it can be seen that price growth has returned to its historical average over the past two months — in October, it was actually below its historical average.
With durables prices recording significant deflation, nondurables inflation just 0.7% YoY, and services categories showing deepening and spreading disinflation, the ongoing disinflationary trend is clear to see.
December flash forecasts: headline CPI expected to rise, but the core CPI expected to keep falling
In December, my provisional estimate is for a noticeable rise in the headline CPI to 3.3%, up from 3.1% in November.
As opposed to reflecting any underlying resurgence in inflation, this instead reflects the base effect of cycling a major decline in the CPI energy commodities index in December 2022, which recorded a MoM decline of 12.4%.
Turning to the core CPI, I currently forecast YoY growth to fall to 3.9%, down from 4.0% in November. This would result in the ninth consecutive monthly moderation in YoY growth, and would be the first time that growth has fallen below 4% since May 2021, which would mark another key disinflationary milestone.
Merry Christmas and thank you for following my work at Economics Uncovered during 2023.
I hope that I have been able to provide you with significant value, and that my in-depth coverage of inflation has been particularly useful.
In order to try and provide the best research offer possible, I am continuing to formulate new ideas and hope to provide even more value in 2024. One new publication that I intend to release in the near future, is a monthly US economic presentation, whilst I am also working on tweaking my in-depth quarterly updates — stay tuned!
In order to help support my independent economics research, please consider liking and sharing this post, and spreading the word about Economics Uncovered. Your support is greatly appreciated and goes a long way to helping make Economics Uncovered a sustainable long-term venture that can continue to provide you with valuable economic insights for years to come.
If you haven’t already subscribed to Economics Uncovered, subscribe below so that you don’t miss an update.




Thanks and merry Christmas 🎄