US CPI Review: July 2023
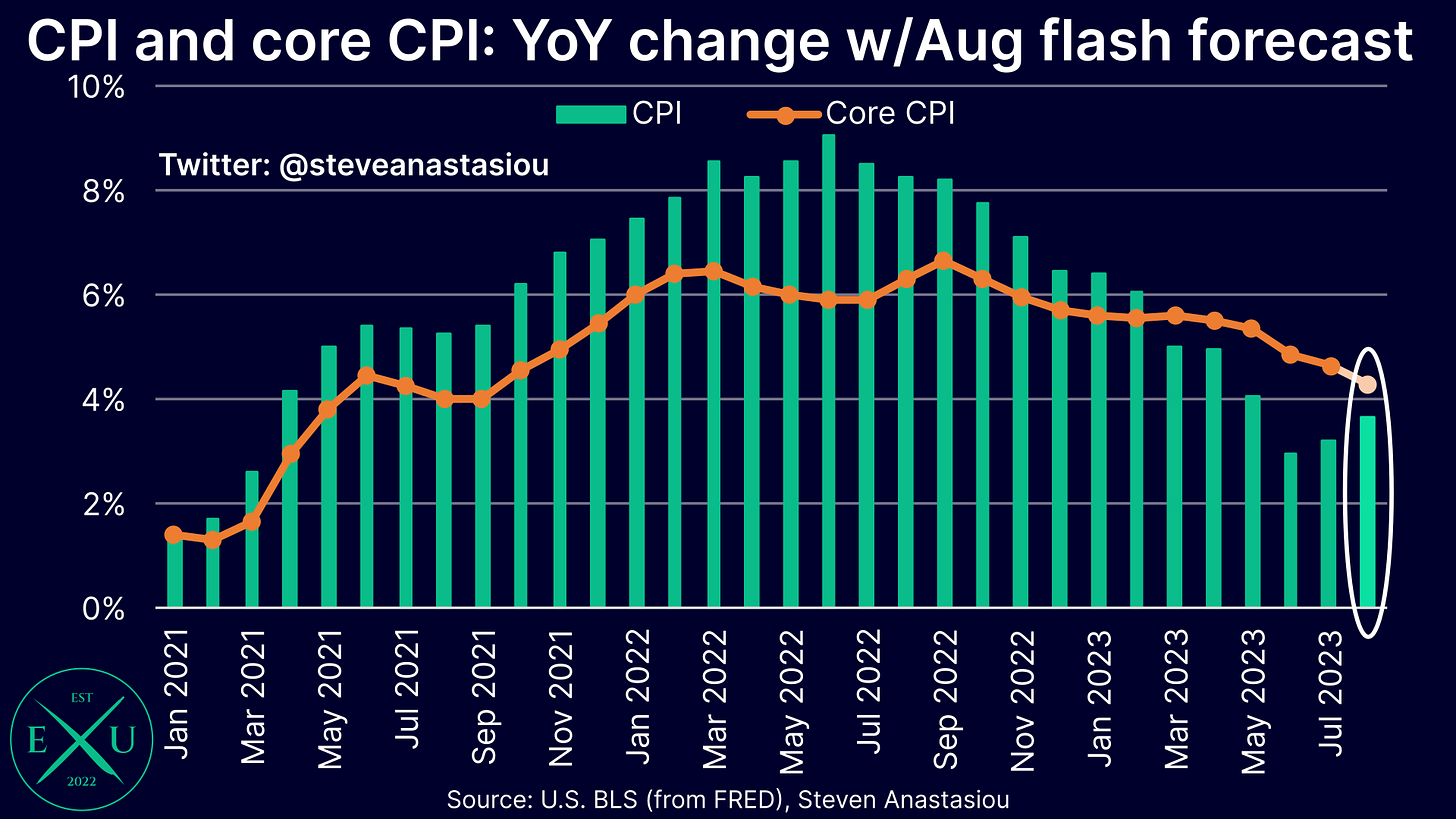
As expected, annual headline CPI inflation fell in July, while core CPI inflation moderated - I currently expect the same to occur in August.
Executive summary
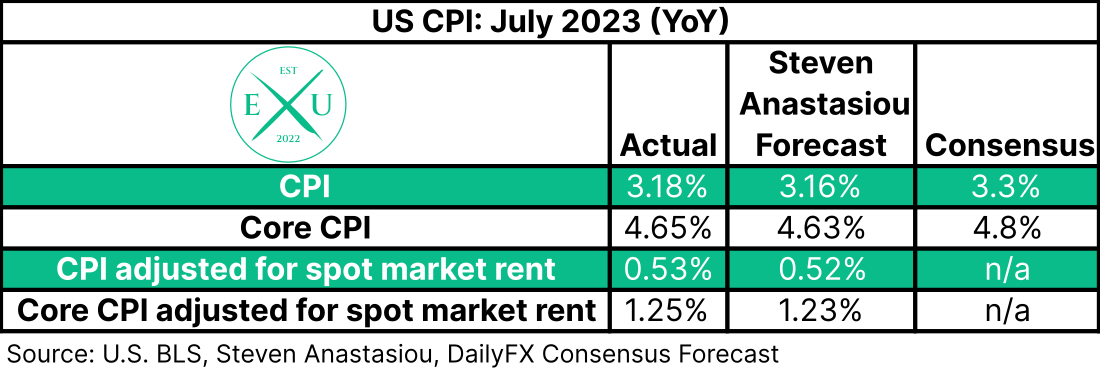
For the first time since June 2022, headline CPI inflation saw an increase in its annual growth rate, rising from 3.0% in June, to 3.2% (3.18%) in July.
Headline CPI: 3.2% (3.18%) vs my estimate of 3.2% (3.16%) vs consensus 3.3%
Meanwhile, core CPI growth moderated for the fourth consecutive month, falling from 4.8% in June, to 4.7% in July.
Core CPI: 4.7% (4.65%) vs my estimate of 4.6% (4.63%) vs consensus 4.8%
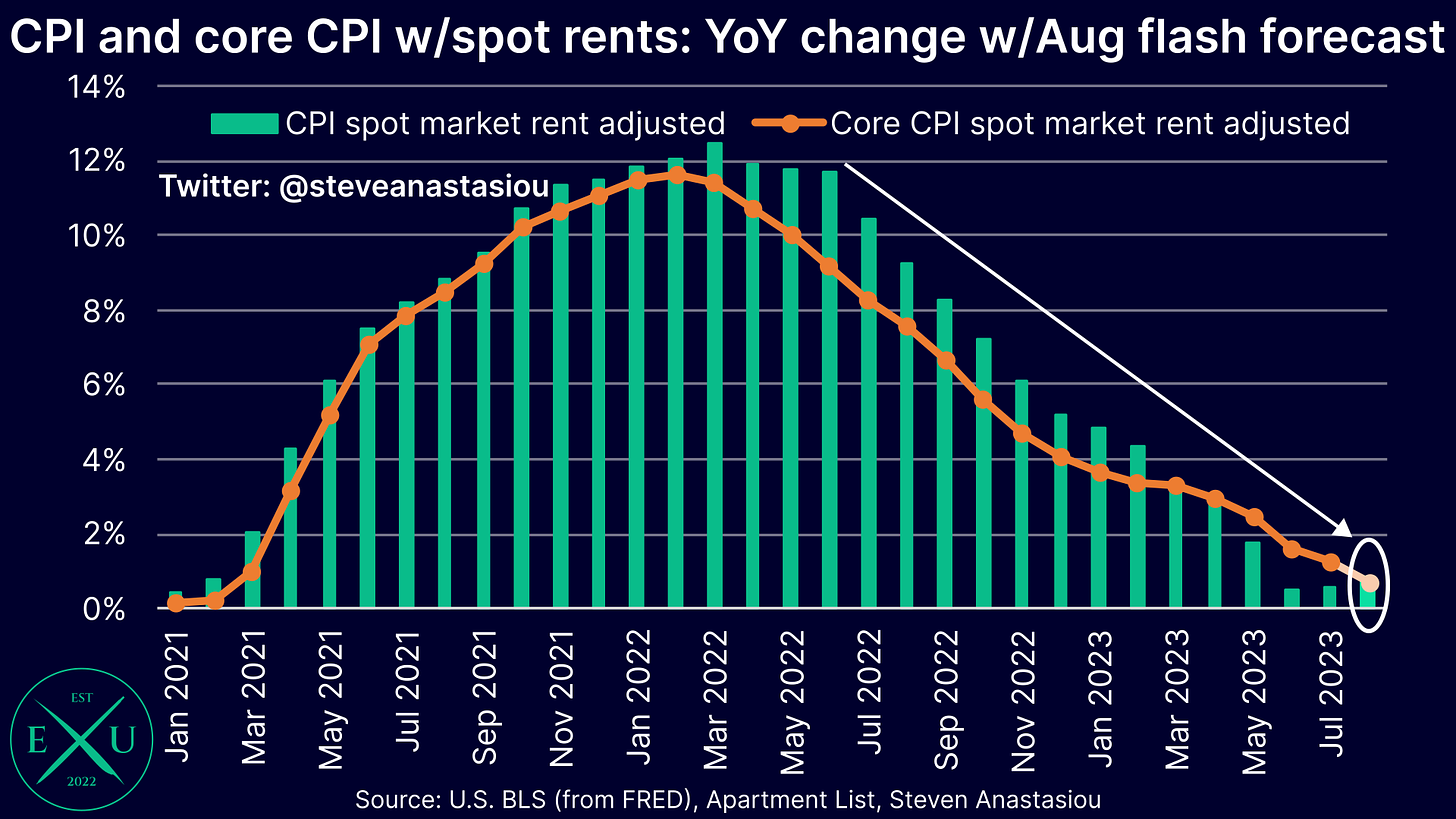
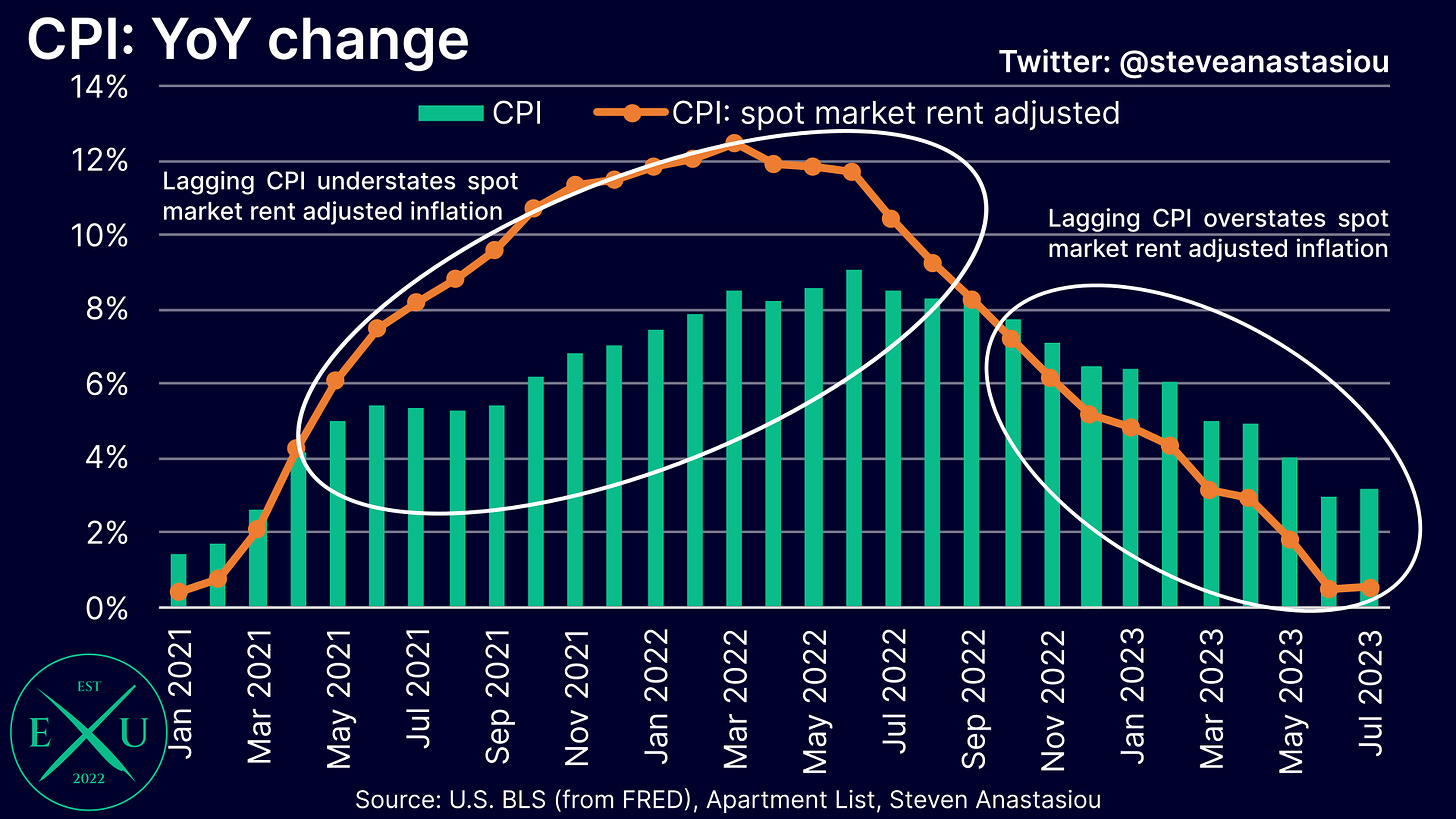
Once adjusted for spot market rents, both headline and core CPI inflation remained below 2% YoY:
CPI adjusted for spot market rents: 0.5% (0.53%) vs my 0.5% (0.52%) estimate
Core CPI adjusted for spot market rents: 1.3% (1.25%) vs my 1.2% (1.23%) estimate
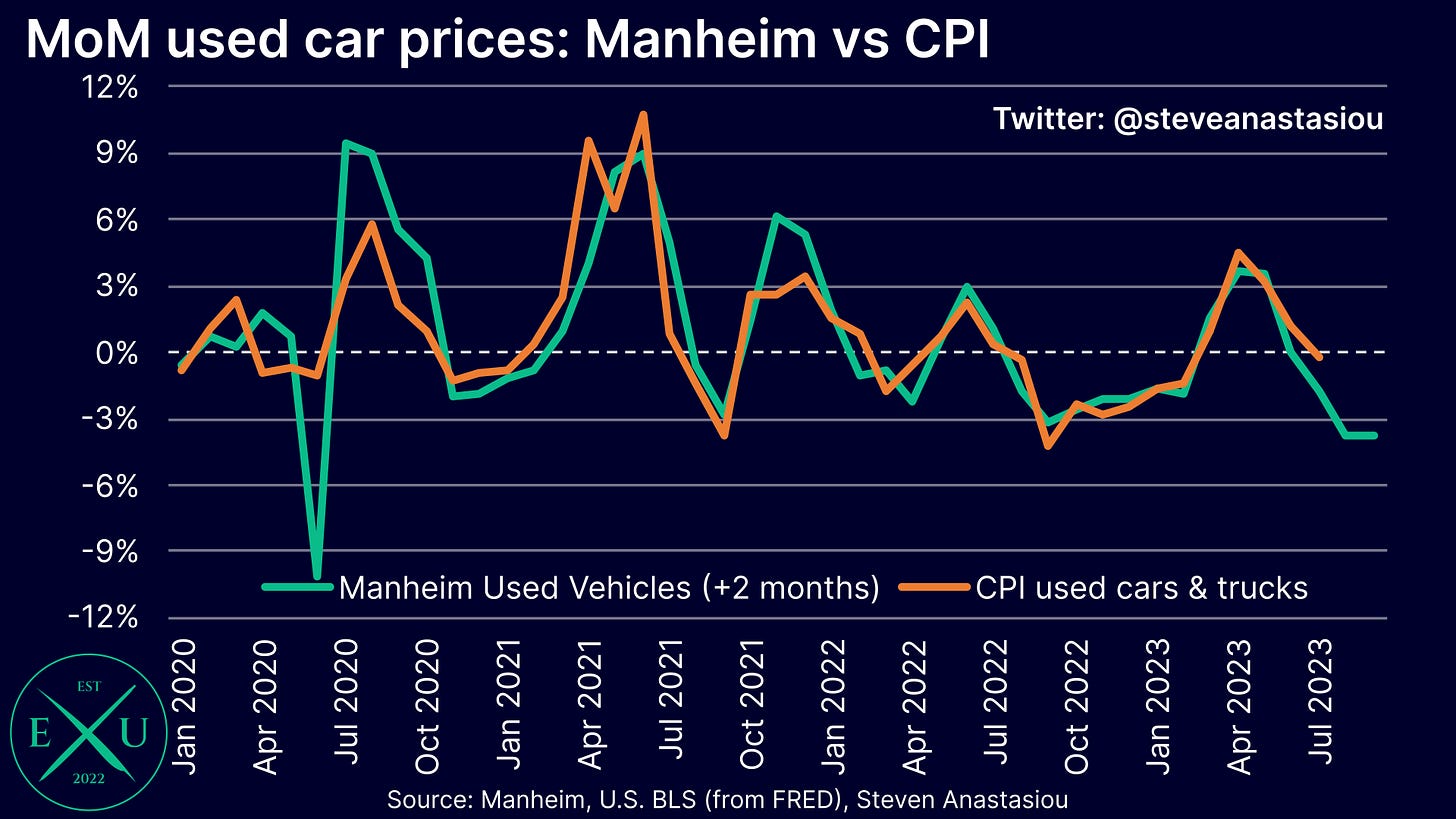
With wholesale used car prices (as per the Manheim Index) having recorded several months of significant declines, the CPI’s used car & truck price index recorded a MoM decline in July — but it was less than implied by the Manheim Index.
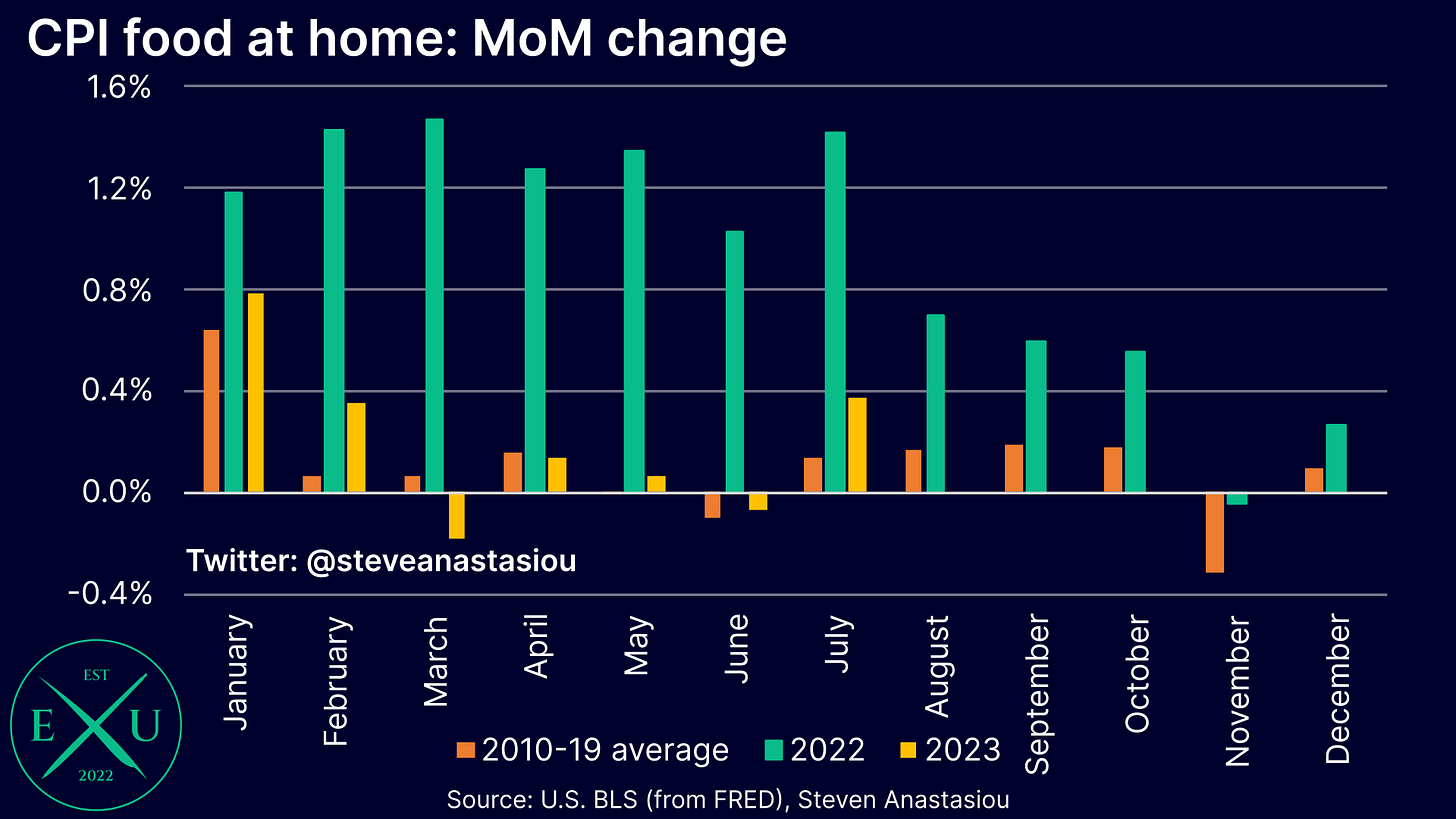
While CPI food at home prices saw an uptick in MoM growth, CPI food away from home prices saw a material moderation.
CPI energy commodities saw a relatively muted move in July — should gasoline prices remain around current levels, then the big jump higher will come in August.
While CPI owners’ equivalent rent didn’t record a material moderation in MoM growth, there was a noticeable move lower in CPI rent of primary residence — material additional moderation could lie ahead as spot market rents enter their seasonally weaker period.
Despite the moderation, the gap between spot market rents and the CPI’s rent based indexes remains extreme on an annual basis.
Looking at CPI services categories more broadly, there was a mixed picture of underlying price change momentum in July.
My flash US CPI estimates estimates for August are as follows:
Headline CPI: 3.7% YoY, from 3.2% in July
Core CPI: 4.3% YoY, from 4.7% in July
Headline CPI adjusted for spot market rents: 0.8% YoY, from 0.5% in July
Core CPI adjusted for spot market rents: 0.7% YoY, from 1.3% in July
CPI rises by 3.2% YoY and the core CPI by 4.7% — both are well below 2% on a spot market rent adjusted basis
In July, the CPI rose by 3.2% YoY, up from 3.0% in June. This compares to my estimate of 3.2%, and the consensus estimate of 3.3%.
Meanwhile, the core CPI rose by 4.7% YoY, down from 4.8% in June. This compares to my estimate of 4.6%, and the consensus estimate of 4.8%.
When looked at to two decimal places, my forecasts for July came in very close to the actual numbers, being within 2bps across all four aggregate categories.
Used car prices fall, but by less than expected
Given the significant declines that have been seen in wholesale used car prices over the past several months (as recorded by the Manheim Used Vehicle Value Index), I had anticipated a material fall in CPI used car and truck prices in July.
While CPI used car and truck prices did see a MoM decline (-0.2%), it was materially less than what a 2-month lag of the Manheim Index suggested (-1.7%).
Nevertheless, with wholesale used car prices recording even larger declines in June and July, I continue to expect that CPI used car and truck prices will see a material decline over the next two months.
Food at home ticks up, but food away from home sees a material moderation
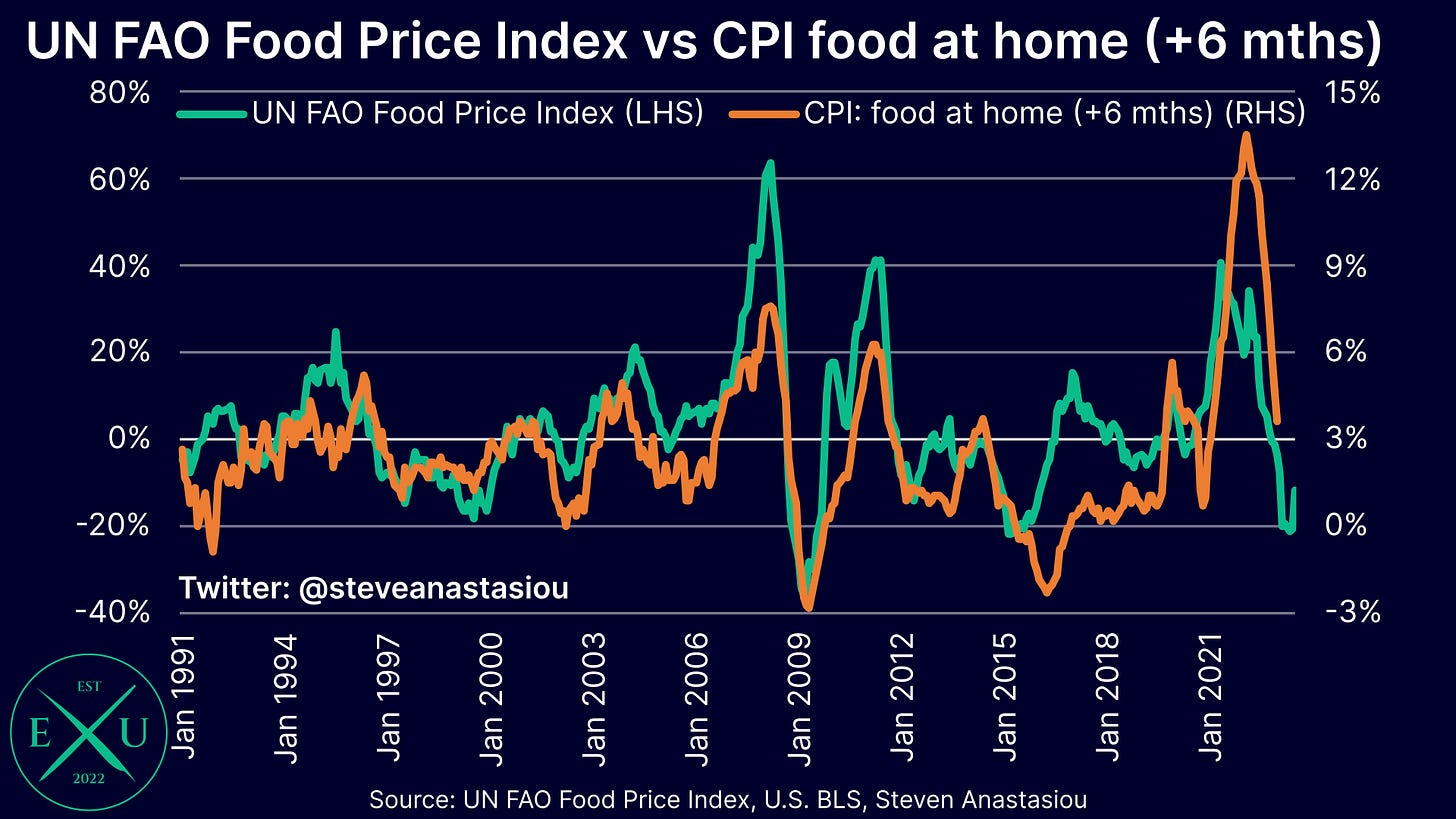
After seeing four months of much more moderate price growth, CPI food at home prices saw a relative increase in the pace of growth in July, whereby in comparison to the historical monthly average, prices rose by the fastest pace since February.
Nevertheless, with a high prior comparable being cycled, the annual growth rate saw a significant moderation, falling from 4.7% in June, to 3.6% in July.
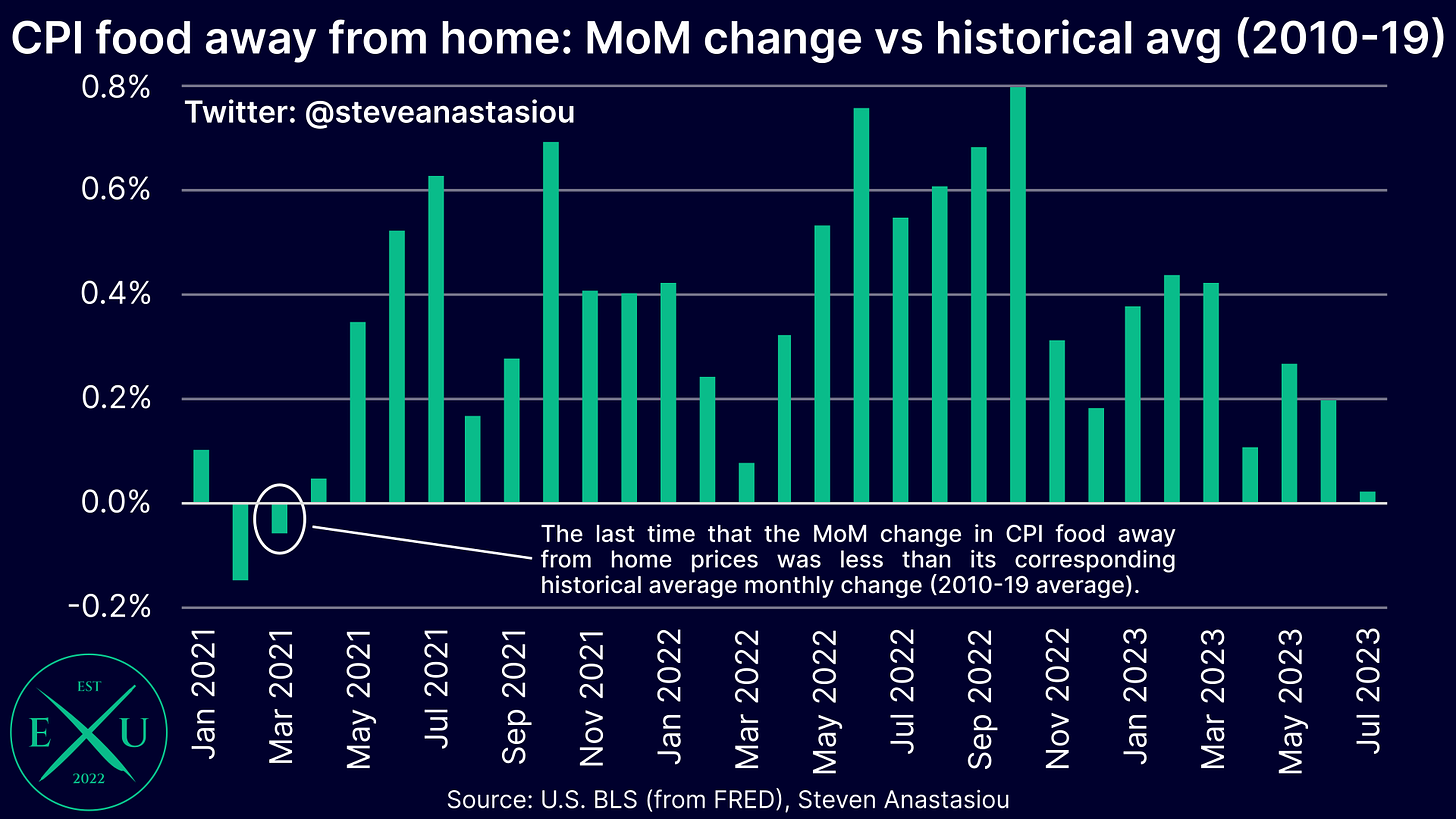
Meanwhile, food away from home prices, which are more exposed to lagging services price pressures, saw a material moderation in price growth in July, with MoM price growth just 0.02% above its historical (2010-19) average for July. This was the smallest positive variance that has been seen since the negative variance that was recorded in March 2021.
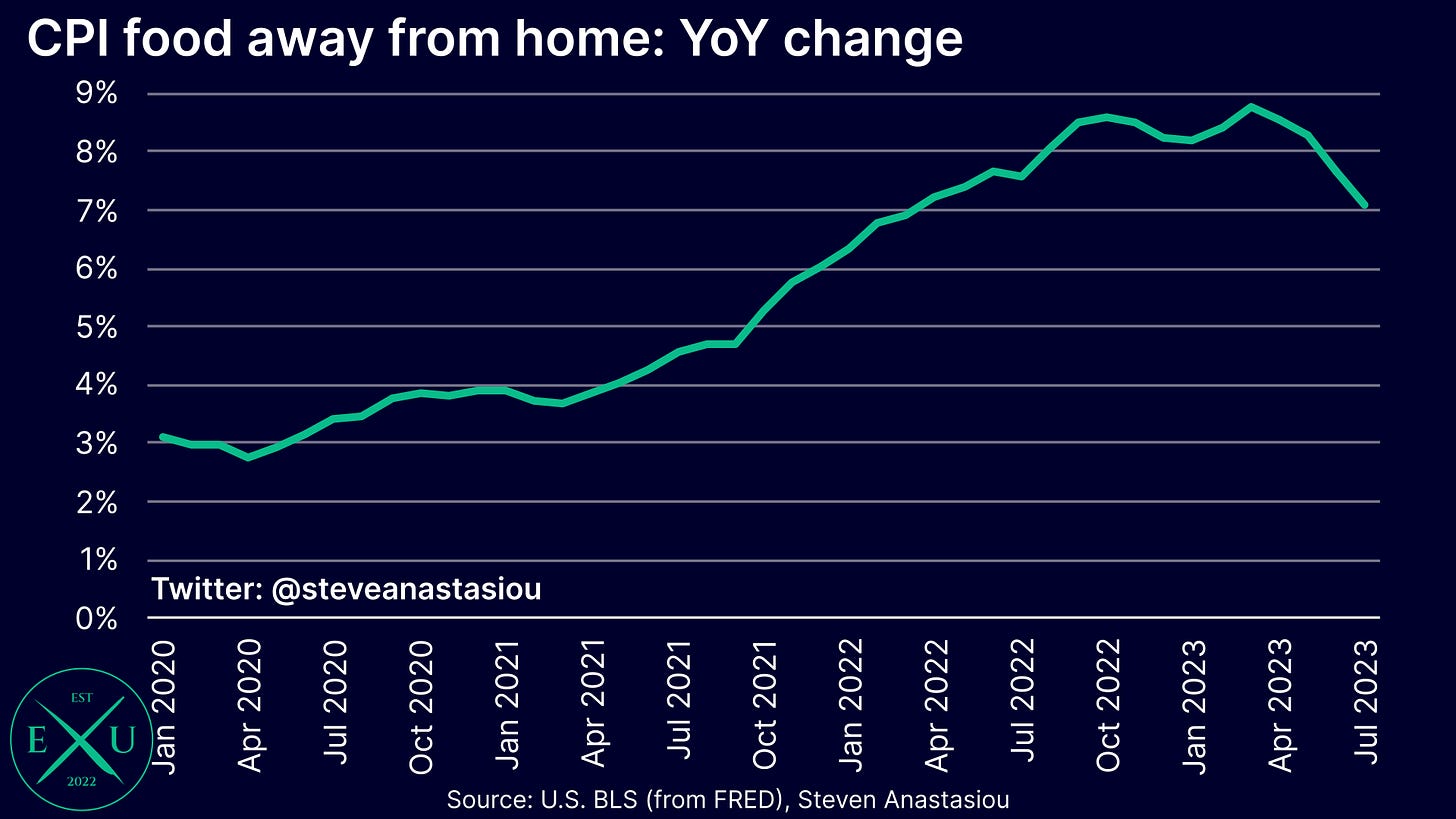
With CPI food away from home prices also cycling a high prior comparable, this saw annual price growth fall from 7.7% in June, to 7.1% in July.
Energy commodities see a relatively muted move, August could see a big jump
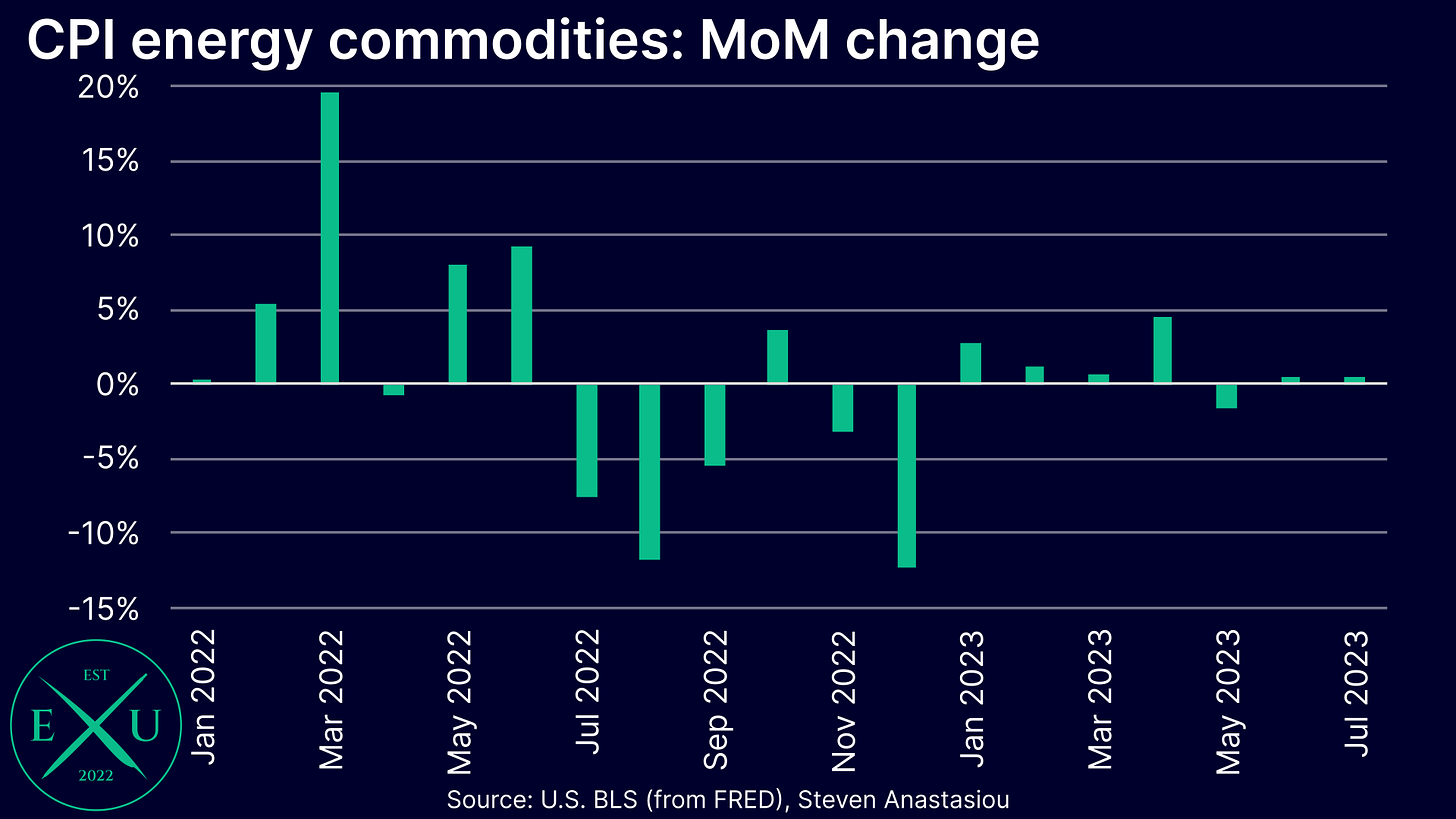
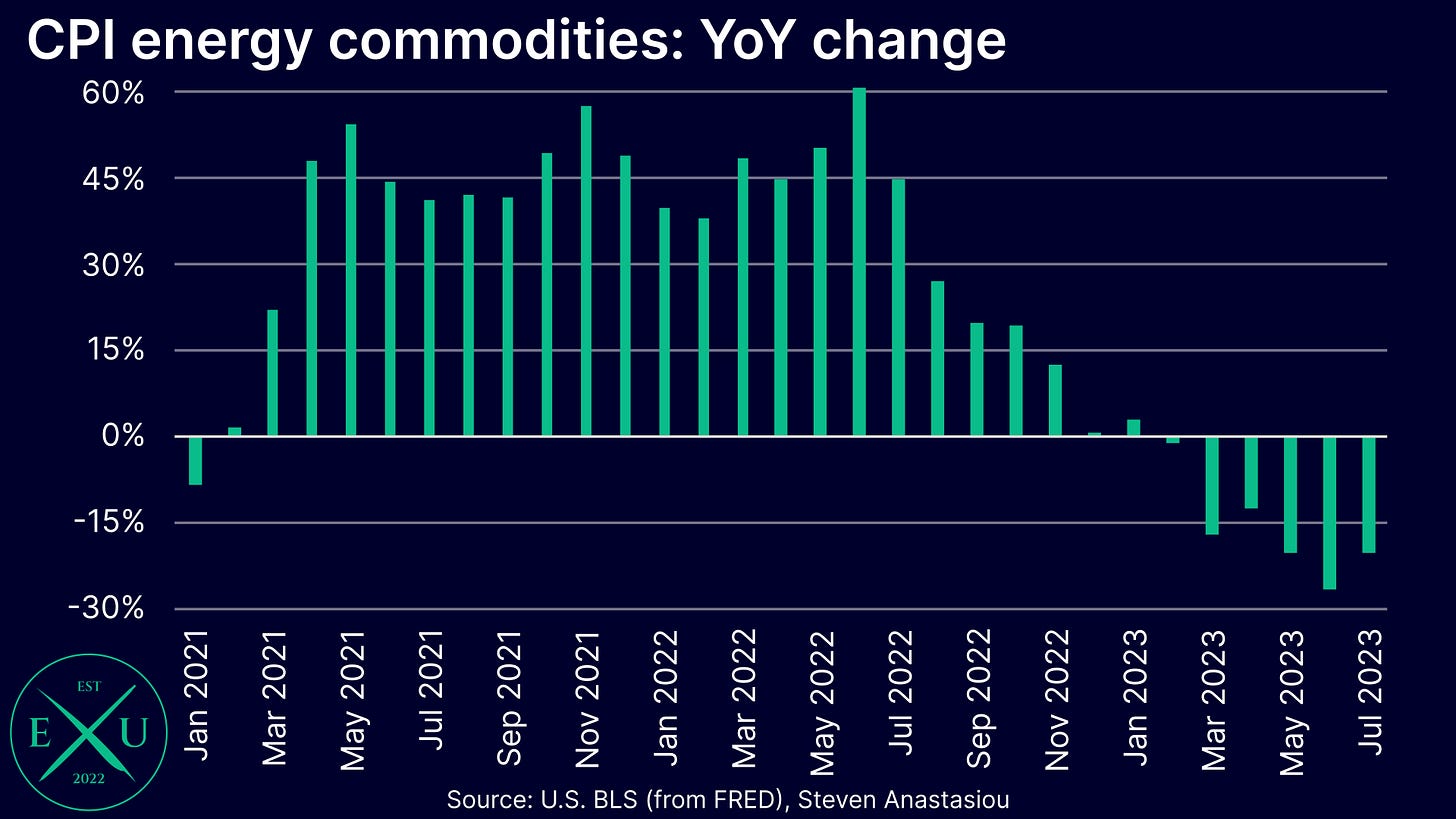
While significant attention has been paid to the recent increase in oil prices, the CPI energy commodities index saw a relatively modest increase in July, rising by 0.6% MoM.
This took the YoY change to -20.3%, from -26.8% in June.
Should gasoline prices remain around current levels for the remainder of the month, then there is likely to be a major MoM increase in the CPI energy commodities index in August’s CPI report.
CPI’s lagging rental components show some moderation
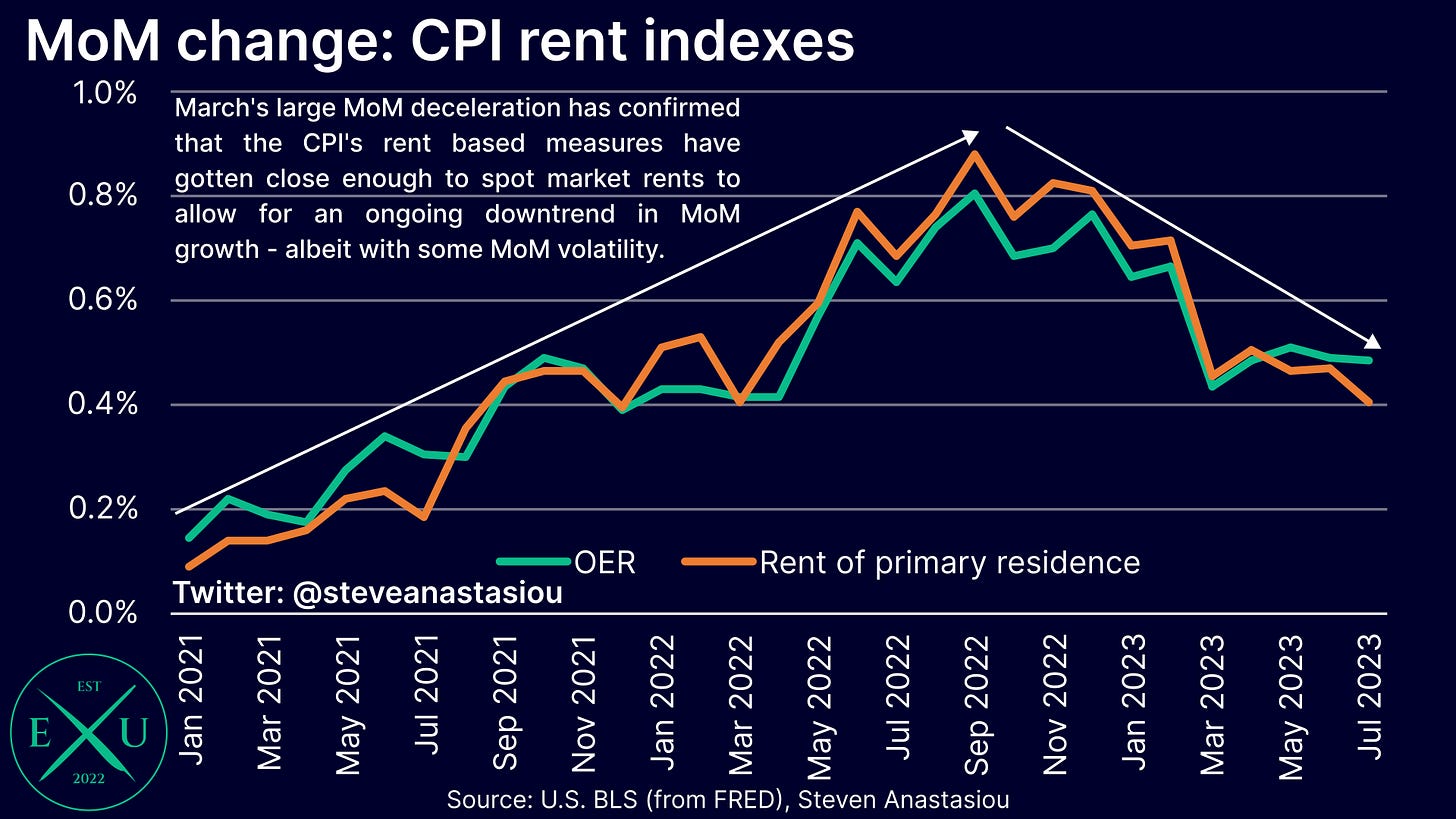
While owners’ equivalent rent didn’t record a material deceleration in MoM growth in July, there was a noticeable move lower in rent of primary residence, which saw MoM growth fall from 0.47% in June, to 0.41% in July.
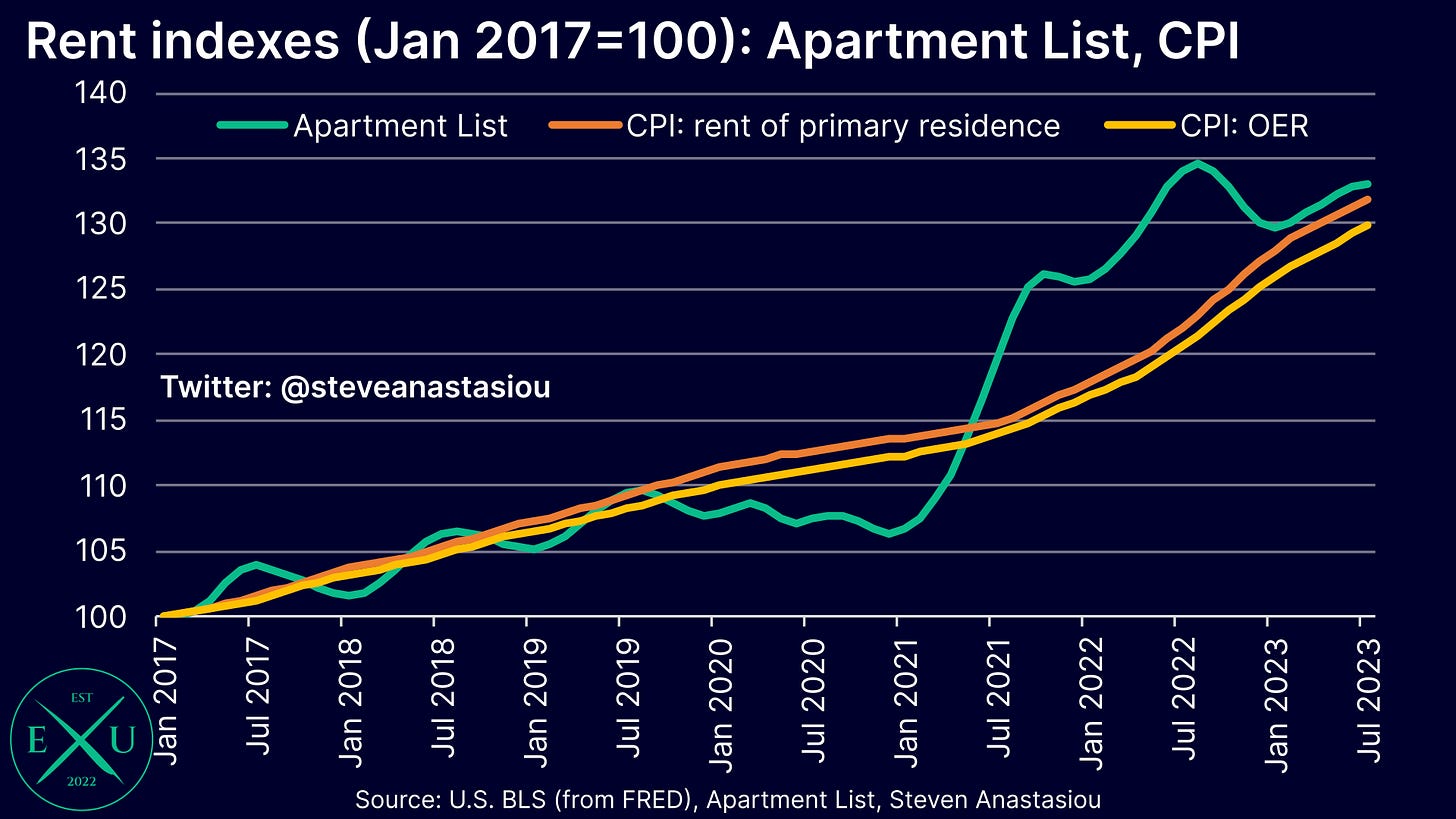
The ongoing gradual moderation in MoM growth rates comes as the bulk of the gap to spot market rents (as per Apartment List data), has now been bridged. Though note that for the same reason that the CPI’s rent based measures are lagging (the sample predominately consists of fixed lease agreements), they are smoothed in nature, meaning that the current deceleration is likely to remain relatively gradual.
While expected to be relatively gradual, the pace of the moderation could nevertheless quicken somewhat over the months ahead, as spot market rents enter their seasonally weaker period.
YoY gap between CPI’s rent based indexes and underlying spot market rents remains extreme
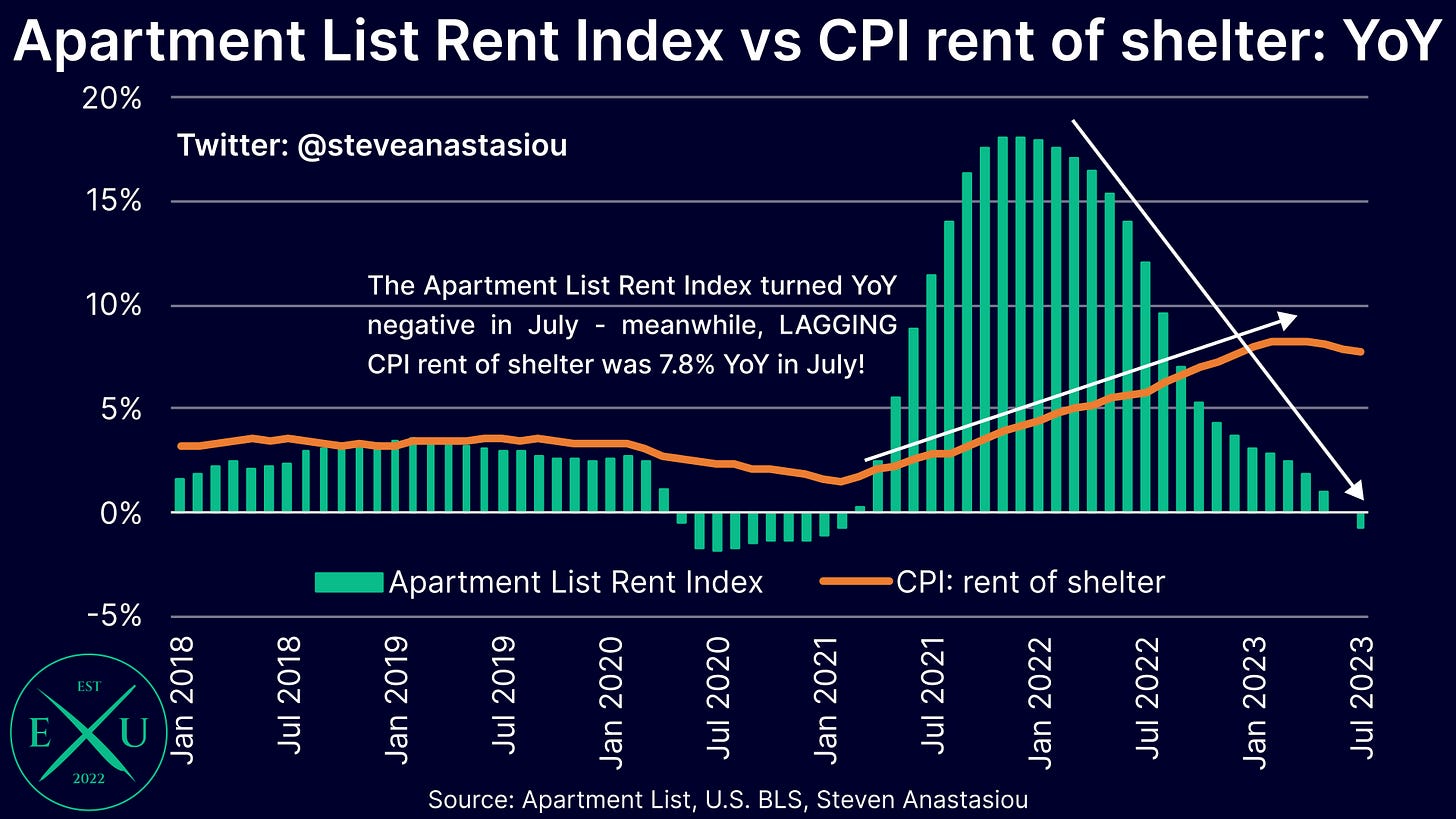
In terms of the current YoY growth rates, the divergence between the CPI’s lagging rent of shelter, and underlying spot market rents (as measured by Apartment List), remains extreme.
In July, CPI rent of shelter was up 7.8%, while the Apartment List Rent Index was DOWN 0.7% YoY. For this reason, it continues to remain extremely important that the CPI is also analysed on a spot market rent adjusted basis.
Postage services prices slump, but internet services prices jump higher
Within the CPI education & communication services category, there were two notable moves in July.
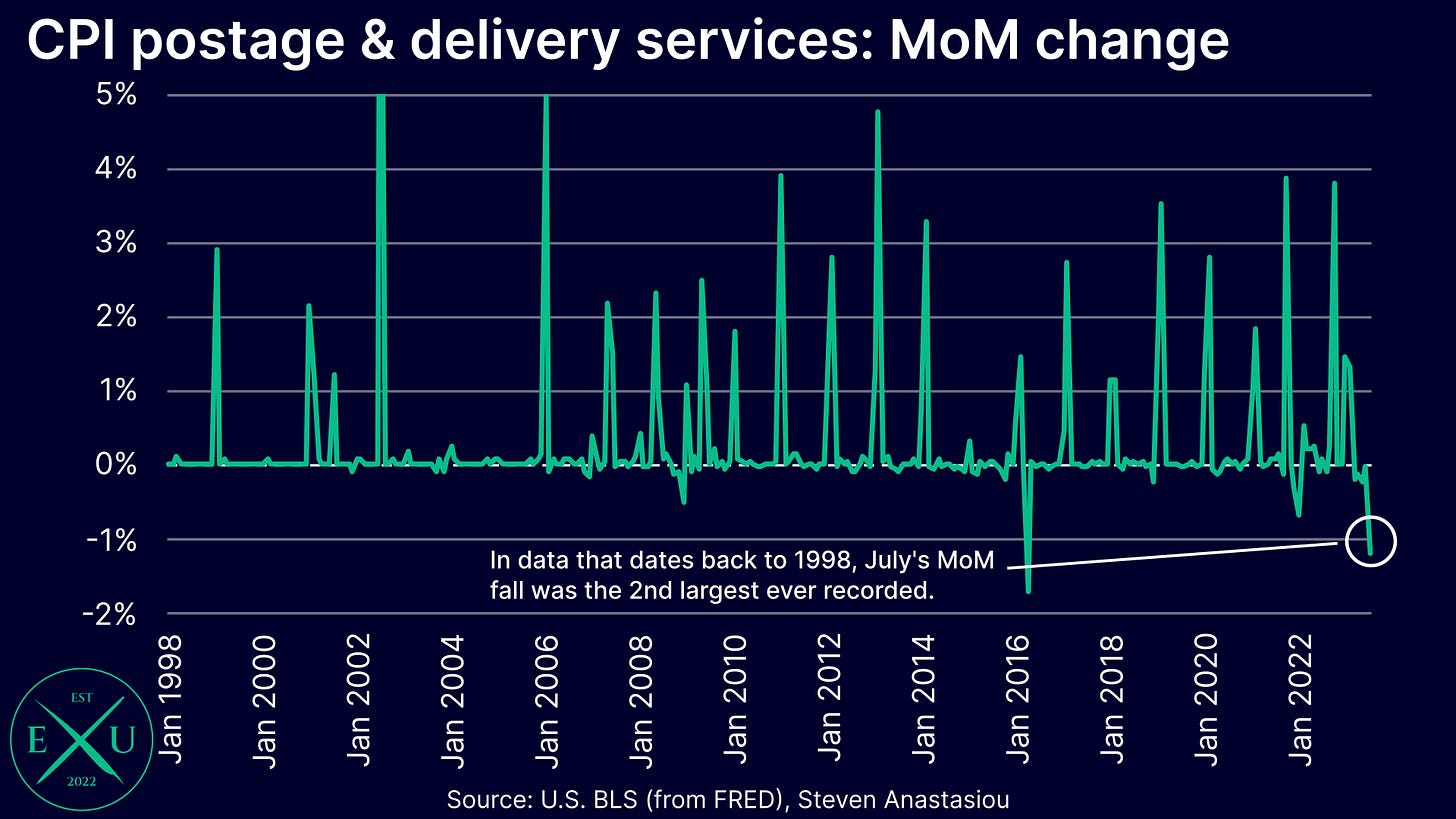
Firstly, postage and delivery services prices tumbled, recording a MoM fall of 1.2% in July. In data that dates back to 1998, this was the second largest MoM decline that has ever been recorded.
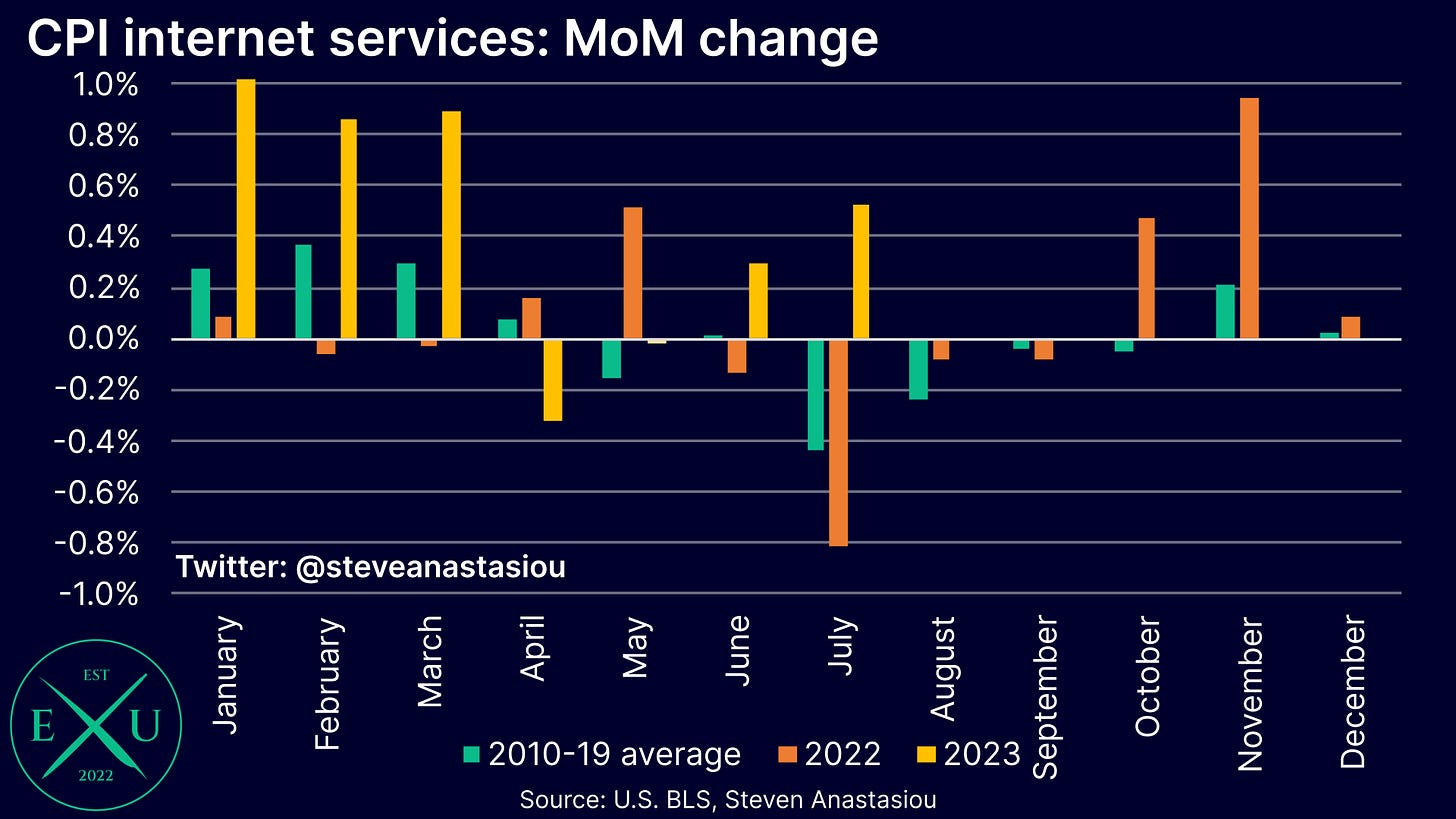
Though moving in the other direction, were internet services prices, which for the second consecutive month, saw MoM growth that was materially above the historical average — in July, MoM growth was 1.0% above its historical (2010-19) average.
While relatively lower MoM growth in April and May suggested that a trend of more moderate price growth could be emerging, this has been discounted by the last two month’s worth of data.
Taking 2023’s data in its totality, it is clear that the underlying price trend continues to be well above its historical average.
Motor vehicle maintenance jumps higher again, while motor vehicle insurance prices grow even faster
After seeing relatively more moderate price growth across February - May (suggesting that a relatively more moderate trend of price growth had taken place), motor vehicle maintenance prices have surged higher in June and July.
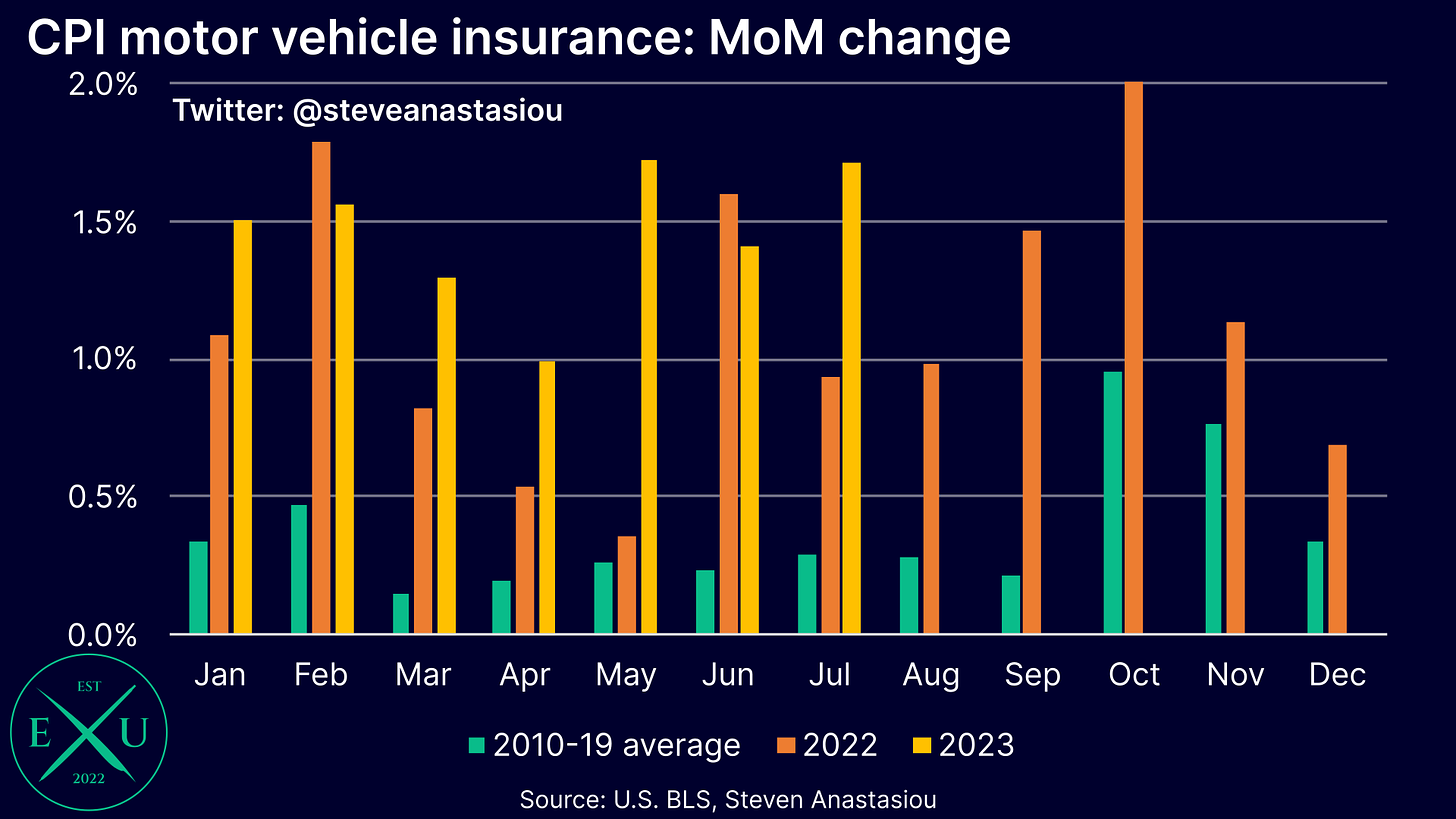
In addition to the resurgence in motor vehicle maintenance prices, the CPI motor vehicle insurance index continues to grow at an enormous pace, with YoY growth increasing to 17.8% in July, following another month of very strong price growth.
Clearly, both of these categories continue to see price growth that is far and away above historical averages, with each being key components that are keeping overall adjusted core services prices more elevated than usual.
Airline fares plunge 9.3%, but will the recent trend shift in light of higher jet fuel prices?
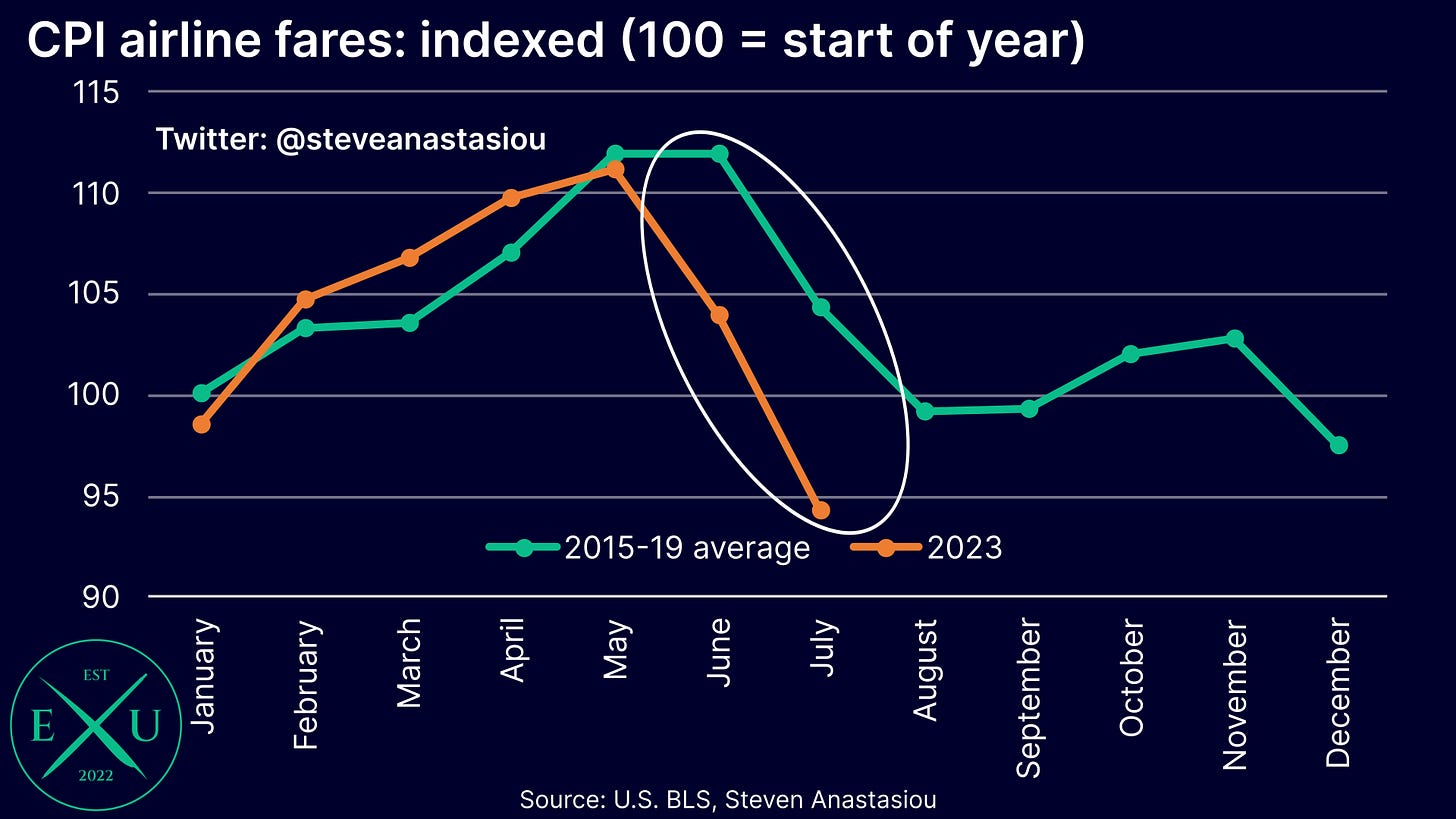
While motor vehicle maintenance and insurance prices contributed significant upward pressure on the CPI transportation services index, helping to pull the index in the other direction, were airline fares, which PLUNGED 9.3% MoM.
While airlines fares typically see large MoM declines in July, the 9.3% MoM fall was well above the average change for July that was seen across 2015-19. With airfares also seeing an unseasonably large decline in June, the decline in airfares to July has been much greater in 2023 vs the 2015-19 average.
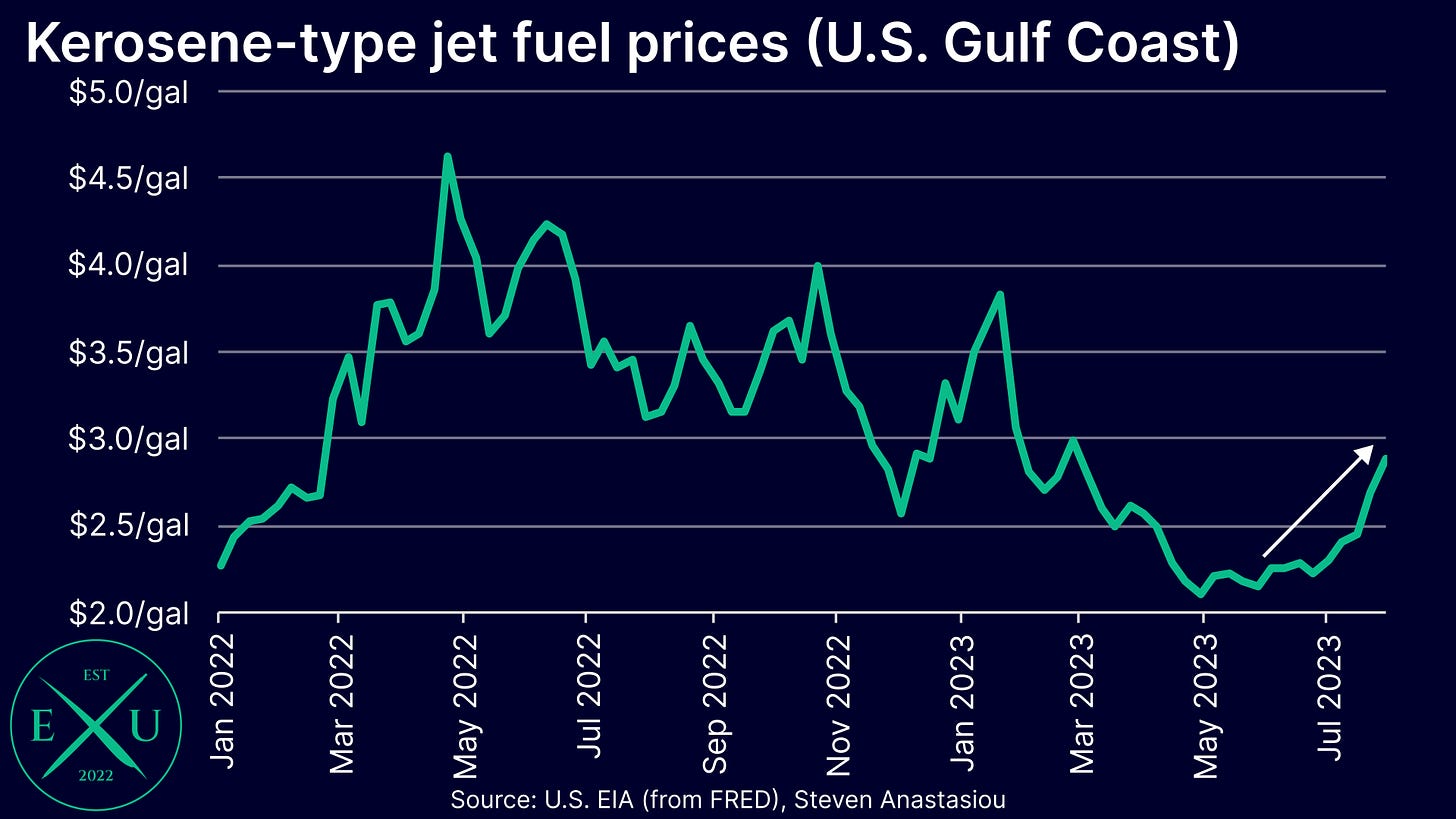
Though with the benefit of much lower jet fuel prices beginning to reverse in June, and jet fuel prices moving sharply higher in July and August, there’s the potential for price pressure to begin building to the upside — which could be reflected in August’s CPI report.
Recreation services prices jump, but other personal services prices fall
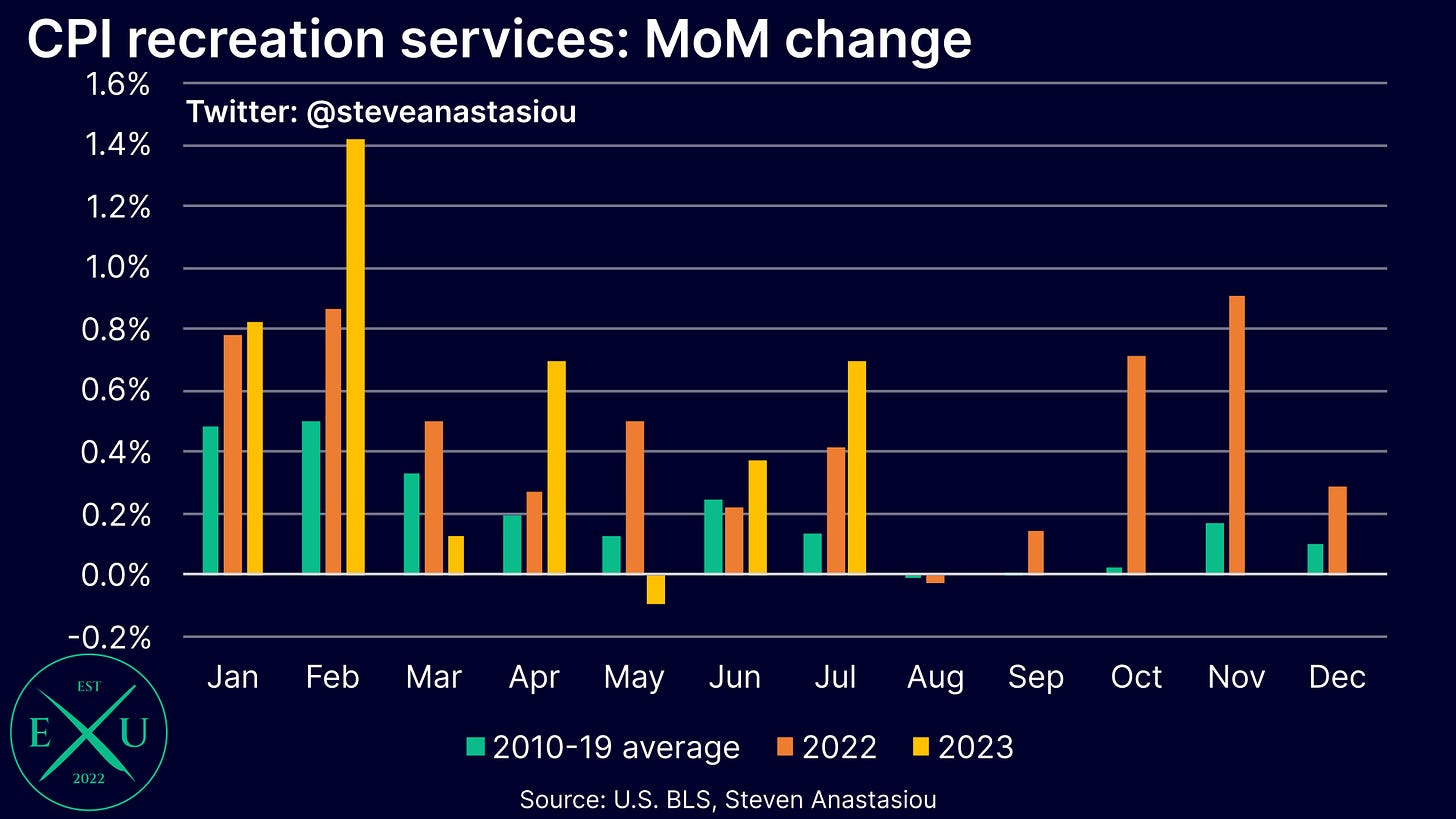
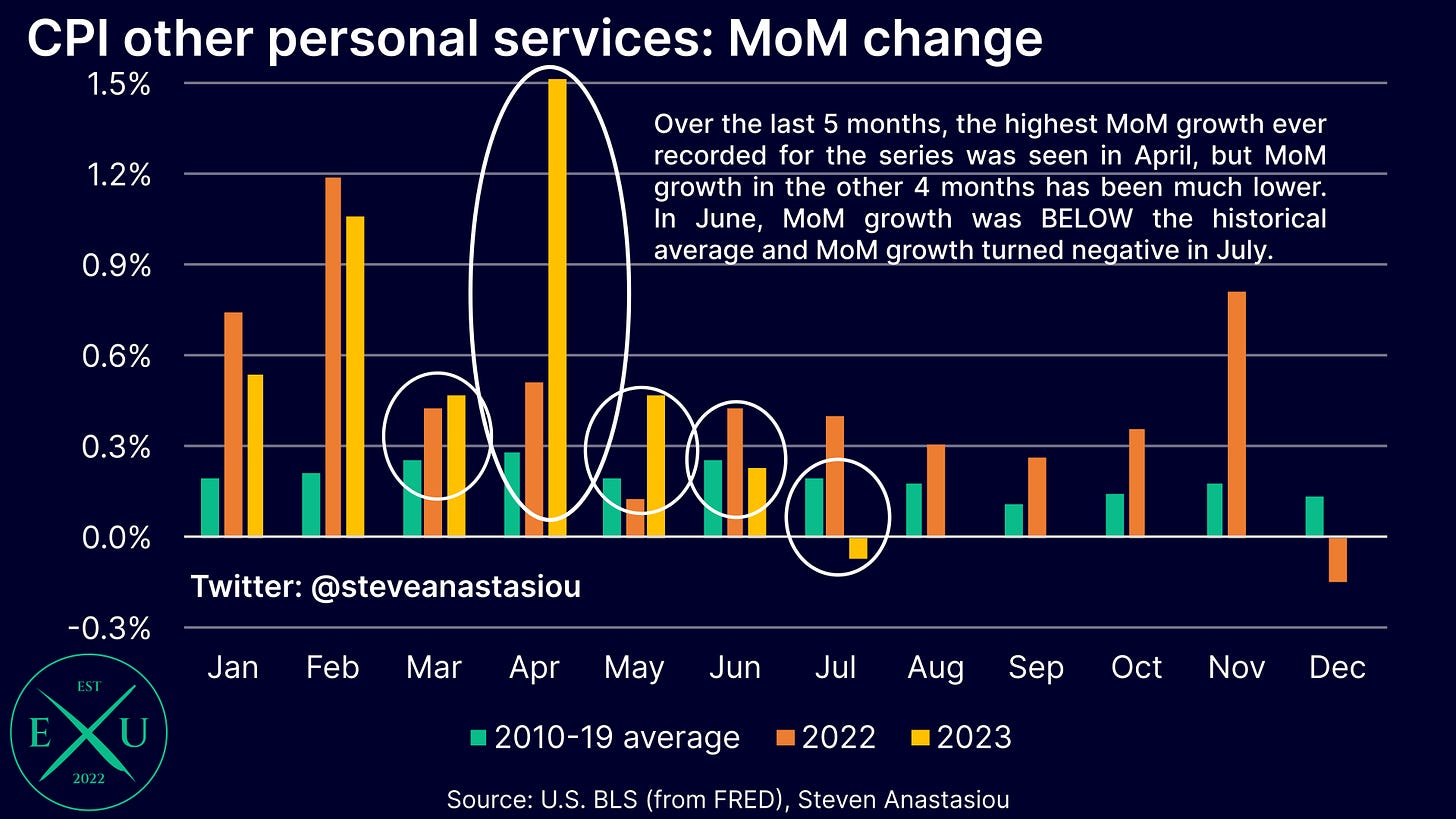
In my CPI Preview, I noted that in light of recent trends, CPI recreation services and CPI other personal services prices could show additional signs of disinflation in July.
Beginning firstly with CPI recreation services, instead of showing additional signs of disinflation, it recorded a much more pronounced rise in MoM growth, which was 0.6% above its historical average for July.
We are now again left with a rather unclear trend, with some months of high MoM growth spread amidst months of lower MoM growth.
In contrast to the rise in MoM growth that was seen for CPI recreation services prices, for the first time since December 2022, CPI other personal services recorded NEGATIVE MoM growth.
For the second consecutive month, monthly price growth was below its historical average, indicating a shift towards more moderate price growth.
Overall adjusted core services prices record MoM growth that materially above the historical average for July
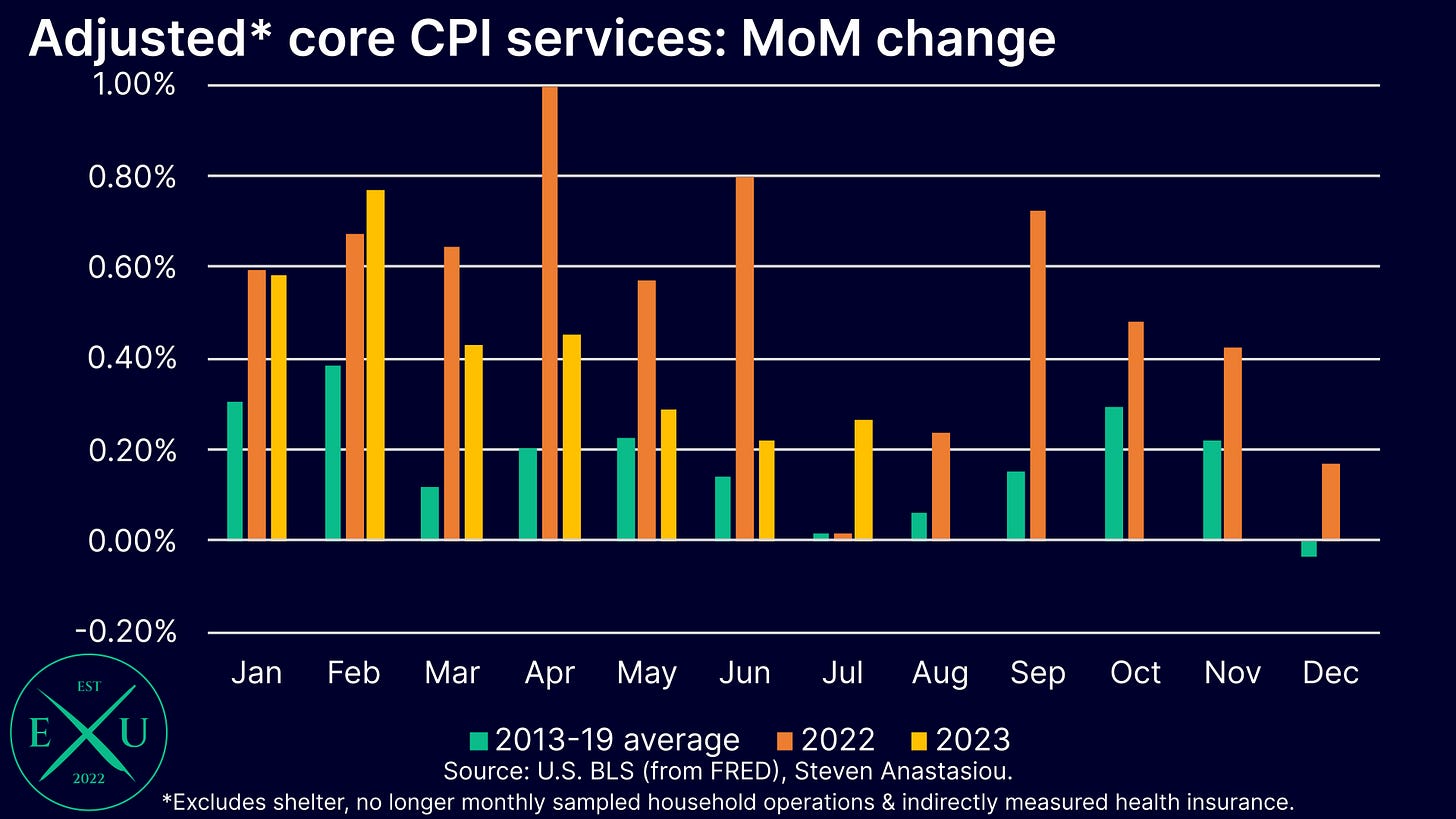
Looking at overall adjusted core services prices (i.e. excluding lagging shelter, the indirectly measured CPI health insurance component and the inconsistently measured CPI household operations), one can see that while MoM growth was relatively close to the levels seen in May and June, that it was well above the level that is typically seen in July.
Flash CPI estimates for August
Headline CPI expected to see a material rise, but core CPI expected to see a material fall
After reviewing July’s CPI data, my flash (i.e. provisional) CPI estimates for August show a significant increase in the annual growth rate of the headline CPI, but a significant moderation in the core CPI.
For the headline CPI, I currently expect an increase from 3.2% in July, to 3.7% in August.
For the core CPI, I currently expect the annual rate to fall to 4.3%, down from 4.7% in July. This would mark the fifth consecutive month of lower YoY growth for the core CPI.
Adjusted for spot market rents, both the headline & core CPI are expected to be <1% YoY
Given the enormous divergence between the CPI’s lagging rent based measures and underlying spot market rents, it continues to be vitally important that the CPI is adjusted for spot market rents.
On such a basis, I expect both headline and core CPI inflation to be below 1% YoY in August.
I currently expect the headline CPI adjusted for spot market rents to rise from 0.5% in July, to 0.8% in August.
For the core CPI, I currently expect a major decline from 1.3% in July, to just 0.7% in August. This would mark an astounding 18 consecutive months of falling YoY growth from the peak that was reached in February 2022.
Rising headline & falling core CPI inflation means that August’s CPI data is expected to pose the same question as July’s — will the Fed continue to focus on the core CPI?
With August’s CPI report expected to show the second consecutive month of rising headline CPI inflation, but a continued decline in core CPI inflation, as I wrote in my CPI Preview for July, a key question is whether the Fed will continue to remain focused on the core CPI, or if it will instead decide to alter its focus on account of rising headline inflation.
If the core CPI falls to 4.3% as expected, the effective federal funds rate would be 1.0% above core CPI inflation. Assuming that the Fed continues to remain focused on the core CPI, a positive real rate of 1.0% and a fifth consecutive monthly moderation in the annual growth rate of the core CPI, should provide the Fed with sufficient comfort to leave interest rates unchanged at its September meeting.
Meanwhile, spot market rent adjusted inflation data is telling the Fed that it’s going way overboard — not adjusting the data risks going from one extreme to another
Meanwhile, with both headline and core CPI inflation expected to be below 1% YoY on a spot market rent adjusted basis in August, this underlying measure of inflation is strongly suggesting that the Fed’s policy is far too tight.
Given the lagging nature of the CPI’s rent based components, by failing to adjust the CPI for spot market rents, the Fed risks pushing the US economy from one extreme (high inflation), to another (a deflationary bust).
For just as we knew that the surge in underlying spot market rental growth in 2021-22 would place significant upward pressure on the CPI with a lag, we know that the current decline in spot market rents should significantly flow through to the CPI’s lagging rent based measures in 2024.
Just as failing to adjust the CPI for spot market rents contributed to a lackadaisical response to inflation in 2021, it is likely leading to too aggressive of a response to inflation today.
The Fed’s former lackadaisical response to a surging M2 money supply and rising underlying (spot market rent adjusted) inflation contributed to inflation being worse than it could have otherwise been. With the Fed now currently ignoring the current YoY decline in the M2 money supply and the major decline in the underlying rate of inflation, the odds of a deflationary bust are greatly increased.
Thank you for reading my latest research piece — I hope it provided you with significant value.
Should you have any questions, please feel free to leave them in the comments below!
In order to help support my independent economics research (remember, everything you see — the forecasts, the charts, the analysis, the in-depth explanations of economic history — is all completed independently by me, for you), please consider liking and sharing this post and spreading the word about Economics Uncovered.
Your support is greatly appreciated and goes a long way to helping make Economics Uncovered a sustainable long-term venture that will be able to continue to provide you with valuable economic insights for years to come.
If you haven’t already subscribed to Economics Uncovered, subscribe below so that you don’t miss an update.




exceptional!