US CPI Preview: August 2023
While August's CPI report could fuel concerns surrounding a 2nd wave of high inflation, leading indicators suggest that there's little reason to be concerned.
Executive summary
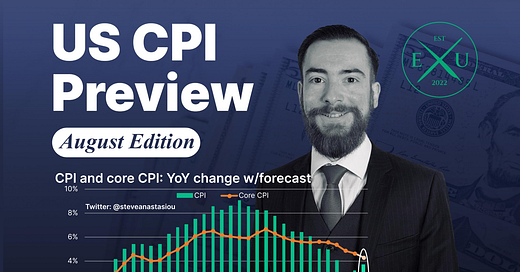
Headline CPI growth expected to increase materially in August, but the core CPI is expected to see a material deceleration
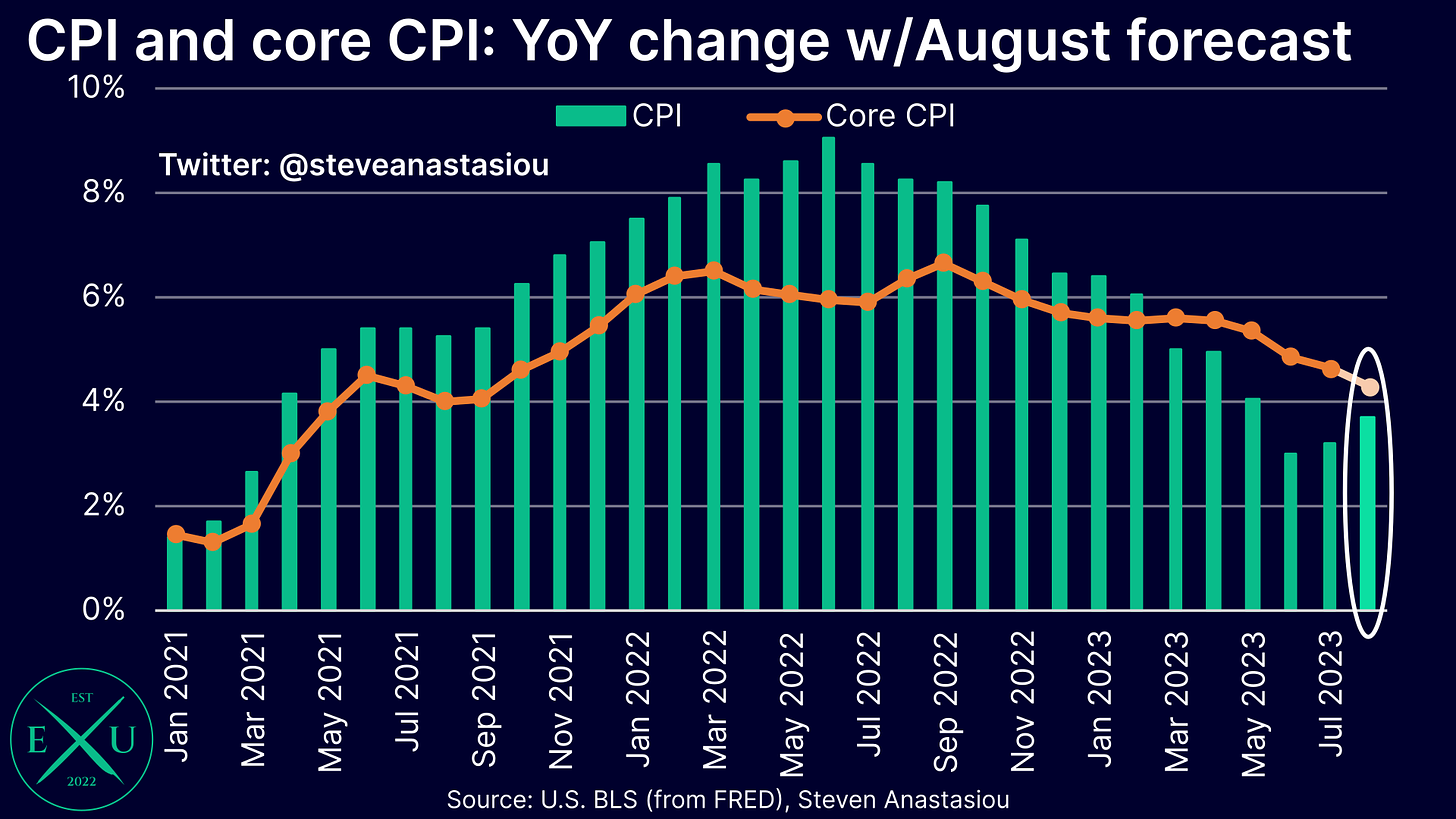
I forecast annual CPI growth to rise to 3.7% in August (vs 3.6% consensus) — a material increase from July’s growth of 3.2%. A key driver of the expected increase in CPI growth, is the impact of higher gasoline prices (up 6.7% MoM).
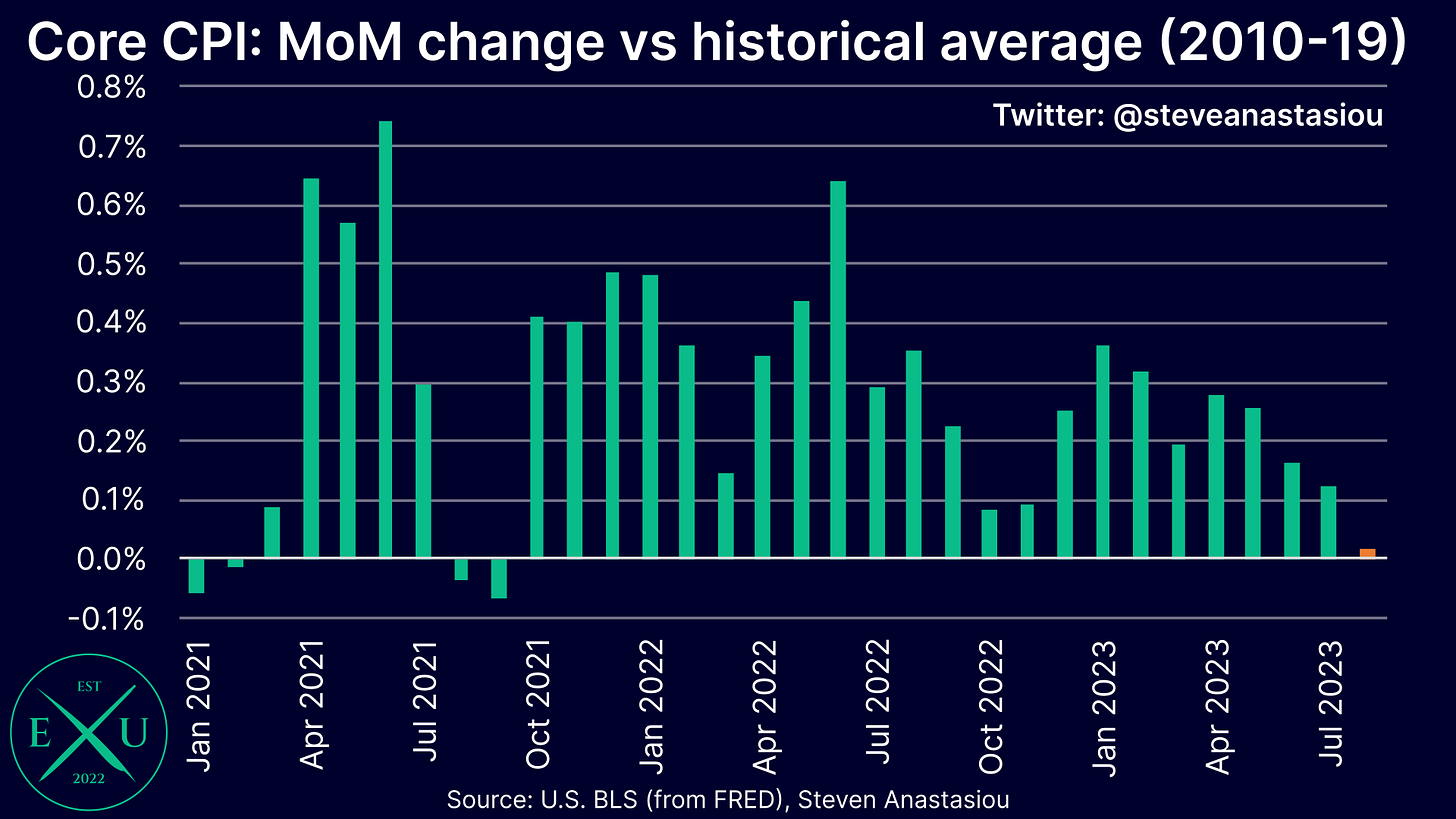
In contrast to the expected jump in the headline CPI, I forecast a material decline in the core CPI — from 4.7% in July, to 4.3% in August (vs 4.3% consensus). The expected decline in annual core CPI growth comes as MoM growth is forecast to record the smallest positive divergence from its historical (2010-19) monthly average, since September 2021.
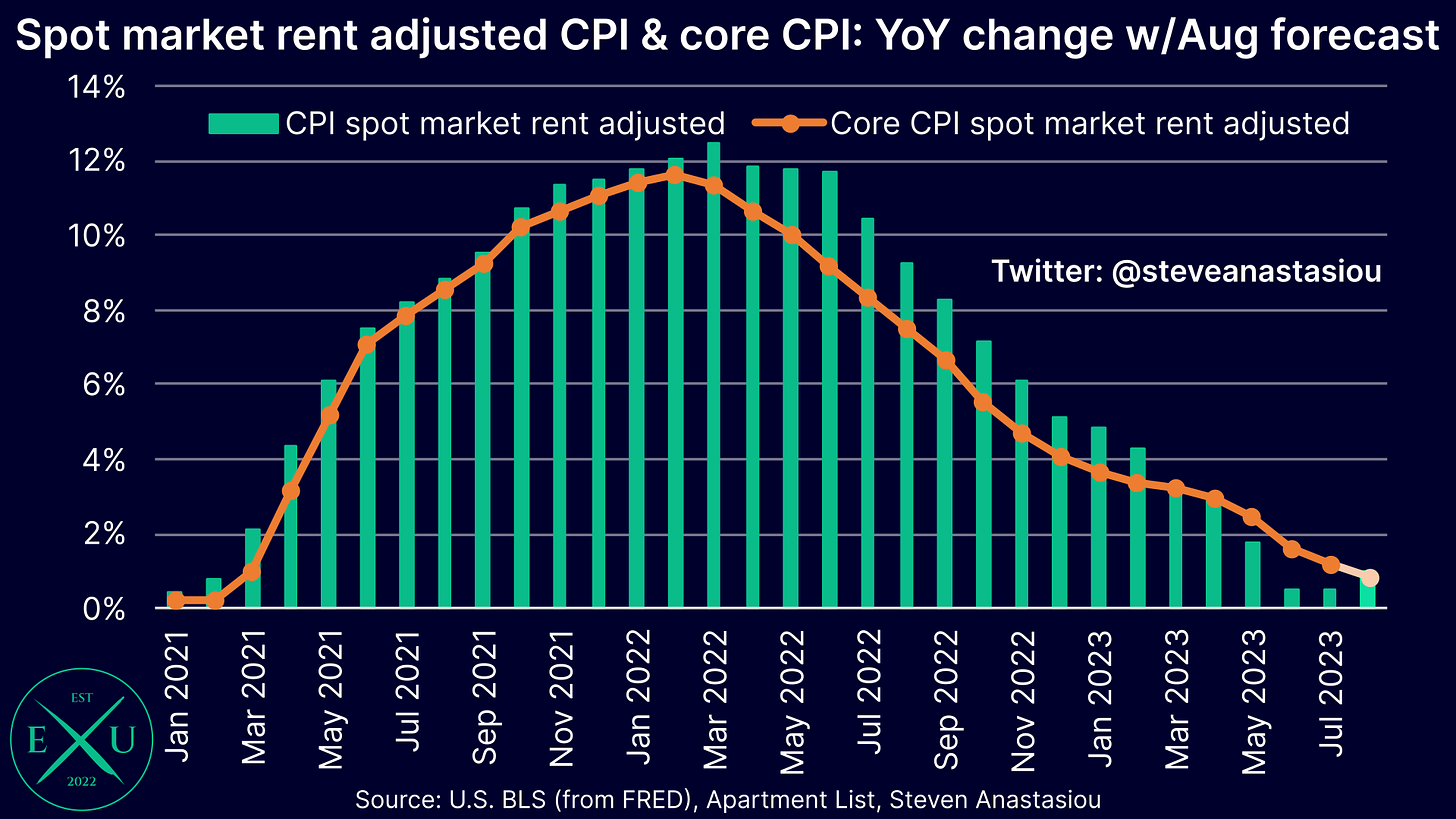
Spot market rent adjusted inflation measures expected to remain well below 2% YoY
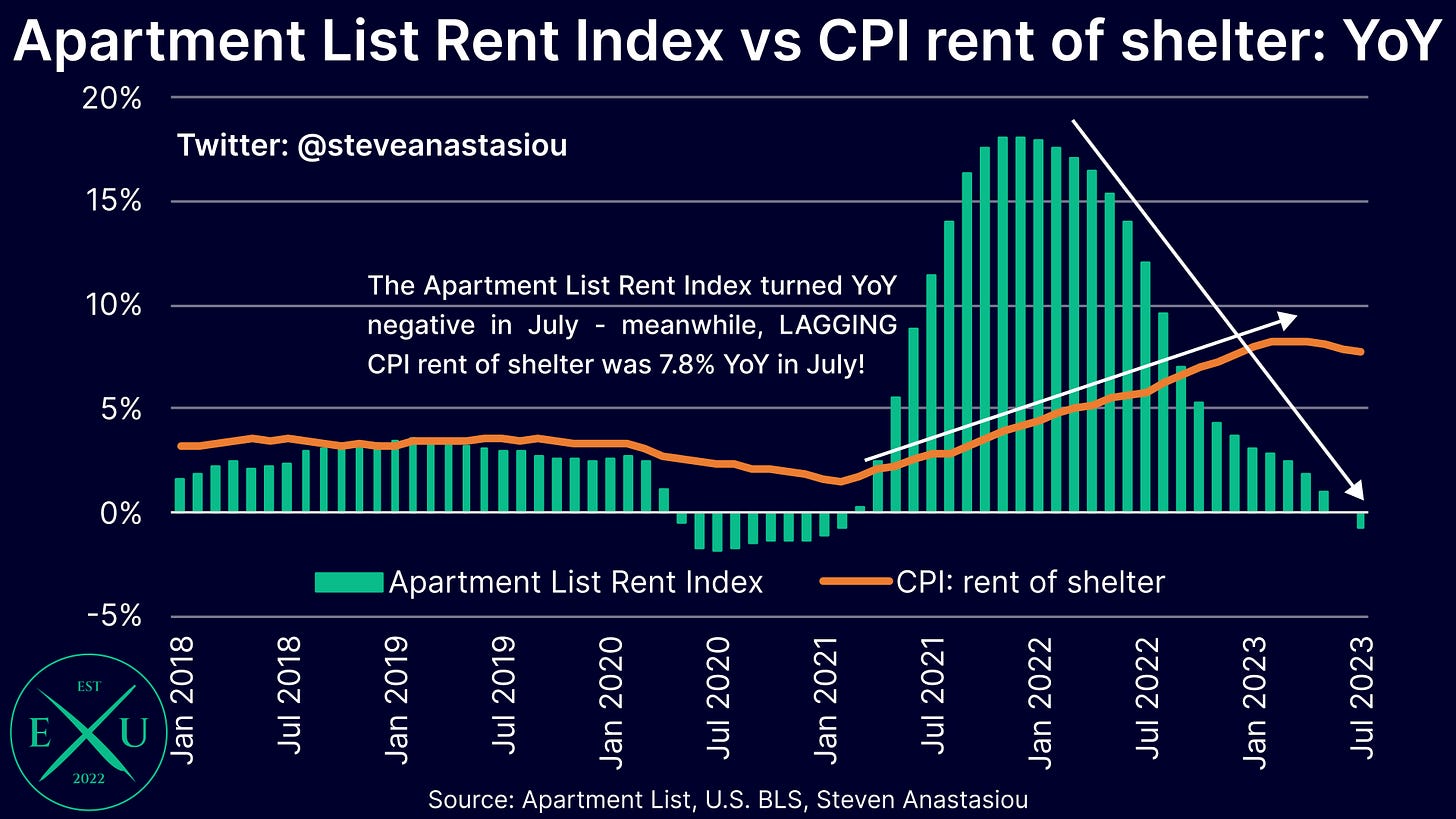
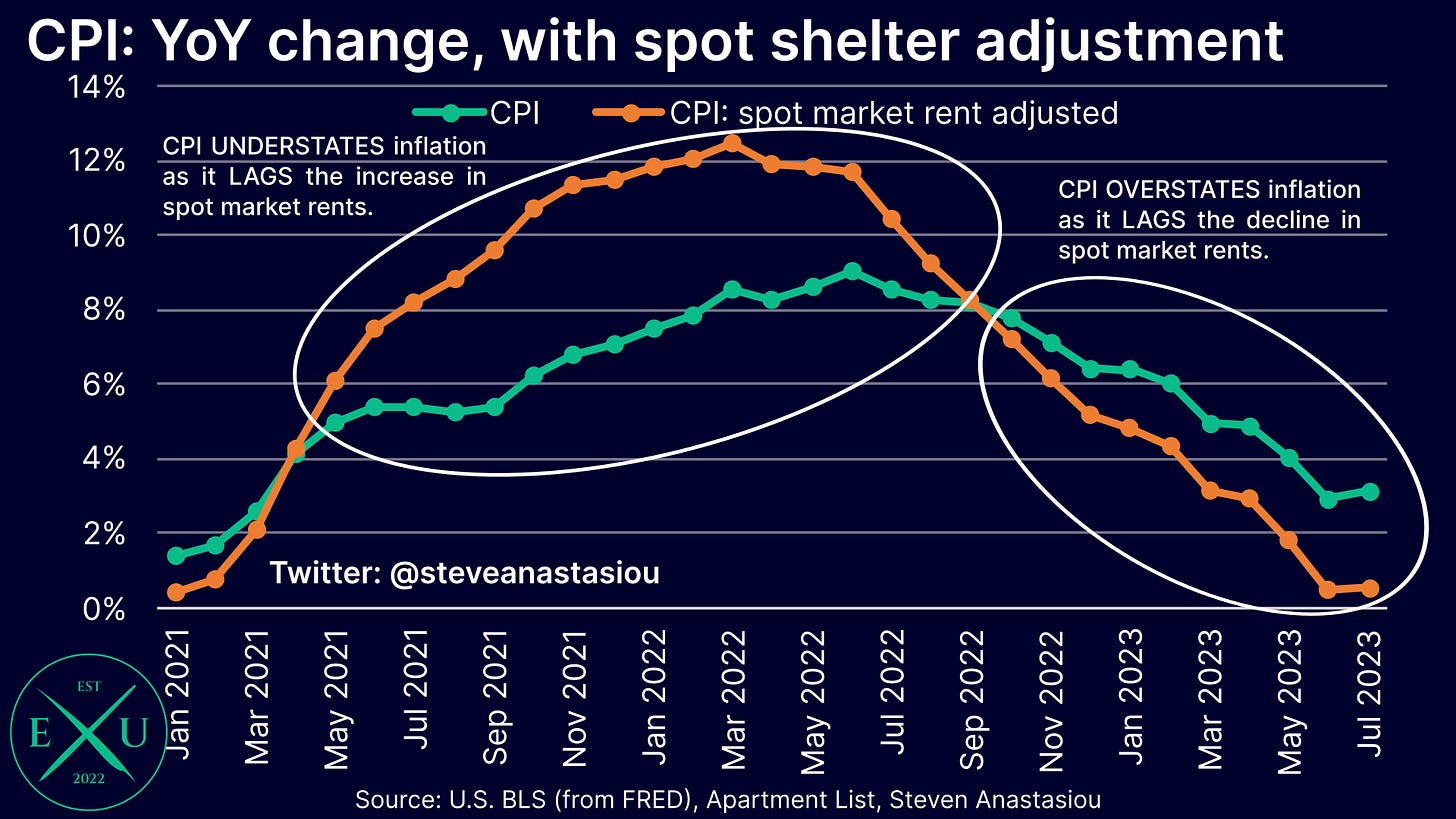
Given the enormous divergence that currently exists between annual spot market rental growth (-1.2% YoY as per Apartment List data in August) and the CPI’s lagging rent of shelter (+7.8% in July), it continues to be critically important that the CPI is also analysed on a spot market rent adjusted basis.
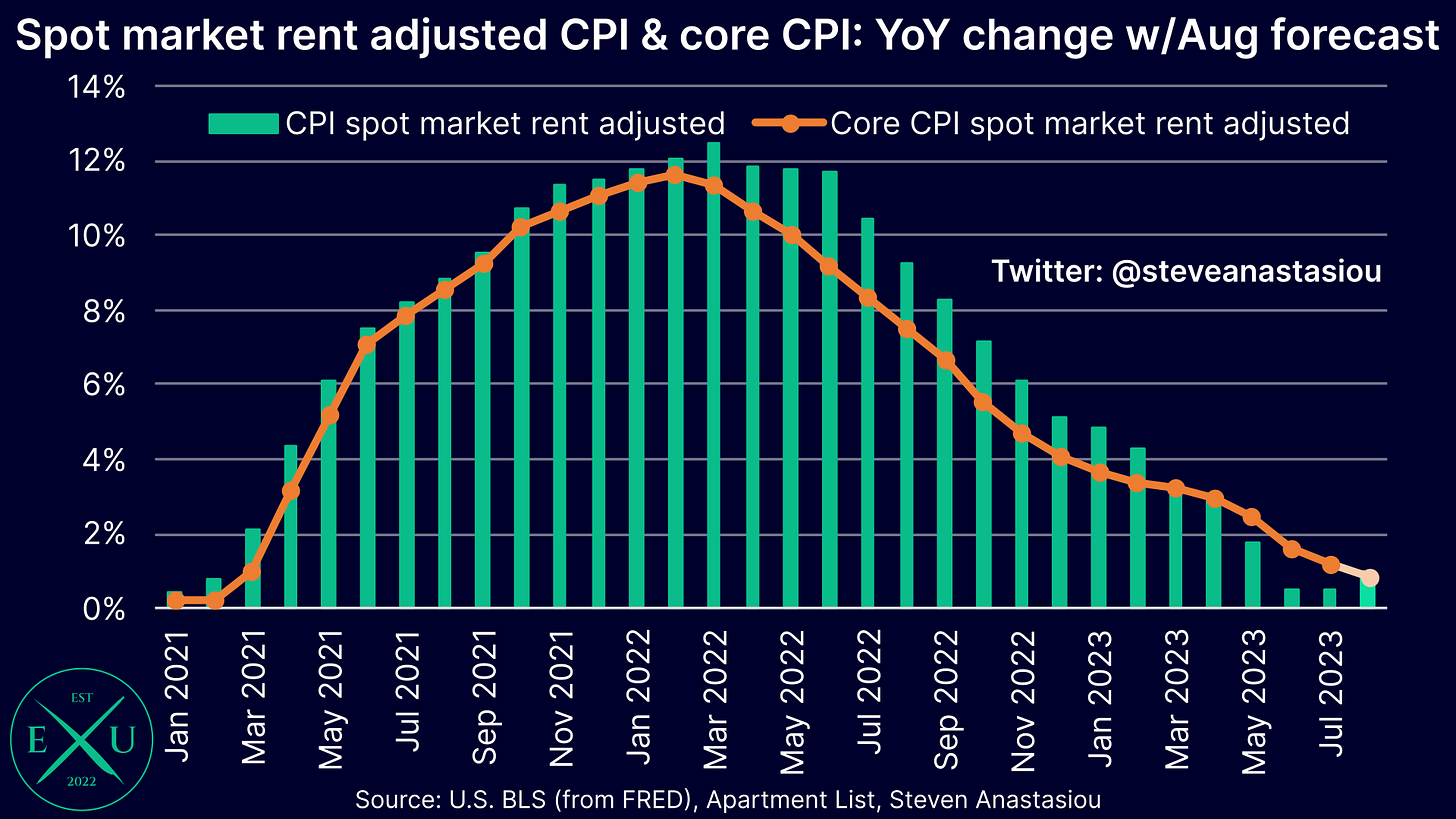
In August, I expect the headline CPI adjusted for spot market rents (as per Apartment List data) to rise to 1.0% YoY, from 0.5% in July.
Turning to the core CPI adjusted for spot market rents, I expect YoY growth to fall from 1.2% in July, to 0.9% in August.
I thus continue to expect both the headline and core CPI to remain well below 2% YoY in August.
Leading indicators suggest that there’s little reason to be concerned about the potential for a 2nd wave of high inflation
In light of the 1970s/80s experience, many may look at the significant increase in the CPI’s annual growth rate from its recent trough of 3.0% in June, and become concerned about the prospect of a 2nd wave of high inflation.
As of today, leading indicators continue to show that there’s little reason to be concerned, and that the CPI is likely to continue to moderate over the medium-term.
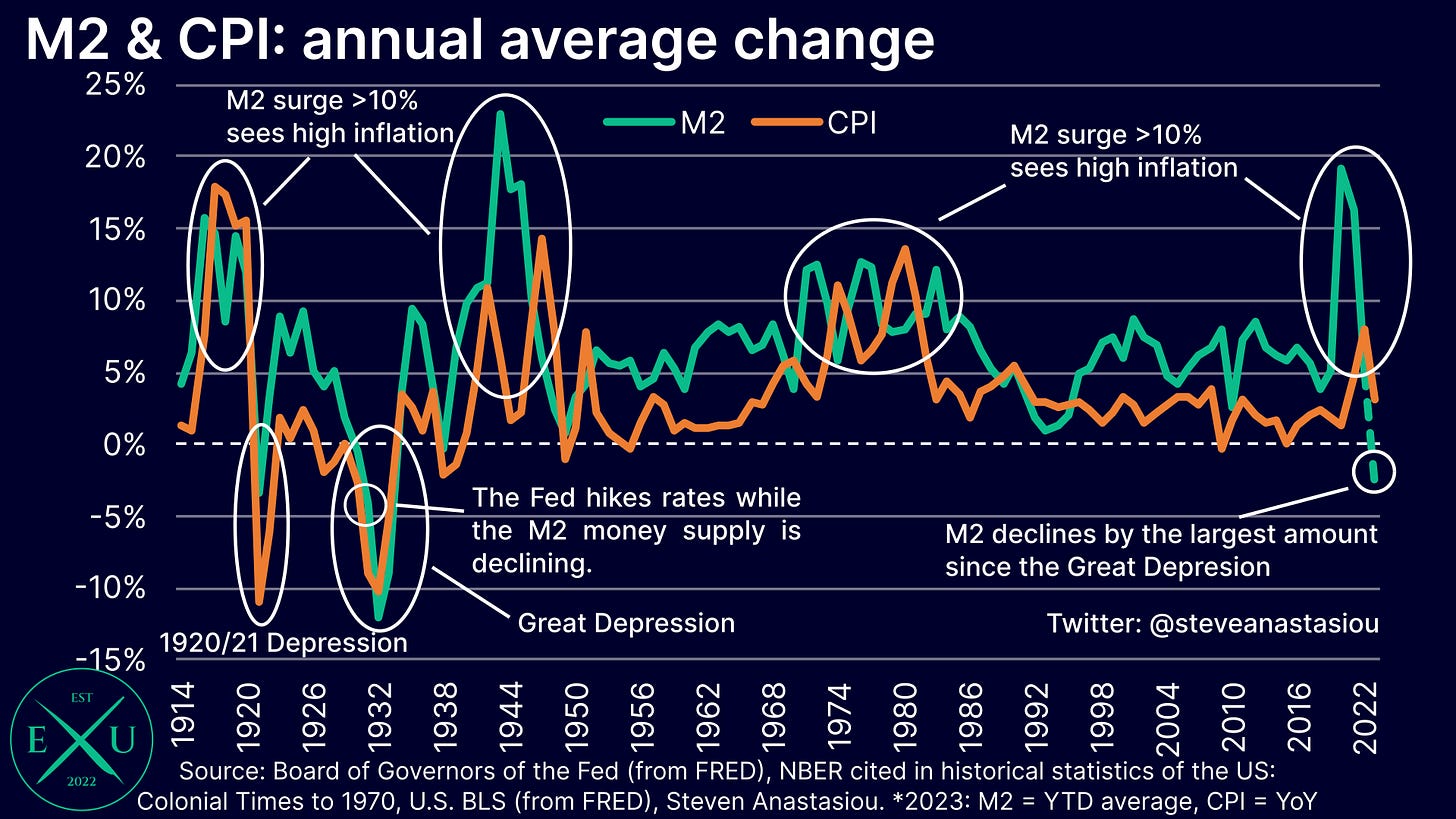
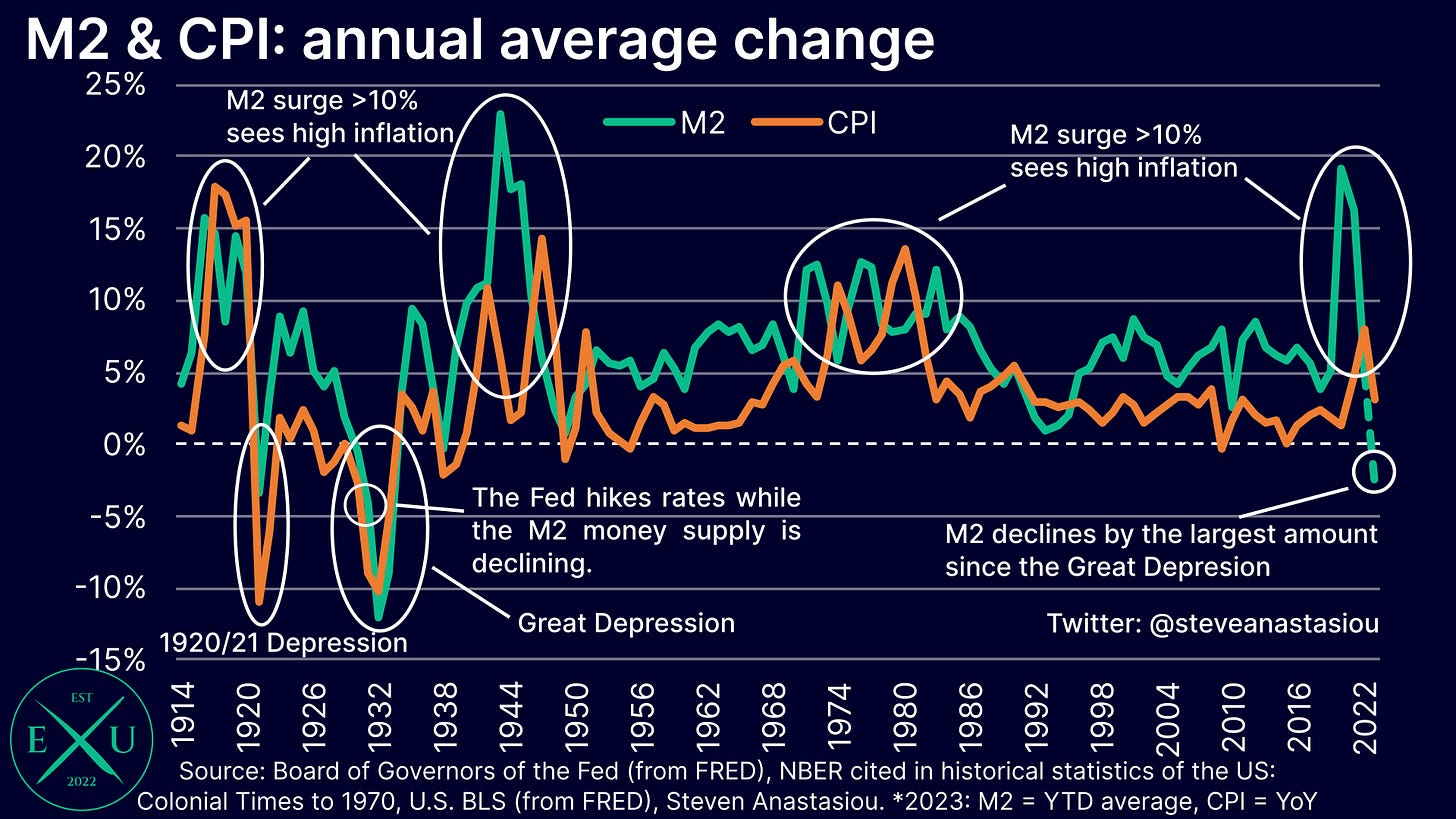
The most important of these leading indicators, is the M2 money supply, which is currently seeing the largest annual average decline that has been seen since the Great Depression.
As history clearly shows, high inflation occurs in response to artificial surges in the M2 money supply, while declines in the M2 money supply are instead correlated with deflation, economic depressions, and bank panics.
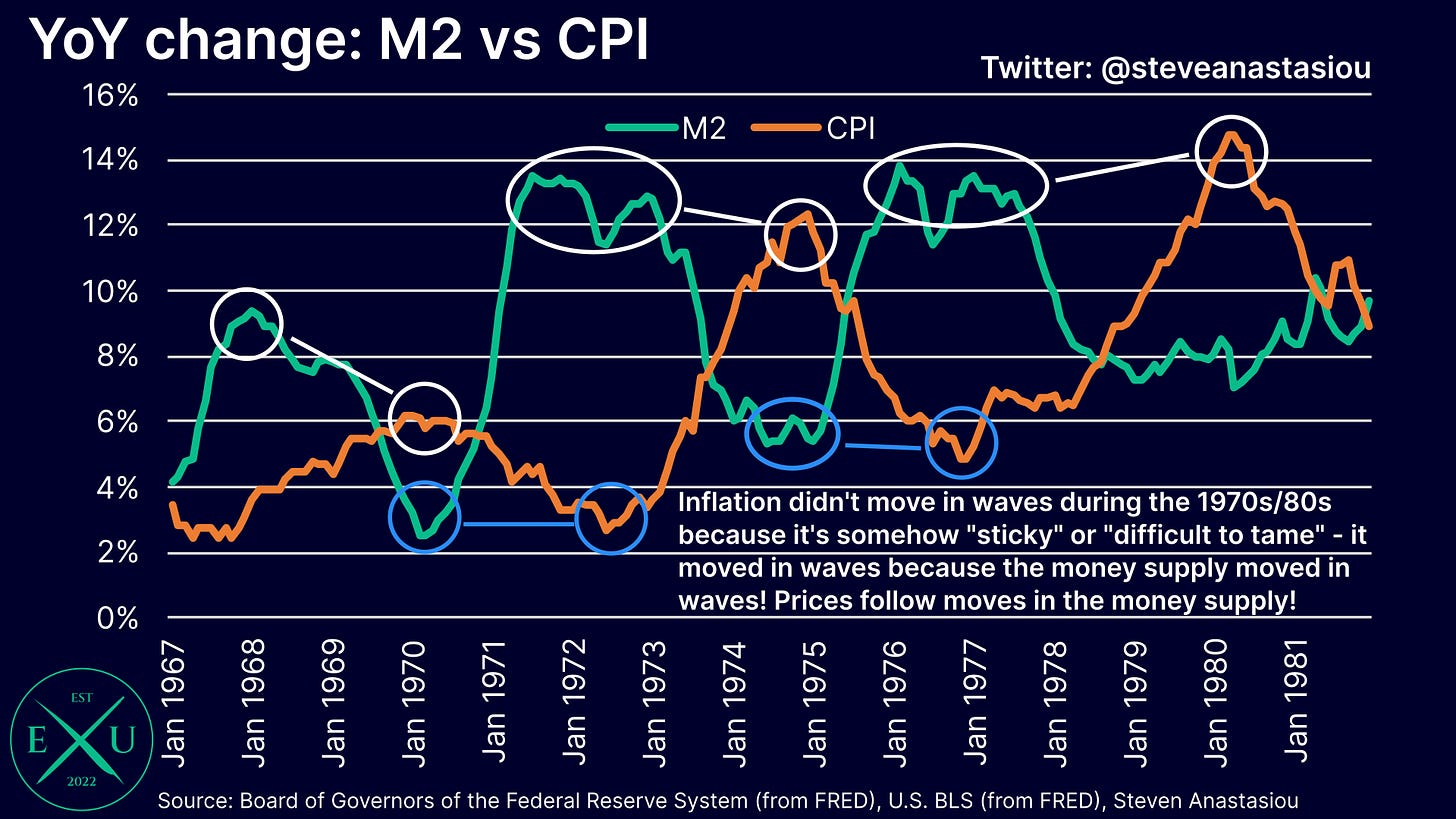
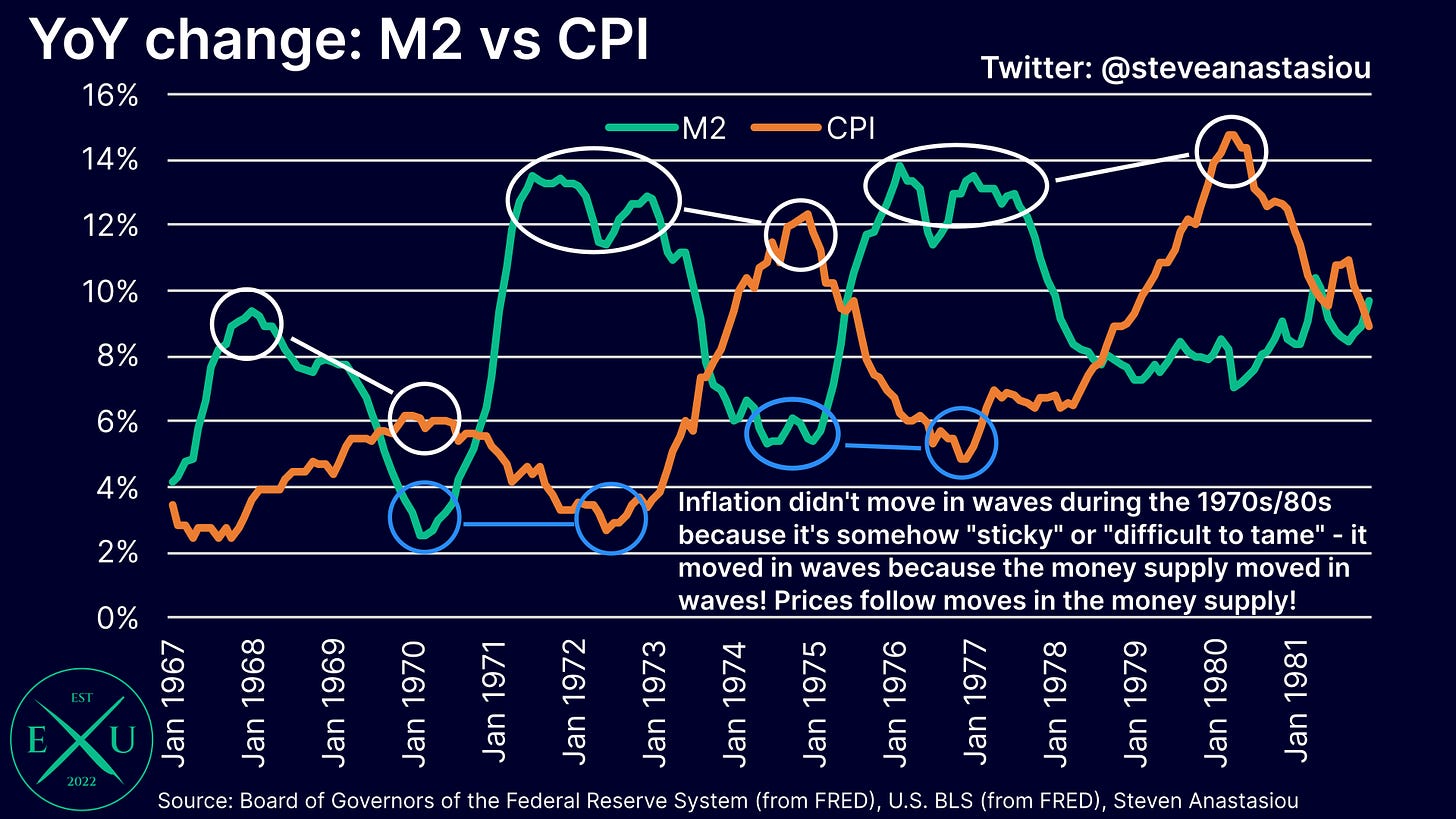
Zooming into the 1970s/80s period, one can clearly see that high inflation didn’t just randomly reappear. Instead, it ebbed and flowed in response to changes in the M2 money supply. With the M2 money supply currently YoY negative, there’s no foundation for a sustained move higher in inflation.
Furthermore, on account of the lagging nature of the CPI’s rent-based measures and their significant weighting in the CPI, spot market rent adjusted measures of the CPI can provide a leading indicator of where the unadjusted CPI may head over the next ~12-18 months.
Given that both the headline CPI and core CPI are expected to remain well below 2% in August on a spot market rent adjusted basis, this is providing another clear indication that lower inflation is likely to be seen over the medium-term.
Finally, as outlined in my most recent medium-term US CPI forecast, August was expected to represent the peak CPI growth rate for 2H23, while the core CPI was expected to continue moderating through 2H23. While volatile gasoline prices are likely to play a key role in whether August represents the peak headline CPI growth rate for 2H23, a falling core CPI creates an important dynamic, as the Fed has been more focused on the core CPI — note that I intend to update my medium-term US CPI forecast post the release of CPI data for September.
Let’s now unpack my latest US CPI Preview in detail, including an analysis of some of its key subcomponents.
Used car prices are expected to record a material fall
As a result of large declines in wholesale used car prices from May to July (as measured by the Manheim Used Vehicle Value Index), I expect CPI used car and truck prices (which measure retail prices), to record a large fall in August.
As shown in the chart below, this expectation comes as a result of CPI used car and truck prices historically having a visibly significant correlation to the Manheim Index on a two month lagged basis.
Though despite the significant correlation, there’s usually some divergence between the Manheim Index and CPI used car and truck prices on a two month lagged basis. Over the past two months, CPI used car and truck prices have recorded changes that have been well above the move implied by the Manheim Index.
In June, CPI used car and truck prices rose 1.2% vs 0.1% for the Manheim Index two months prior. In July, the change in CPI used car and truck prices was -0.2% vs -1.7% for the Manheim Index two months prior.
Given the recent relative price changes, I have chosen to adopt a slightly more conservative forecast for CPI used car and truck prices in August — -3.3% CPI vs -3.8% implied by a two month lag of the Manheim Index.
Annual food price growth expected to keep moderating
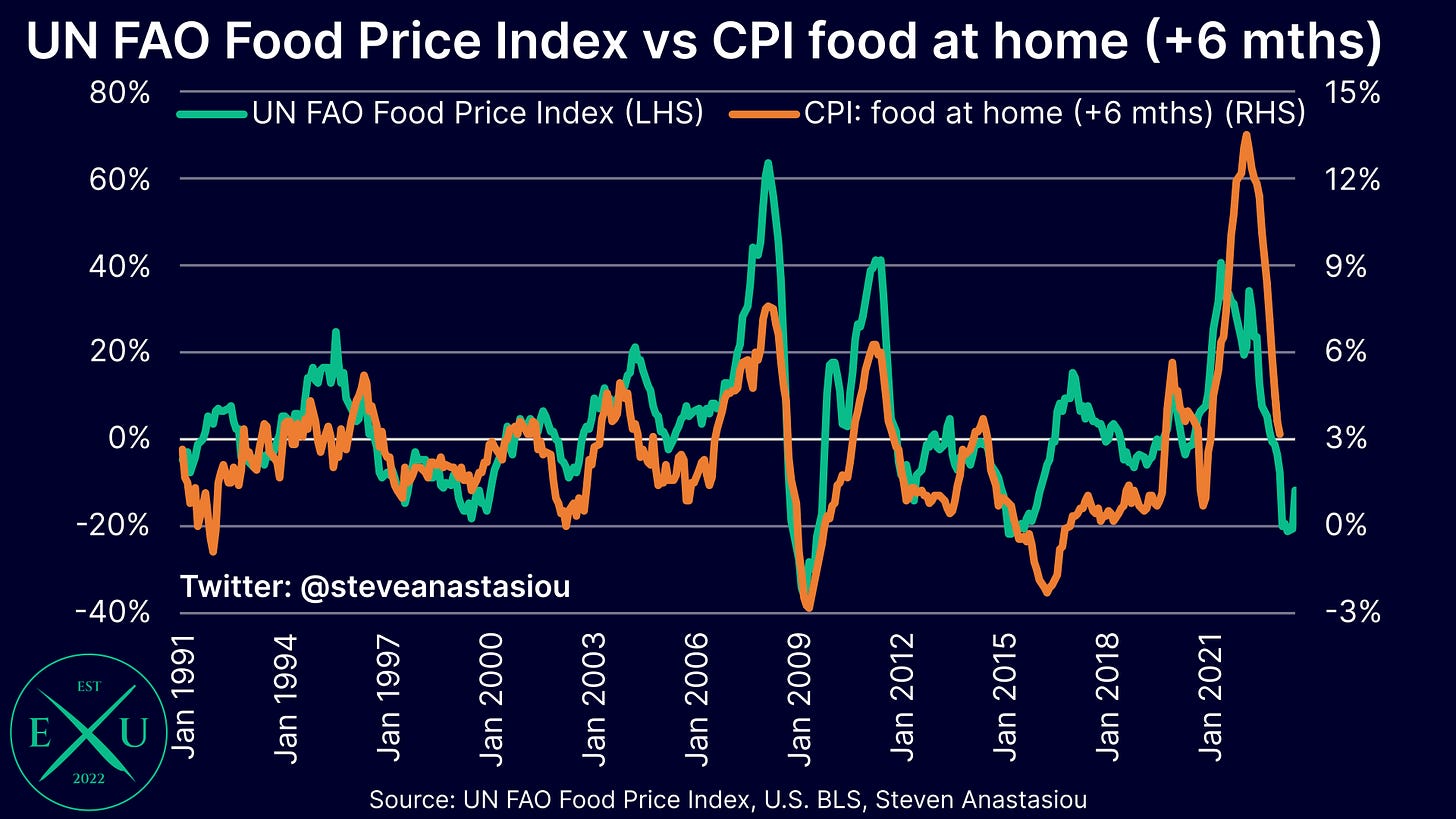
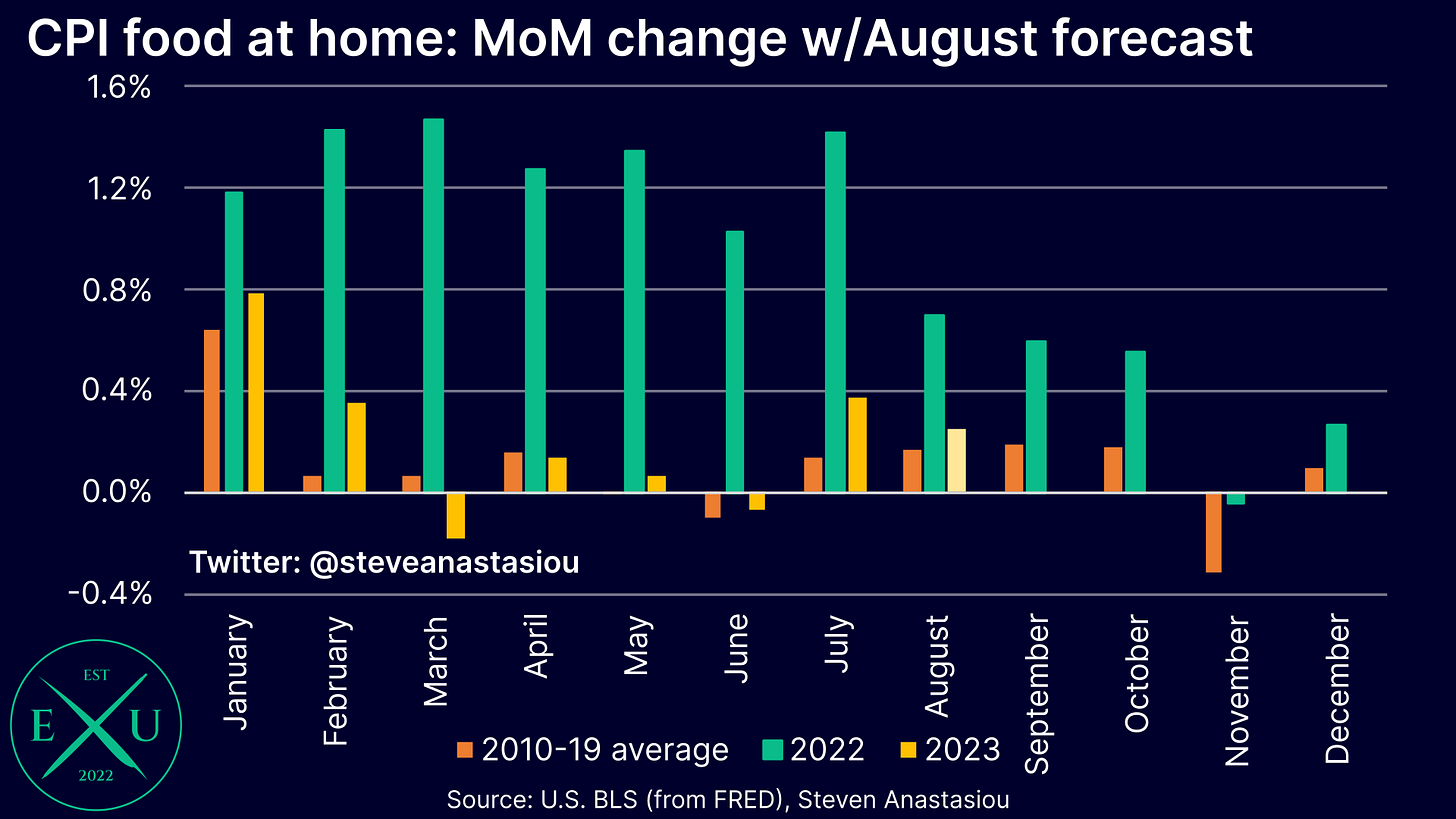
For the 12th consecutive month, I expect the CPI food at home subcomponent to record a moderation in its annual growth rate, which I forecast to fall from 3.6% in July, to 3.1% in August.
In terms of MoM growth, while July’s CPI report showed a reacceleration in CPI food at home price growth versus its historical monthly average, given that: 1) one month of data is not enough to indicate a new trend, and 2) prior declines in underlying food commodity prices support a continued deceleration in CPI food at home price growth, I forecast MoM growth to return to relatively more modest levels in August.
Though given the reacceleration seen in July, it will be important to closely monitor CPI food at home prices in August for any further signs of a potential shift in underlying price trends.
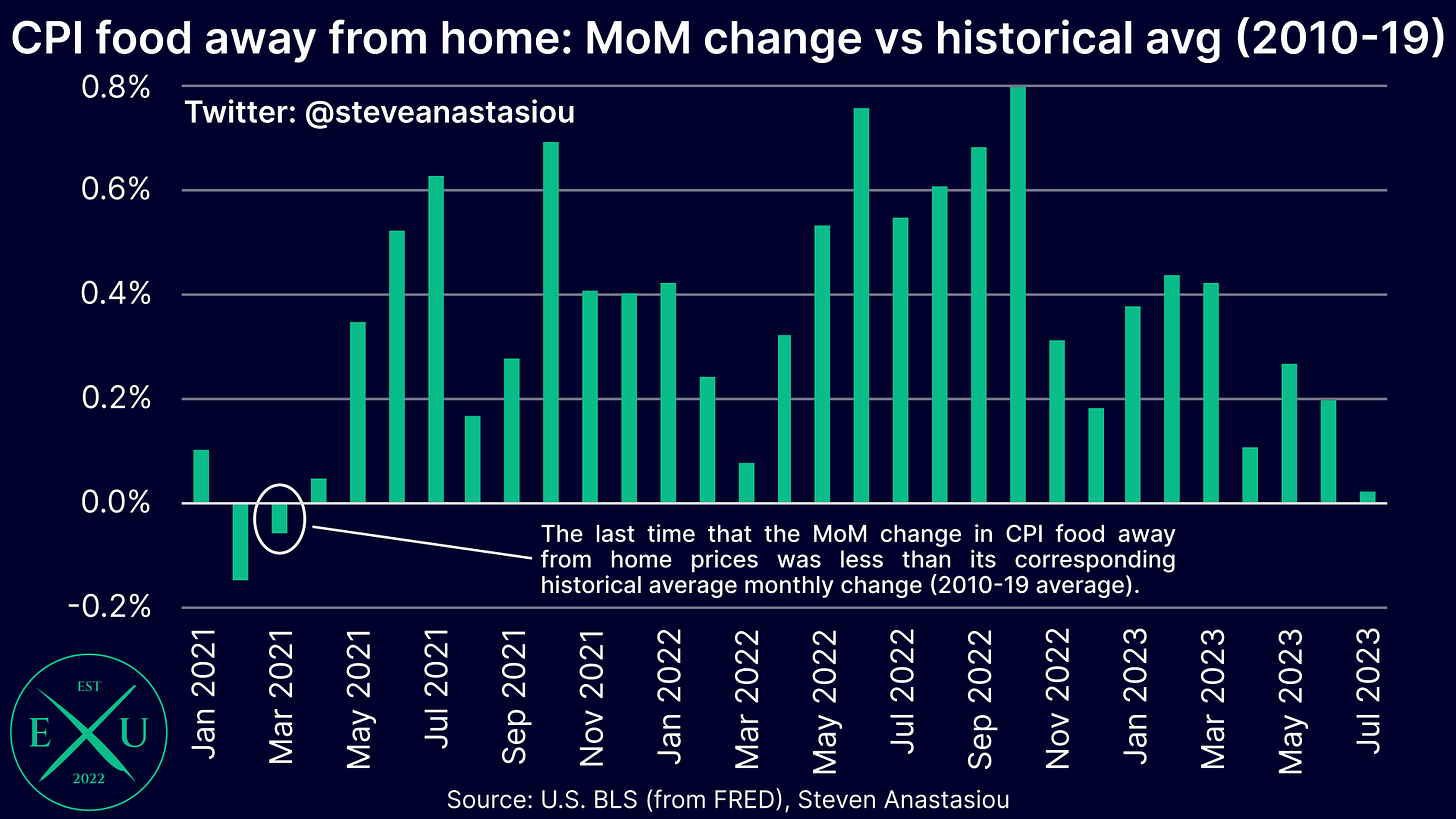
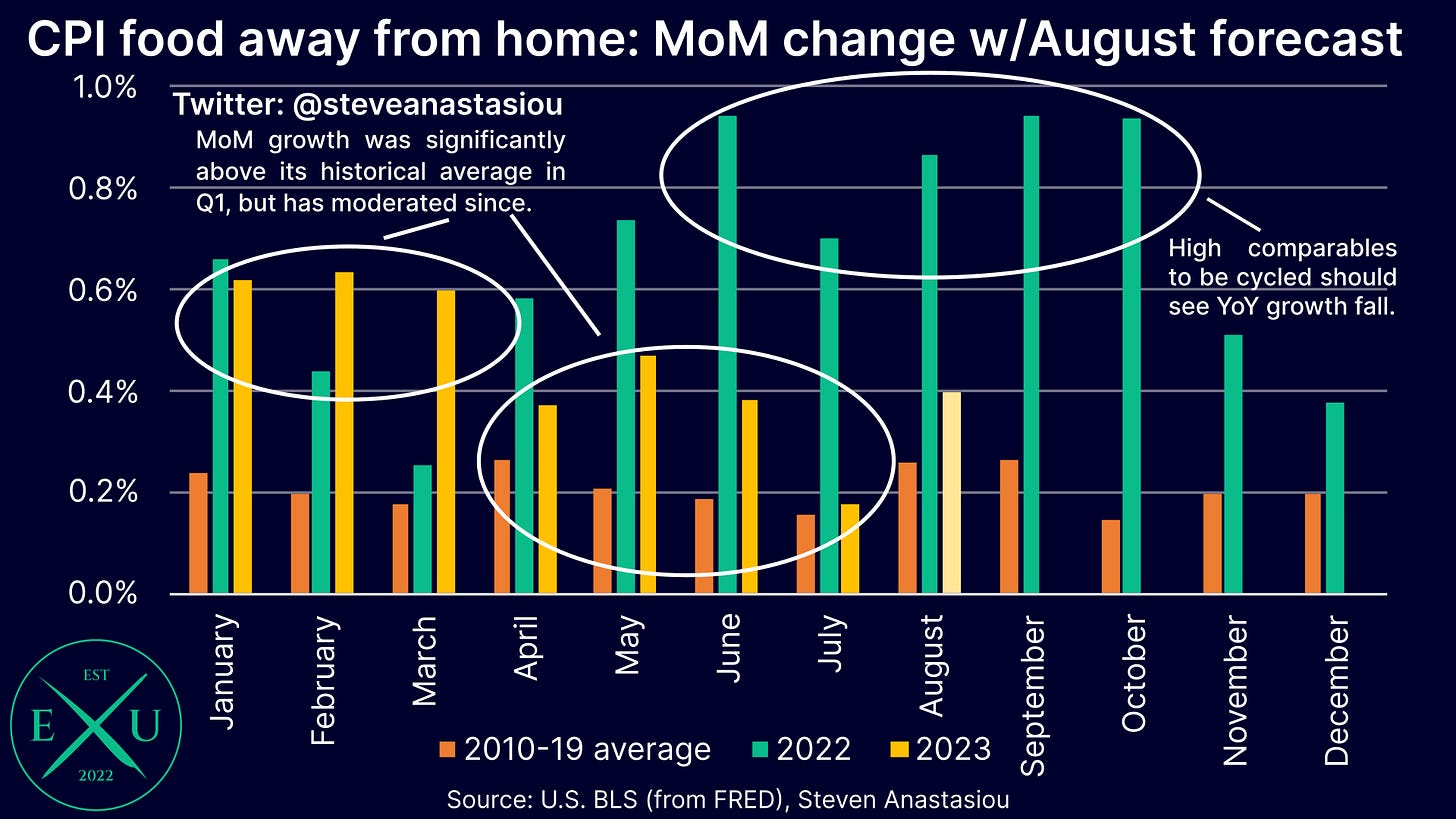
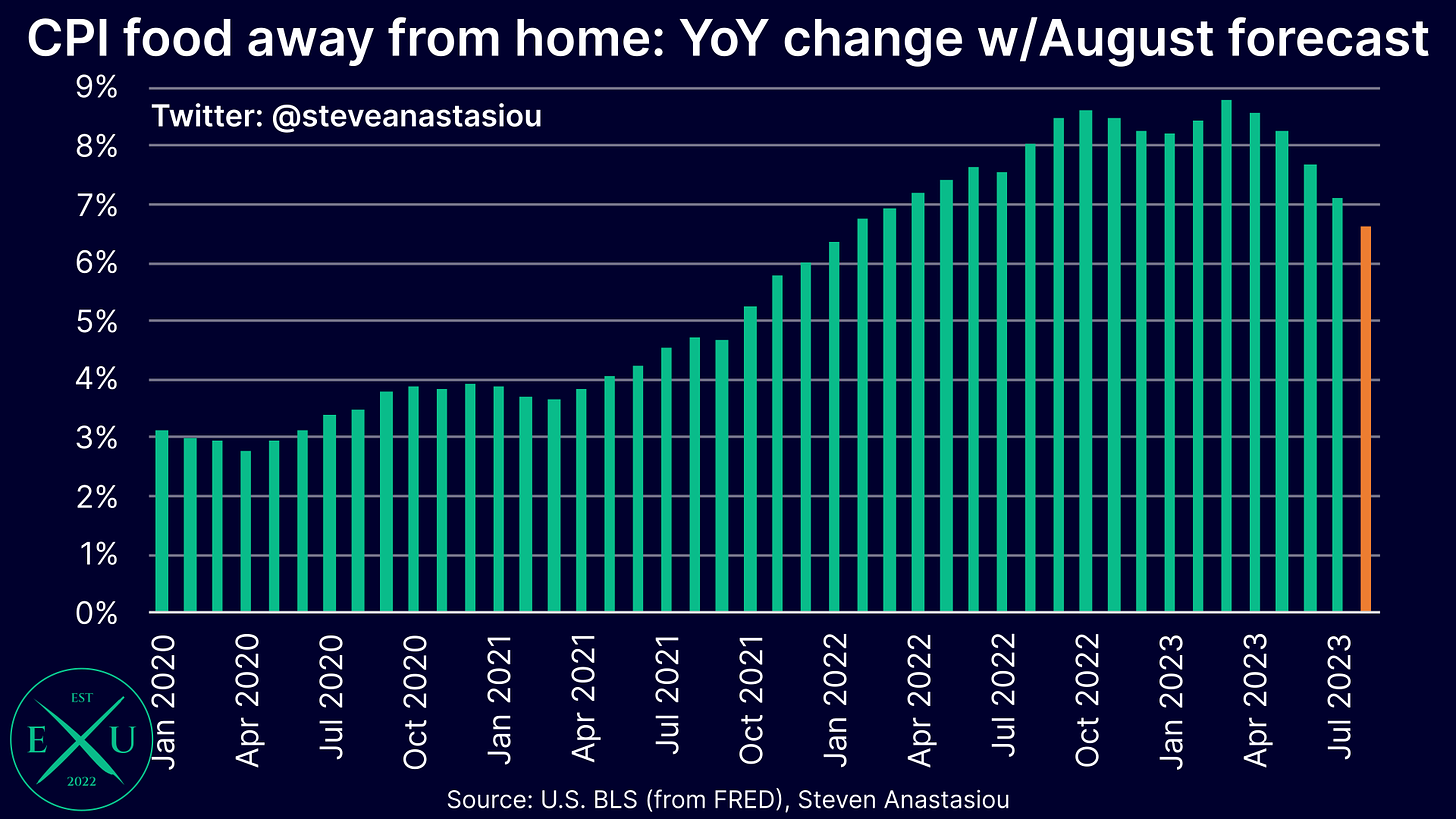
Turning now to CPI food away from home prices, where after seeing significantly higher price growth versus historical monthly averages in 1Q23, MoM growth has since moderated significantly.
In July, MoM price growth was largely in-line with the historical average, marking the smallest positive variance since March 2021.
This is a key development, as CPI food away from home prices, on account of their greater services related costs, have been more lagging than CPI food at home prices.
Nevertheless, as prices have continued to be above their historical average over the past several months, I continue to forecast another month of higher than average price growth in August.
On an annual basis, I expect CPI food away from home price growth to moderate from 7.1% in July, to 6.6% in August.
Big jump in gasoline prices expected to flow through in August — note that prices have now come off peaks
While the significant increase in oil prices since July has been spoken about in detail, it is yet to have had a significant impact on the CPI — that is set to change in August.
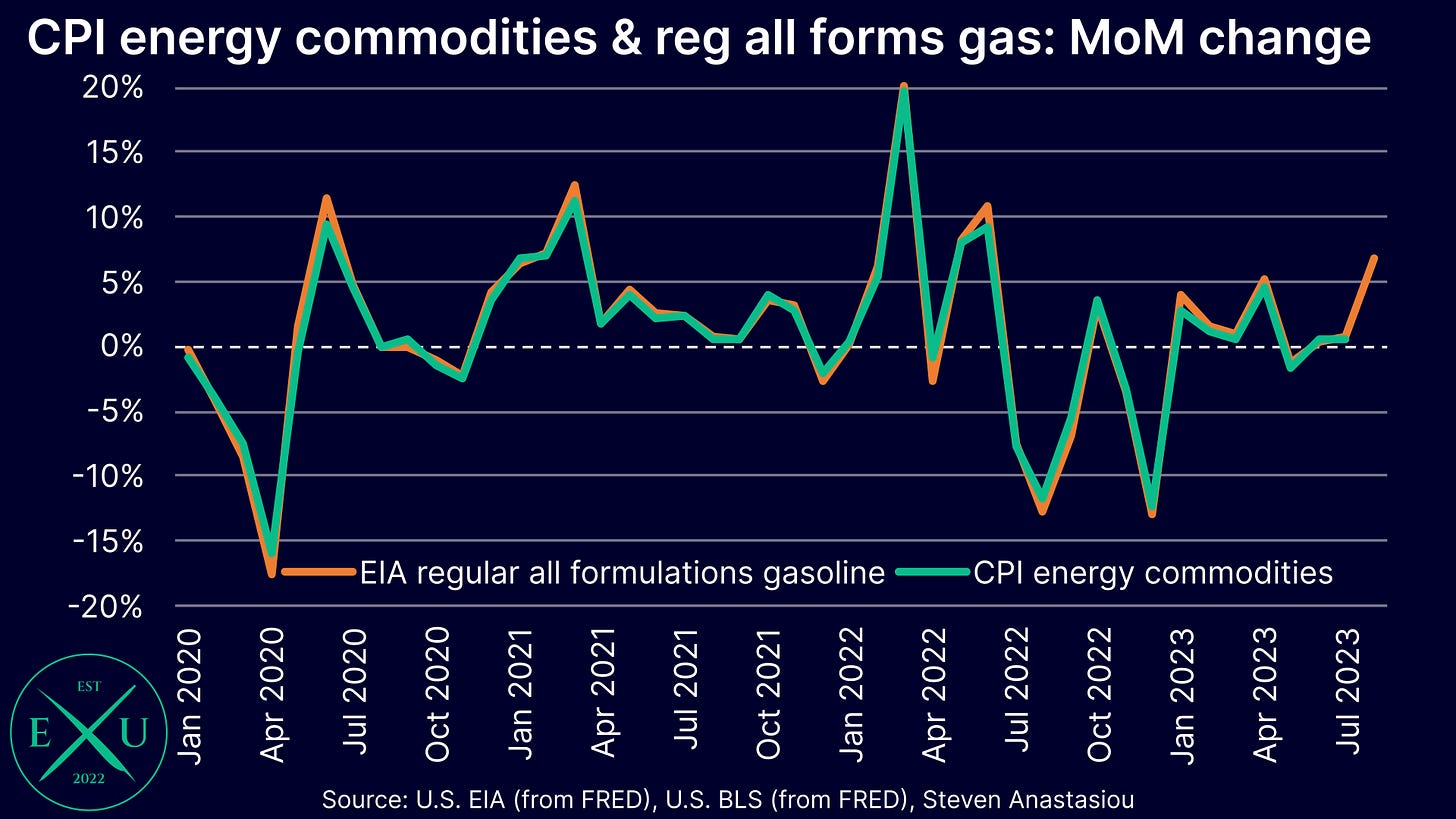
As per US EIA data, regular all formulations gasoline prices saw a monthly average increase of 6.7% in August — note that the monthly average change in regular all formulations gasoline prices tends to closely reflect the MoM change in the CPI energy commodities index.
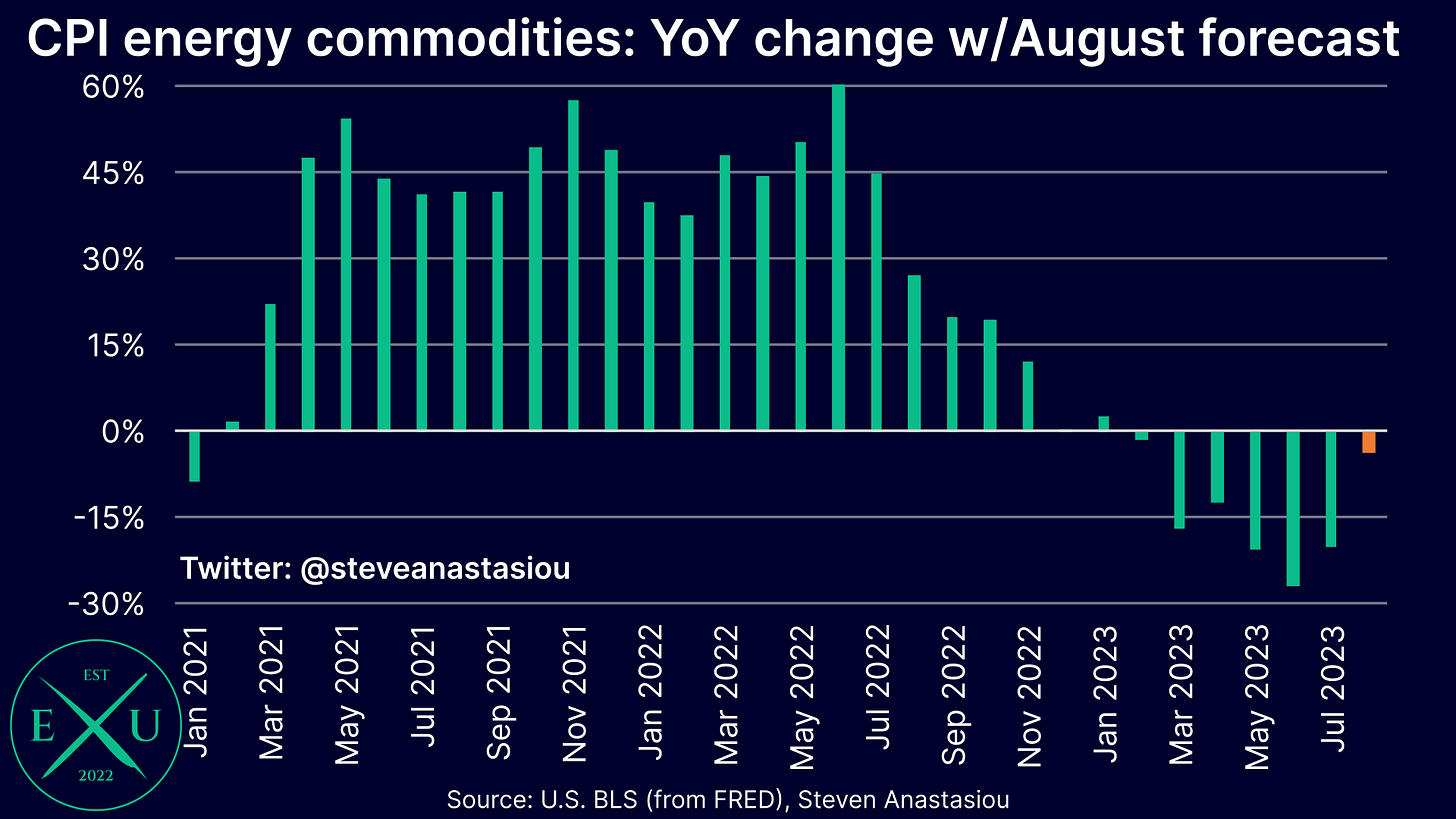
Should the CPI energy commodities index rise by the 6.7% move that was seen in gasoline prices, the YoY change would see a significant shift, moving from -20.3% in July, to -3.6% in August.
Briefly looking ahead to September’s CPI report, while many continue to focus on higher oil prices, it’s important to note that RBOB gasoline prices have come off their recent highs. As a result, national average gasoline prices have so far, not continued to grow in September.
Rent indices expected to continue moderating, but remain at elevated YoY levels
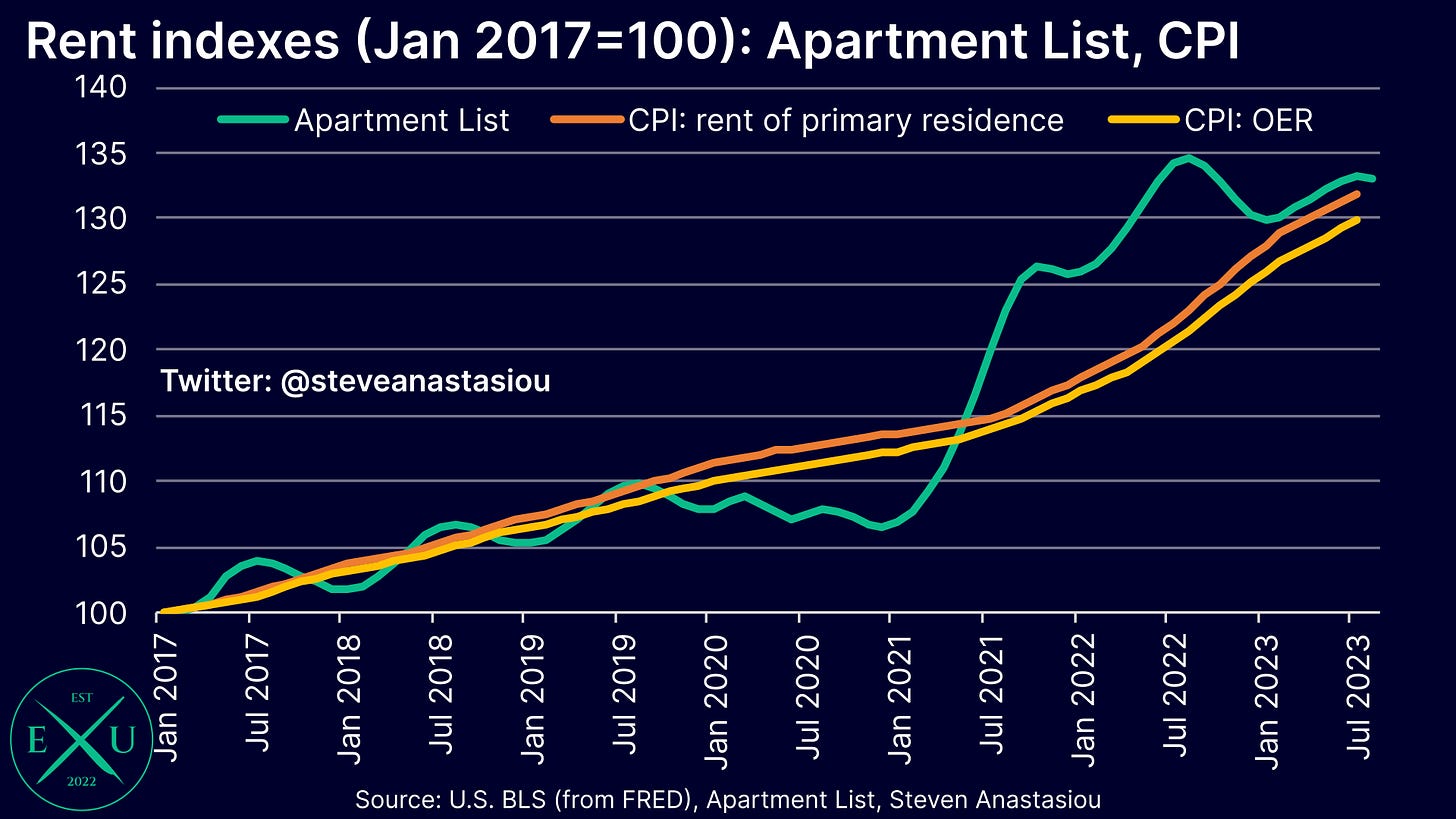
Turning our attention to rental prices, it’s important to note that with spot market rental price growth turning YoY negative (as per Apartment List data), and the CPI’s lagging rent-based measures (owners’ equivalent rent (OER) and rent of primary residence (RPR)) continuing to climb at high rates, the gap that had opened up between spot market rents and the CPI’s rent-based measures has now largely converged.
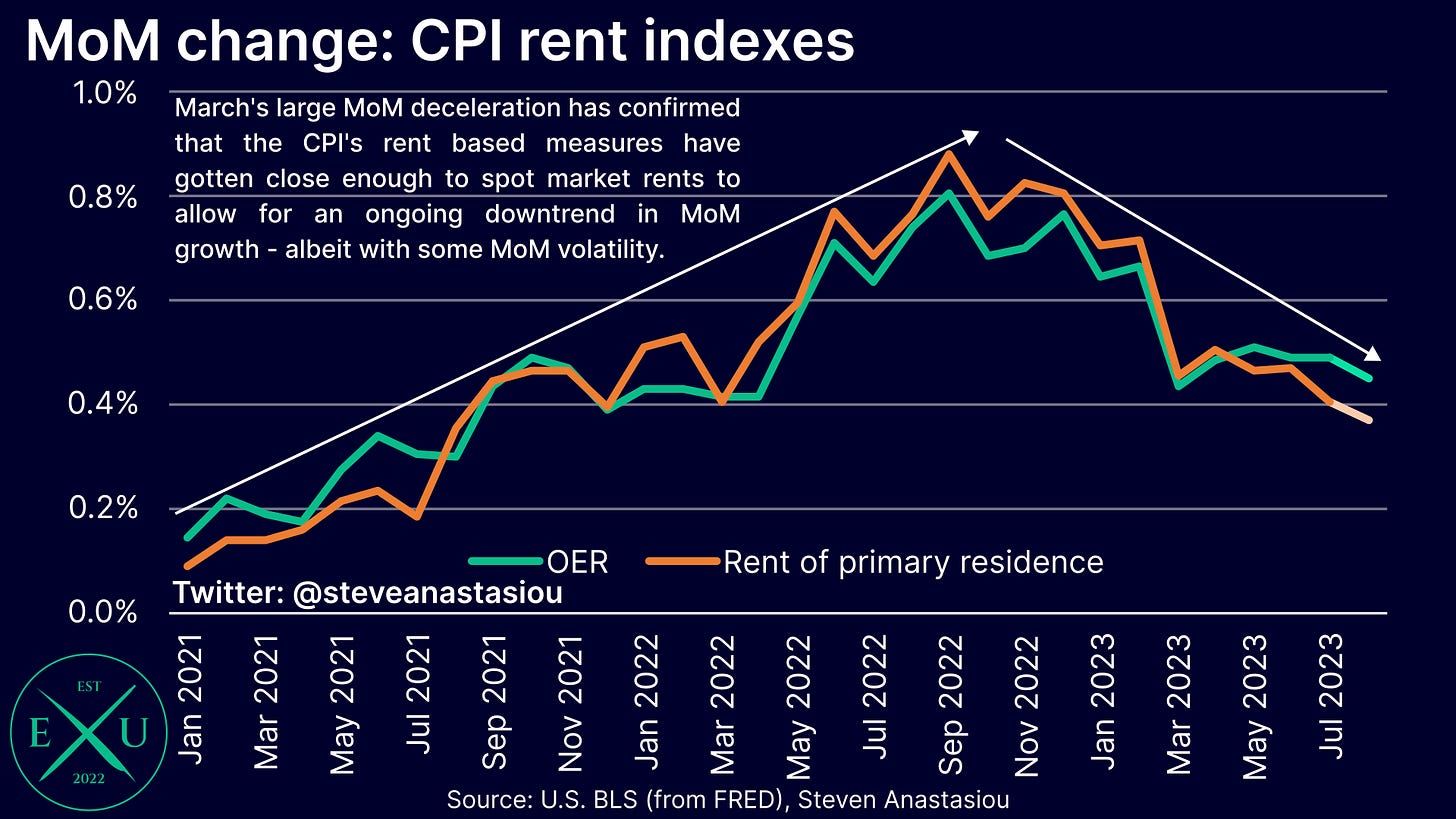
Given this convergence, the monthly growth rate of OER and RPR has moderated over recent months. With spot market rental growth continuing to see MoM growth that is well below its historical average, I forecast an additional moderation in MoM growth for OER and RPR in August.
Though remember, for the same reason that the CPI’s rent-based measures are lagging, the index is smoothed in nature, meaning that the moderation in MoM growth is likely to be gradual.
In spite of the moderation that has occurred, MoM growth in OER and RPR has continued to remain relatively elevated. As a result, the gap between spot market rental growth and OER/RPR on an annual basis, continues to be vast.
This is resulting in the CPI significantly overstating underlying inflation, a reversal of its previous significant understatement, as spot market rental growth vastly exceeded OER/RPR during much of 2021-22.
Other personal services prices have decelerated significantly over the past two months — will it continue?
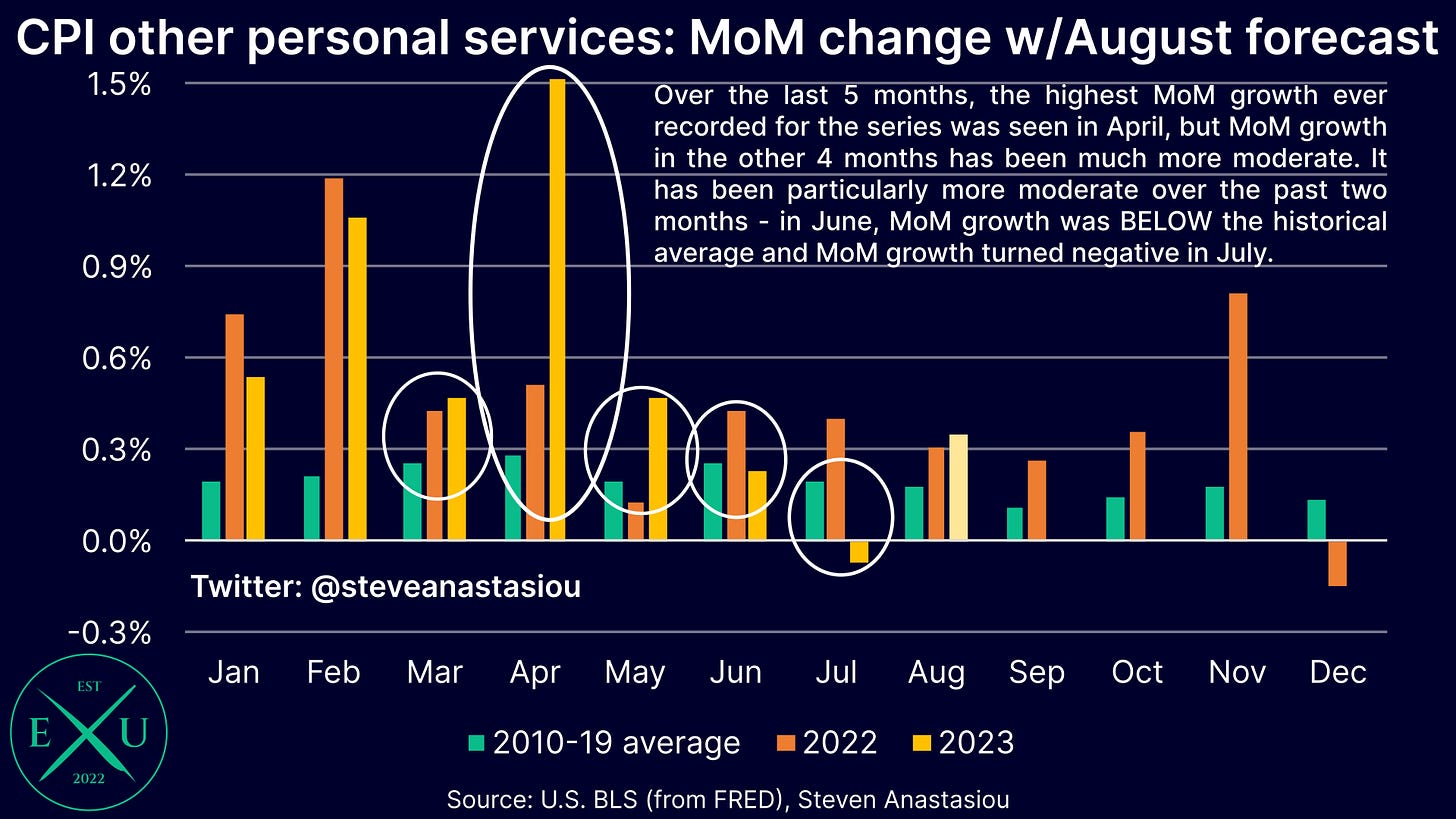
Including a range of items such as haircuts, legal services, and accounting fees, the CPI other personal services category provides insights into a wide spectrum of different services prices.
Over the past two months, MoM growth in CPI other personal services prices has decelerated significantly, with MoM growth below its historical average in June, and outright negative MoM price growth recorded in July.
While a significantly positive development, and one which provides further evidence that the most lagging component of the price cycle (services prices) is now seeing price growth decelerate, given the larger price growth that was seen in April and May (with April’s MoM growth being a record), I am forecasting another month of higher than average MoM growth in August.
Should monthly price growth again be less than the historical monthly average in August, representing the third consecutive month of below average growth, this would provide significant evidence that YoY growth is on the pathway to returning to its historical average.
Monthly CPI growth expected to be materially above its historical average in August on account of oil prices
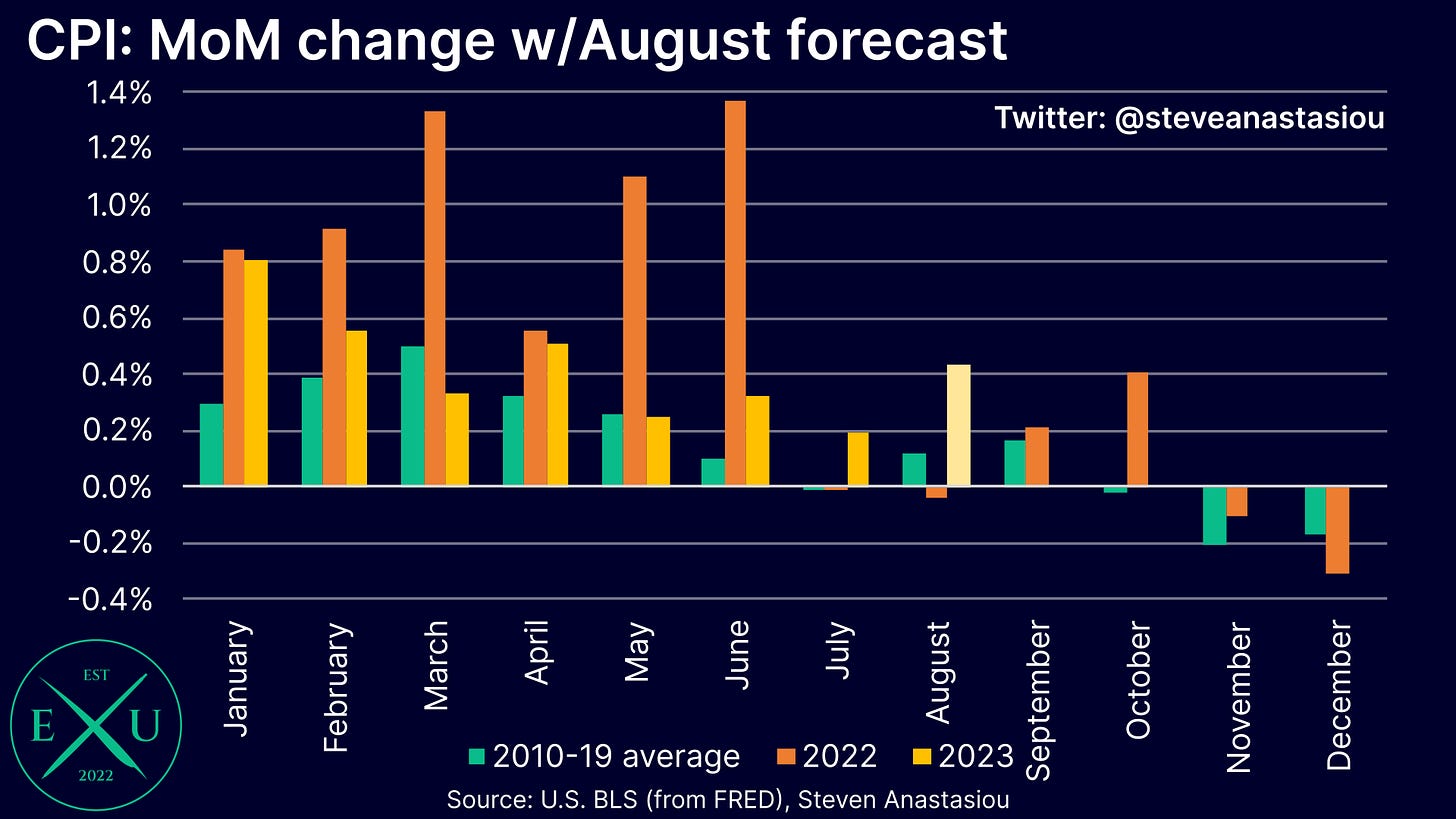
On a non-seasonally adjusted basis, I expect the CPI to see a MoM increase of 0.4% in August. This is materially above August’s historical average MoM growth of 0.1%, and would represent the third consecutive month of significantly higher MoM growth vs its historical average.
Much of August’s relatively stronger growth forecast is driven by the expected increase in the CPI energy commodities index. If the CPI energy commodities index was instead expected to record a flat MoM reading, then my MoM CPI forecast would be 0.2%.
Monthly core CPI growth expected to see a further moderation towards its historical average
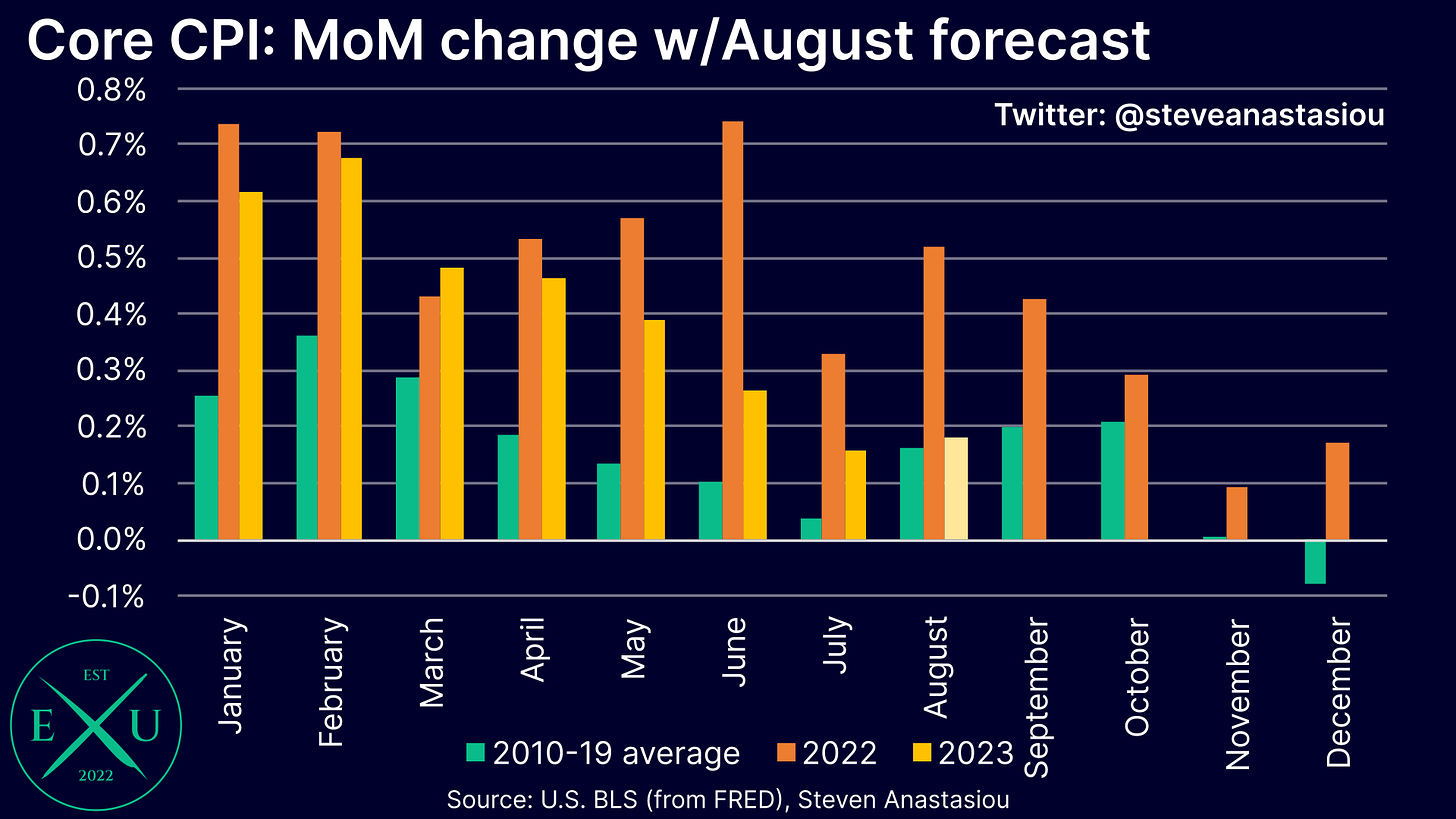
In contrast to the relatively hot MoM CPI forecast, I expect core CPI growth to be largely in-line with its historical average in August. This would mark a continued moderation in monthly core CPI growth, which has been trending closer towards its 2010-19 average in recent months.
Should monthly core CPI growth come in-line with my forecast, it would represent the most modest growth in comparison to its historical average since September 2021.
Annual CPI growth expected to move materially higher in August, but core CPI growth expected to keep moderating
On an annual basis, I expect headline CPI growth to increase materially, from 3.2% in July, to 3.7% in August. This is slightly above the consensus estimate of 3.6%.
Meanwhile, I expect the core CPI to record its fifth consecutive moderation in annual growth, falling from 4.7% in July, to 4.3% in August. This is in-line with the consensus estimate.
CPI and core CPI adjusted for spot market rents both expected to remain well below 2%
Given the major divergence that exists between annual spot market rental growth, and the CPI’s rent-based measures, it continues to be important that the CPI is adjusted for spot market rents.
On such a basis, and in-line with the increase in the unadjusted headline CPI, I expect the CPI adjusted for spot market rents to see its YoY growth rate increase from 0.5% in July, to 1.0% in August.
Looking at the core CPI on a spot market rent adjusted basis, I expect annual growth to fall from 1.2% in July, to 0.9% in August.
Both the CPI and the core CPI are thus expected to remain well below 2% on a spot market rent adjusted basis in August.
Don’t be concerned about a new wave of higher inflation — leading indicators continue to point to lower inflation over the medium-term
After falling to 3.0% in June, if the CPI rises to 3.7% as I forecast in August, many may become concerned about the potential for another wave of high inflation to emerge — in my opinion, such concerns would be unfounded.
The most important supporting factor for why one should not be concerned about the potential for another wave of high inflation, is that the M2 money supply continues to decline at the fastest pace that has been seen since the Great Depression.
As history shows, instead of high inflation, declines in the M2 money supply are associated with deflation, economic depressions and bank panics.
Without a surge in the M2 money supply, there’s no underlying support for a significant increase in prices, which is a fundamental difference to the 1970s/80s period, which many refer to in support of their expectation for another wave of high inflation.
Zooming into the 1970s/80s period, one can see that instead of randomly ebbing and flowing, inflation followed changes in the money supply.
Furthermore, given the lagging nature of the CPI’s rental measures, the spot market rent adjusted CPI can provide a leading indicator as to the direction in which the headline CPI and core CPI are likely to head.
With both headline and core CPI inflation well below 2% on a spot market rent adjusted basis, this provides a strong indication that the CPI and core CPI will continue to trend lower during 2024, as the CPI’s lagging rent of shelter component gradually decelerates towards the growth rates that are being seen in current spot market rents.
In terms of my most recently published medium-term US CPI forecast, I had forecast annual headline CPI growth to see a near-term peak in August. Whether this holds, is likely to significantly depend on whether or not gasoline prices see another material spike higher during the remainder of 2H23.
As I also outlined in my most recently published medium-term US CPI forecast, I expect the core CPI to continue moderating across 2H23, reaching 3.6% in December 2023 (note that I intend to update my medium-term US CPI forecasts post the release of CPI data for September).
Given that the Fed has been more focused on the core CPI than the headline CPI, a continued moderation in the core CPI should more than offset a spike in the headline CPI in August, supporting current market expectations for the federal funds rate to remain unchanged in September.
Alternative price indicators also point to muted price pressures
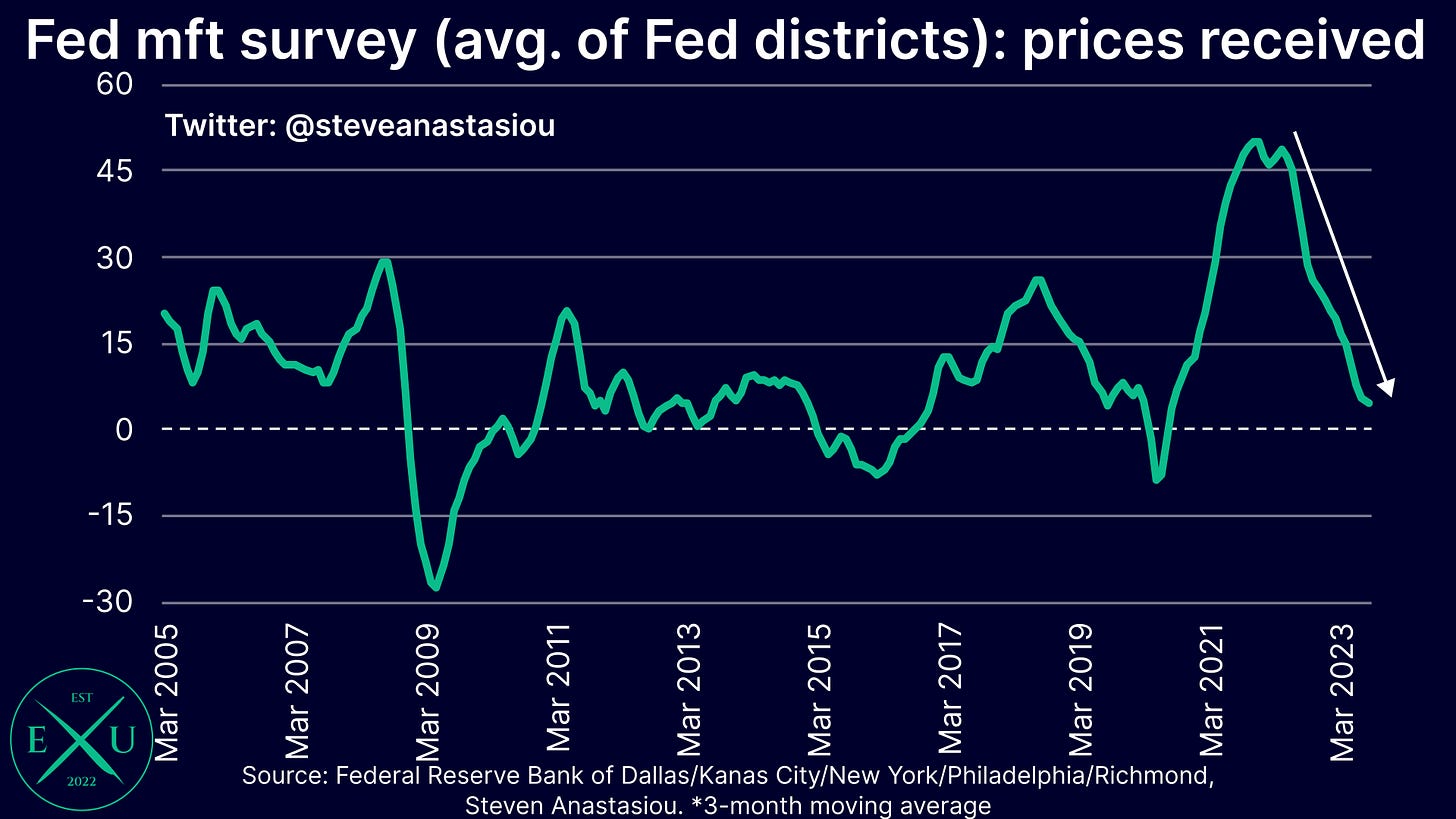
Turning to some alternative price indicators, Fed branch surveys of the manufacturing sector continue to point to muted price pressures.
On a 3-month moving average basis, the prices received component across the average of the Fed branch manufacturing sector surveys declined to a reading of just 4.6 in August — the lowest result recorded since August 2020, and a reading that is below pre-COVID levels.
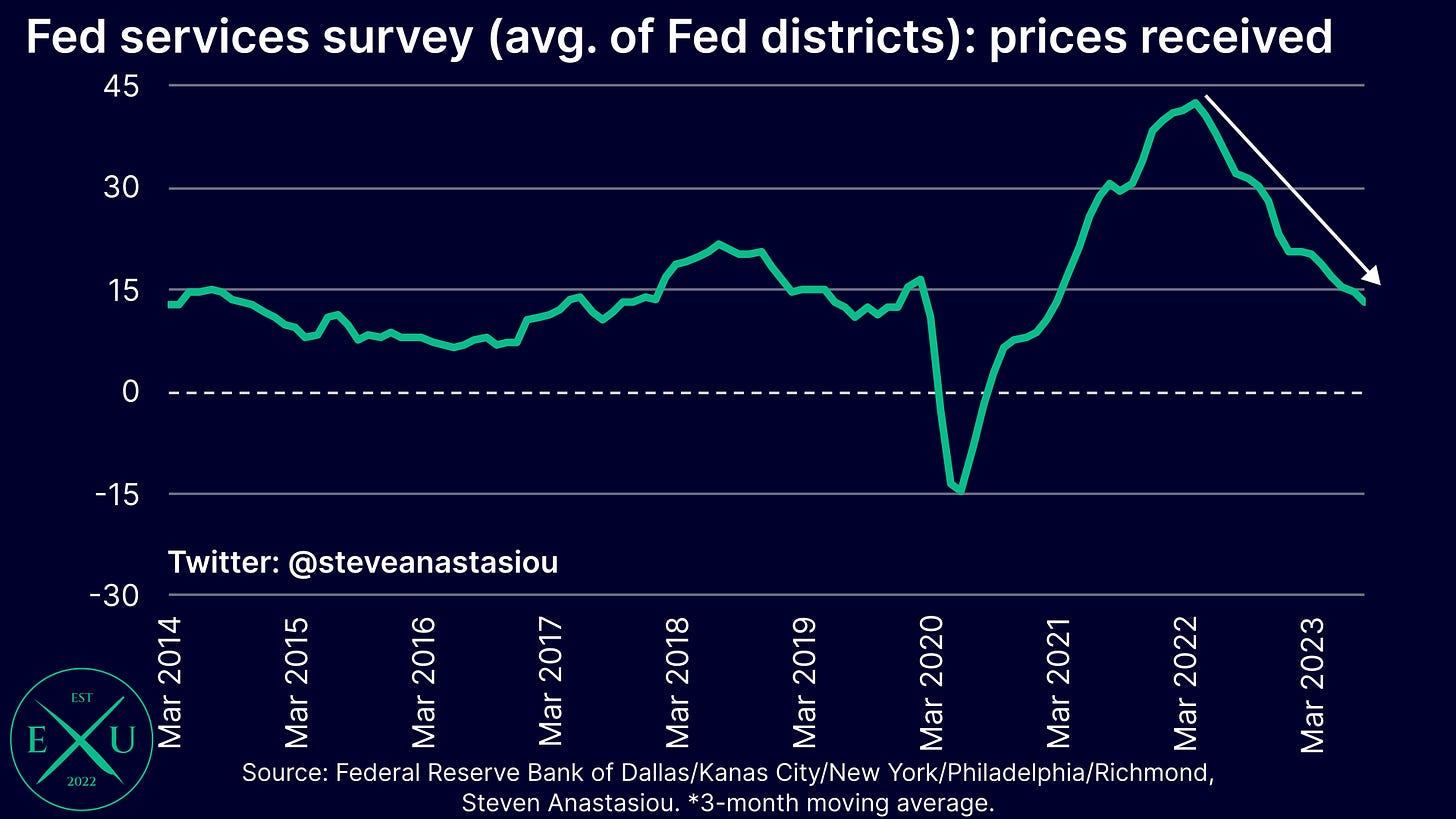
The various Fed branch surveys of the services sector paint a broadly similar trend.
On a 3-month moving average basis, the prices received component fell to a value of 13.1 across the average of Fed branch services sector surveys in August — the lowest level that has been seen since February 2021. Such a reading is also consistent with pre-COVID levels.
Thank you for reading my latest research piece — I hope it provided you with significant value.
Should you have any questions, please feel free to leave them in the comments below!
In order to help support my independent economics research (remember, everything you see — the forecasts, the charts, the analysis, the in-depth explanations of economic history — is all completed independently by me, for you), please consider liking and sharing this post and spreading the word about Economics Uncovered.
Your support is greatly appreciated and goes a long way to helping make Economics Uncovered a sustainable long-term venture that will be able to continue to provide you with valuable economic insights for years to come.
If you haven’t already subscribed to Economics Uncovered, subscribe below so that you don’t miss an update.

