US CPI Medium-Term Forecast Update: Don't rule out multiple rate cuts just yet
Just as markets got ahead of themselves by pricing in a peak of seven 2024 rate cuts in January, the recent string of hotter CPI reports may have caused an overreaction in the opposite direction.
After providing a bonus medium-term US CPI update earlier this month, this latest update is in-line with the regular quarterly publishing schedule.
This report contains:
an in-depth overview of the current economic and policy backdrop;
an in-depth review of the outlook for wage growth;
updates to my medium-term headline, core, headline ex-shelter and core ex-shelter CPI forecasts;
an analysis of my seasonally adjusted monthly core CPI forecasts;
the related implications for Fed policy (including when my forecasts suggest that the Fed may have enough confidence to deliver an initial rate cut, and how many may be delivered in 2024); and
a detailed breakdown of my forecasts across many key CPI subcomponents.
The next report to be released will be a review of the latest GDP, PCE Price Index and personal income data.
Economic & policy backdrop continues to support further disinflation
The US economic and policy backdrop continues to support further disinflation, with the Fed’s significant increases in interest rates and ongoing QT, acting to constrain growth in bank credit and the M2 money supply.
After recording year-on-year (YoY) declines from July 2023-March 2024, bank credit has returned to YoY growth — but at 1.1%, it remains low by historical standards.
The stark moderation in bank credit has been driven by a moderation in both commercial bank loan and lease growth, and securities in bank credit.
Commercial bank loan and lease growth has fallen from a peak of 12.5% YoY in December 2022, to just 2.2% today. This is well below the 2015-19 average of 5.9%, showing that higher interest rates have had a significant impact on lending, though not to an extent that has encouraged an outright deleveraging.
Given that the Fed’s QT acts to mechanically place downward pressure on bank deposits, commercial bank security holdings had seen significant declines. The reason for this, is that in order to fund deposit outflows, banks need to sell assets in order to keep their cash levels stable.
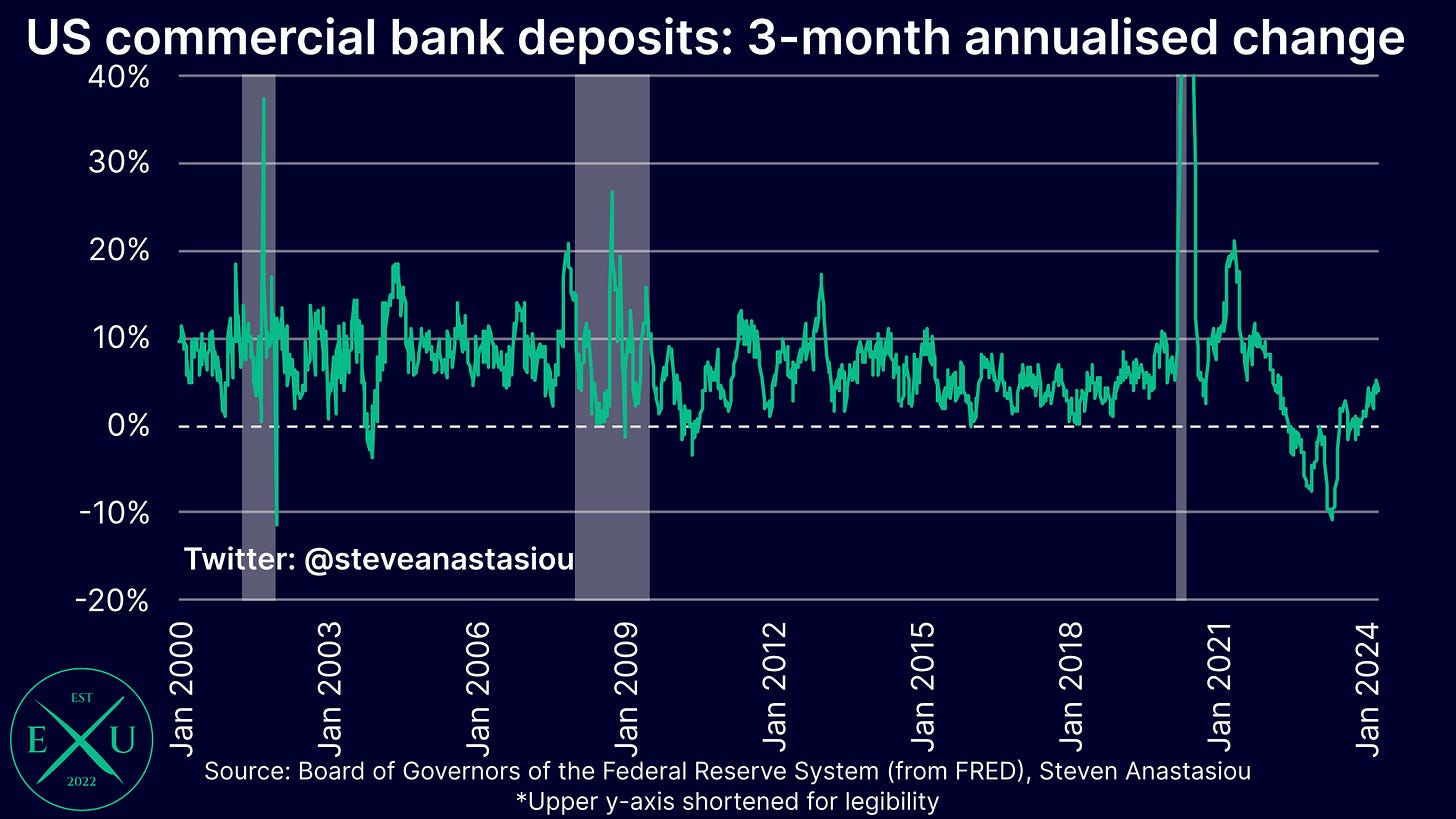
Though more recently, with loan growth remaining positive, and a significant federal government deficit and falling RRP facility combining to pump additional liquidity into the real economy, this has more than offset the Fed’s QT, resulting in commercial bank deposit levels rising over recent months. This has seen YoY growth in commercial bank deposits rise from a trough of -5.3% in April 2023, to 2.0% today. This has coincided with an increase in the level of commercial bank security holdings, which has seen the YoY growth rate rise from -11.3% in August, to -1.5% today. Increases in commercial bank security holdings themselves, also act to place upward pressure on bank deposits and M2.
Focusing more specifically on bank deposits, near-term changes have shown a significant increase in growth, with commercial bank deposits seeing 3-month annualised growth rise to 4.3% and 6-month annualised growth rise to 2.6%.
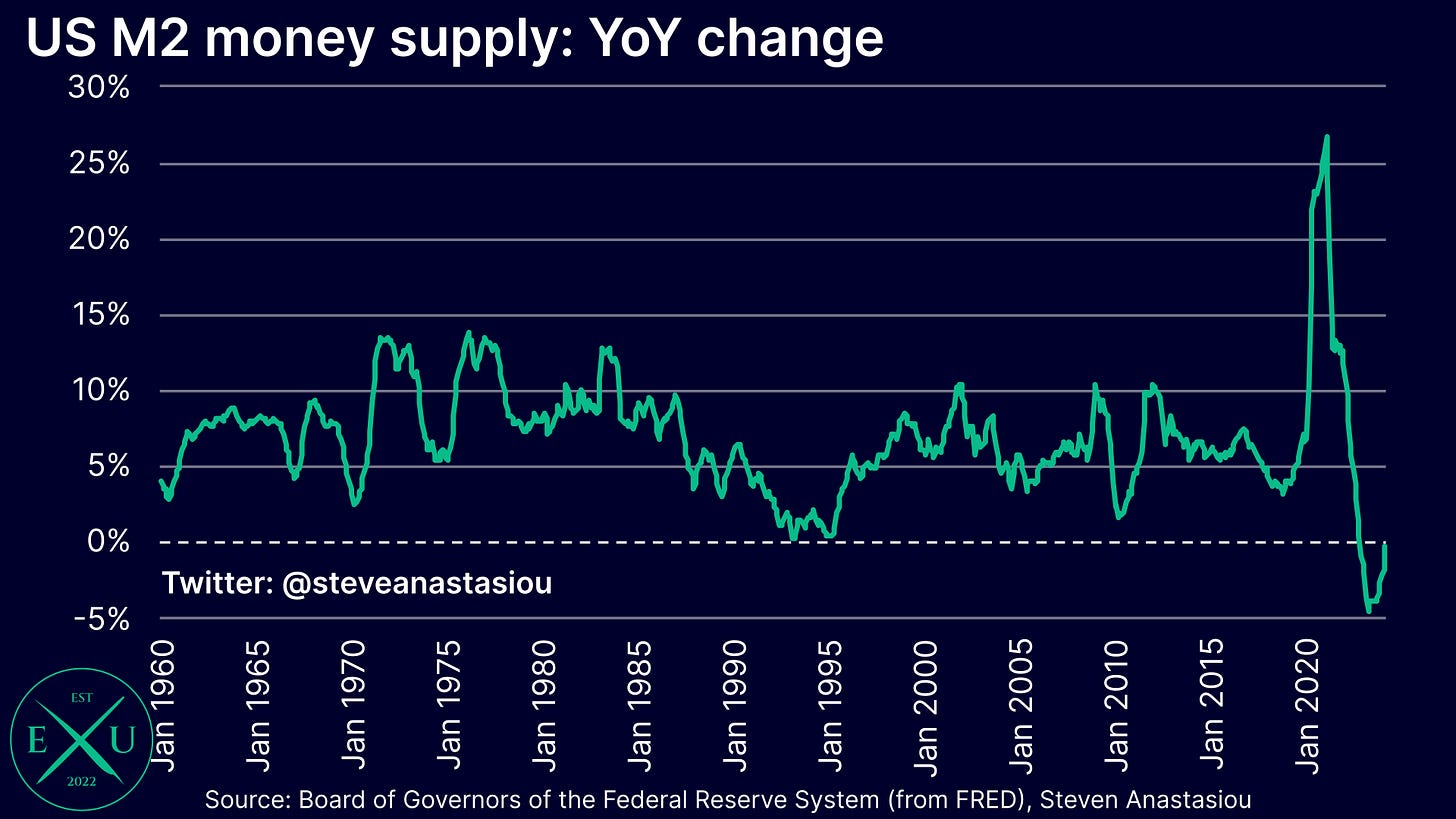
While this is likely to add some support to nominal economic growth, money supply growth is not strong enough to prevent further disinflation from current levels, with annualised M2 growth remaining well below the 2010-19 average YoY growth rate of 5.5%.
In terms of how this has translated to the M2 money supply, growth remained YoY negative in March, at -0.3%. While this is a significant increase from the trough of -4.6% in April 2023, the M2 money supply thus continues to suggest that significant further disinflation lies ahead.
In terms of more recent trends, 3-month annualised growth was 1.7% in March, while 6-month annualised growth was 1.3%. While suggesting that the M2 money supply is thus on track to return to YoY growth in the near future, they both point to a rate of growth that is consistent with further disinflation.
The expectation of continued disinflation based upon negative/relatively low M2 growth, is well grounded in the historical data, which shows that since 1913, the US has not seen relatively high inflation with M2 growth being YoY negative, or at relatively low levels.
With the Fed continuing to keep interest rates elevated, and QT continuing, the policy backdrop thus remains conducive to a moderation in price pressures over the months and quarters ahead.
Solidifying this view are forward indicators of wage growth, which continue to suggest that wage growth is likely to slow over the coming months and quarters.
In March, the Atlanta Fed Wage Growth Tracker fell to 4.7% YoY, its lowest level since December 2021, and down from a cycle peak of 6.7% YoY in August 2022.
While wage growth remains above its 2016-19 average of 3.5% YoY, as shown below, forward indicators suggest that wage growth may return to its pre-COVID range as soon as this year, which is likely to support a material disinflation in services prices.


