Underlying inflation down, but lagging CPI risks a severe recession
Key points:
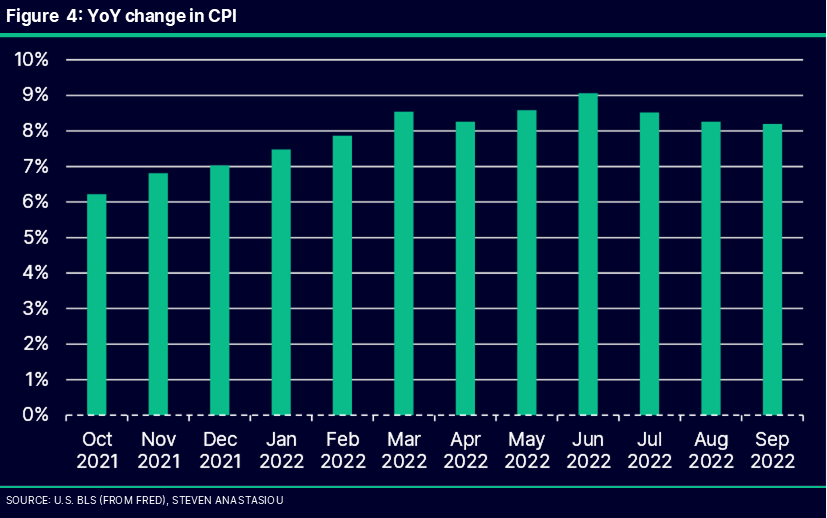
Whilst I continue to expect that June was the likely high water mark for YoY CPI growth, given a low prior comparable, headline CPI remained high in September (+8.2%).
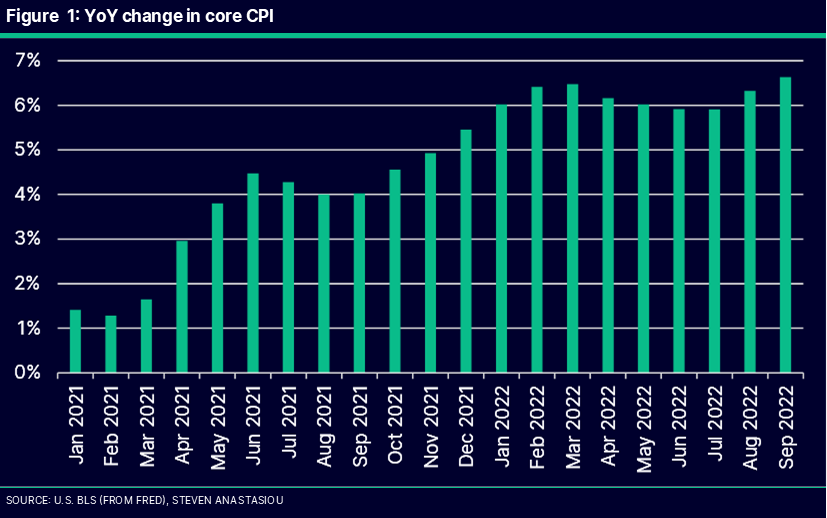
As flagged in my September CPI preview, YoY core CPI reached a new peak of 6.6% for the current high inflation cycle, as the CPI’s lagging measurement of rents continues to play catch-up to actual spot market rents.
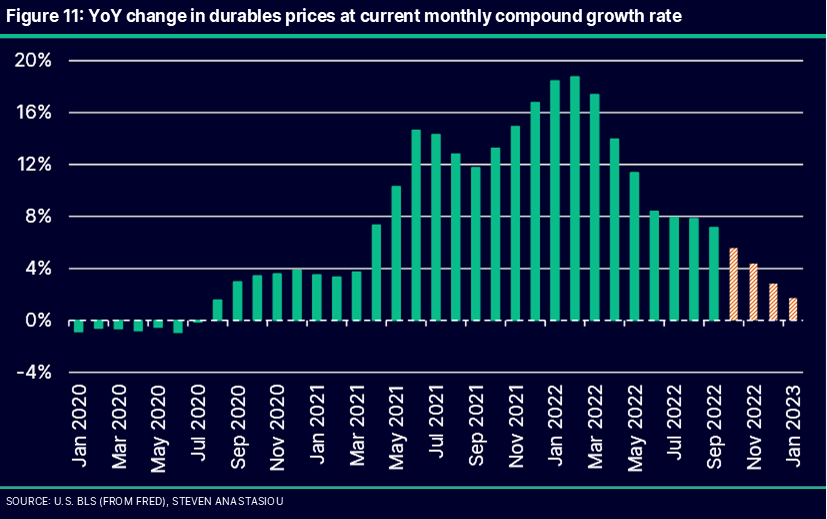
Durables prices plunged 1.1% MoM, and could fall to annual growth of LESS than 2% by January 2023.
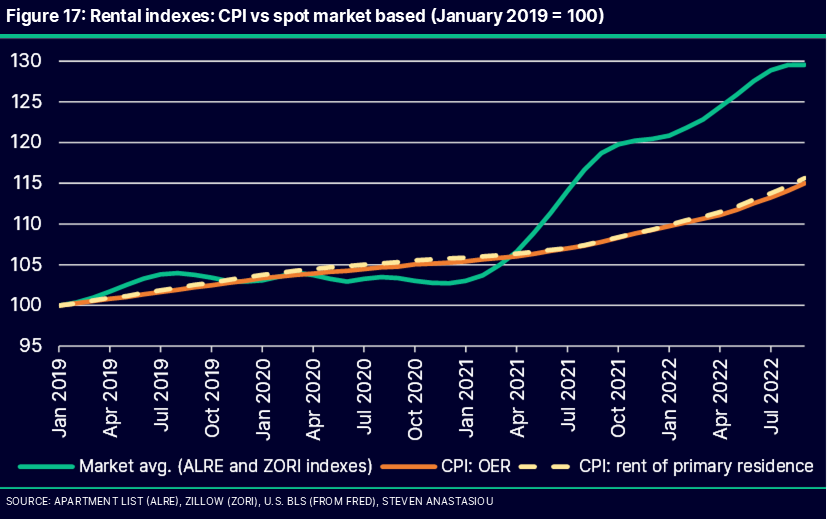
Spot market rents continue to diverge significantly from lagging CPI rental indexes. After significantly UNDERSTATING inflation since May 2021, the CPI is fast approaching the point where it will begin to OVERSTATE underlying inflation.
Just as the lagging CPI and its understatement of inflation contributed to the Fed being too lackadaisical about inflation as it continued for far too long with its extremely loose monetary policy, the reverse of this scenario risks the Fed significantly overtightening monetary policy as it fails to understand that underlying inflation peaked in March 2022. This risks a SEVERE RECESSION.
As flagged, core CPI hits a new peak, while a low comparable keeps headline high
As flagged in my September CPI preview, core CPI reached a new year-on-year (YoY) peak for the current high inflation cycle of 6.6%, up from 6.3% in the prior month (Figure 1).
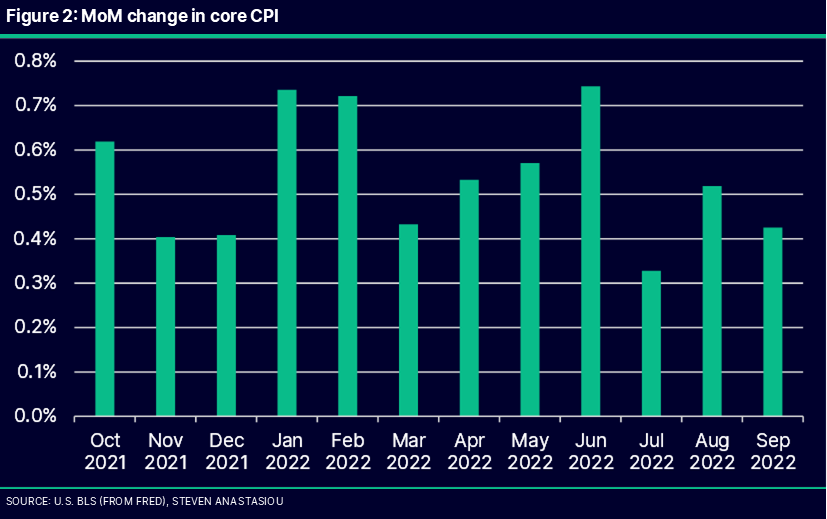
This came alongside a MoM increase of 0.4%, which was below the previous compound monthly growth rate of 0.5% over the prior 6 months (Figure 2).
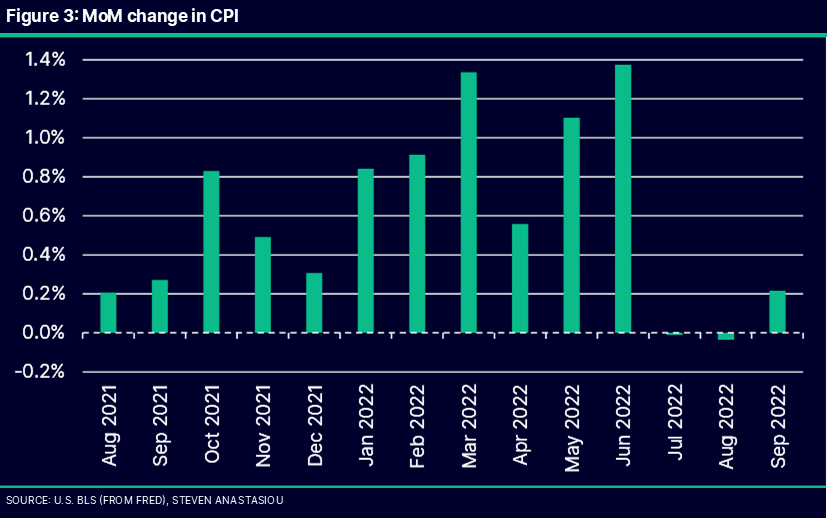
Turning to the headline CPI, after recording two negative MoM results, September saw a modest MoM gain of 0.2% (Figure 3). All three months were supported by lower oil/gasoline prices. Though because of relatively low prior comparables in August and September, the YoY rate has remained high, falling only modestly from 8.5% to 8.2% (Figure 4).
Durables led inflation to the upside and is now leading it lower
I have previously noted that the current high inflation has been marked by widely different price increases between the key categories of durables, non-durables and services.
Much of the reason behind this has to do with COVID dynamics, which caused individuals to drastically increase their spending on durable goods whilst they were locked down in their homes, and had stimulus checks to spend. Durables thus led the current high inflation cycle.
Services, which were the last area to see demand growth as the world returned to a sense of normality, combined with the lagging measurement of rents in the CPI, meant it was the last category to see price growth.
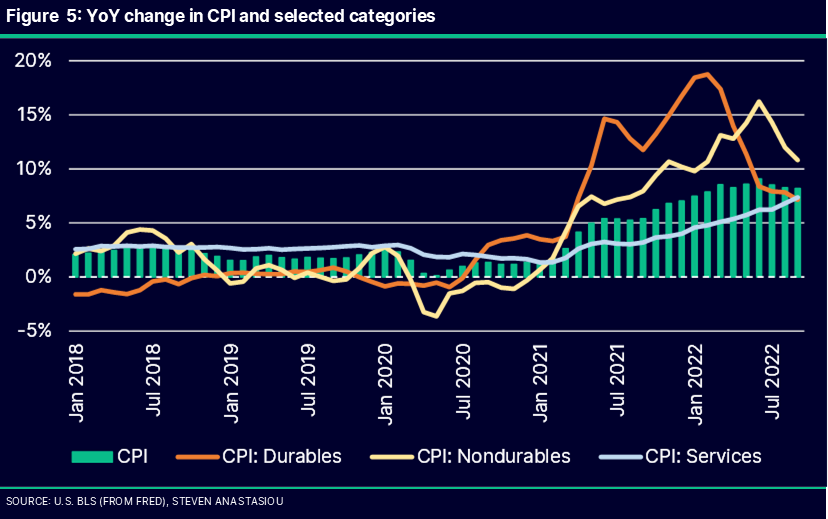
When looking at the three categories, we can see that a very interesting crossover has now occurred - YoY durables prices have fallen BELOW the rate of increase in services prices for the first time since August 2020 (Figure 5)!
What does this mean? Clearly it means that durables prices are decelerating BUT this likely also has BIG ramifications for inflation as a whole.
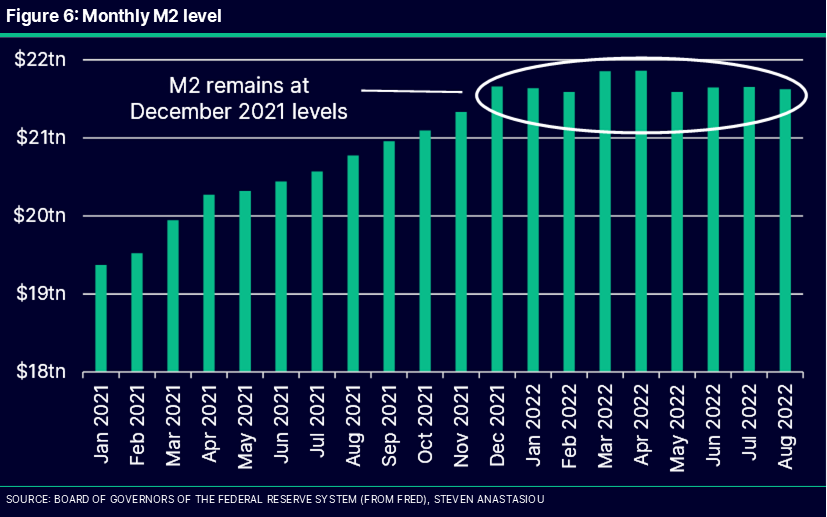
Just as durables led the current inflation, it is likely to be a harbinger of lower overall inflation ahead. Why? Because when the money supply is held constant (Figure 6) there is no longer additional demand pressure on prices. Instead, as prices rise whilst M2 is held flat, real income & demand will fall in order to reach a new equilibrium (for those who want more information on this phenomenon, see my previous research piece here). We are now in the early stages of this economic correction.
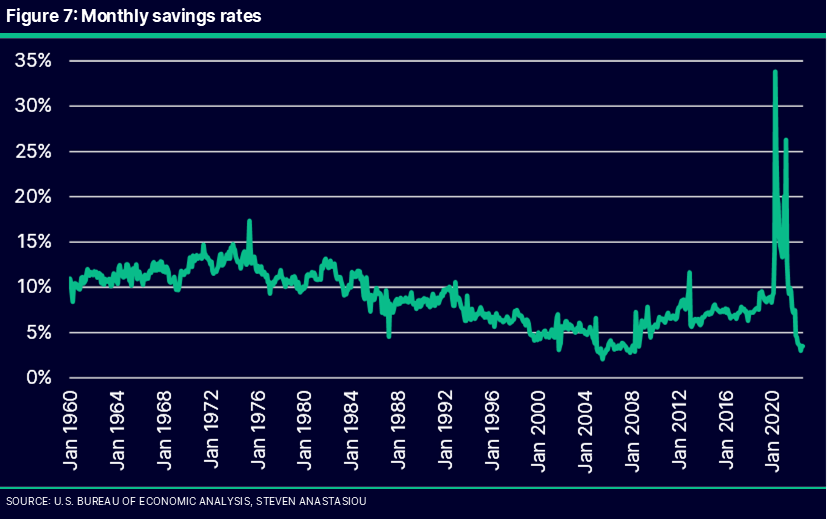
With people suffering from growing financial stress — which we can see from plunging savings rates (Figure 7) and extreme growth in credit card debt (Figure 8) — they are likely to first cut their consumption of unnecessary junk, particularly when they have gone on a goods spending binge over the past two years. In order to clear their inventories, businesses will need to lower their prices. This is exactly what we are seeing.
Once economic conditions deteriorate further/the correction increases in strength, we would then expect to see a spillover into decelerating nondurables and services prices - the reverse of how the current high inflation eventuated. For liquid market items like durables, the deceleration in prices can play out VERY quickly.
YoY durables price growth could fall below 2% by January
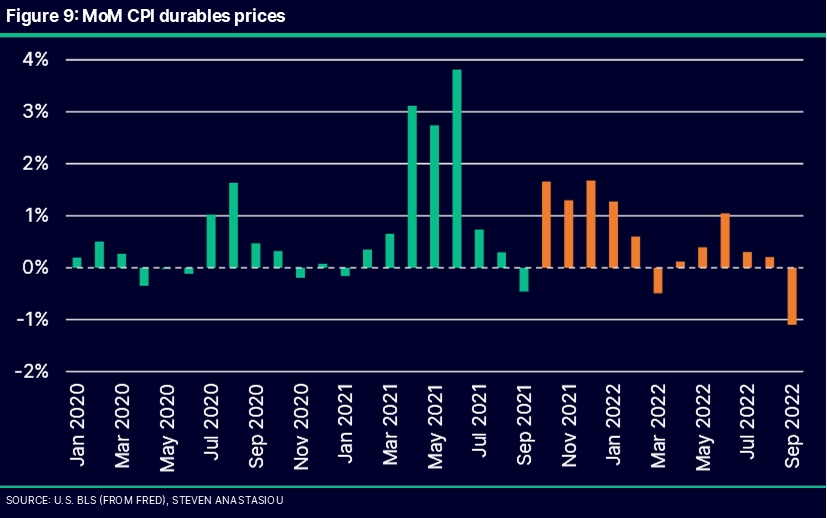
Whilst I noted the possibility of a temporary jump in YoY durables prices in September given a large negative comparable, MoM durables prices plunged, falling 1.1% (Figure 9), more than doubling the fall seen in the prior year.
This provides significant further evidence that durables prices are quickly returning towards historical trends as real demand is being pressured by falling real incomes.
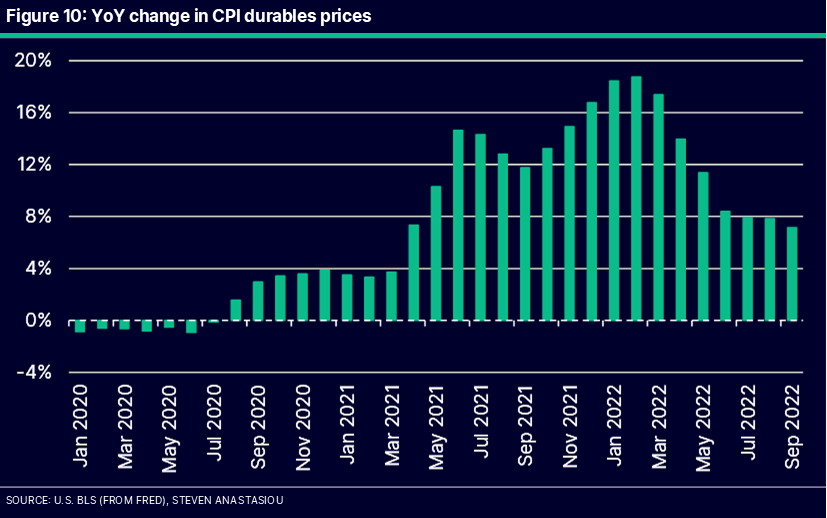
The large MoM fall saw the YoY durables growth rate fall from 7.8% to 7.1% (Figure 10).
If the current monthly compound growth rate over the past 6 months (0.16%) is continued, and as higher comparables are cycled from October to January (Figure 9), the YoY durables growth rate will fall below 2% by January 2023 (Figure 11).
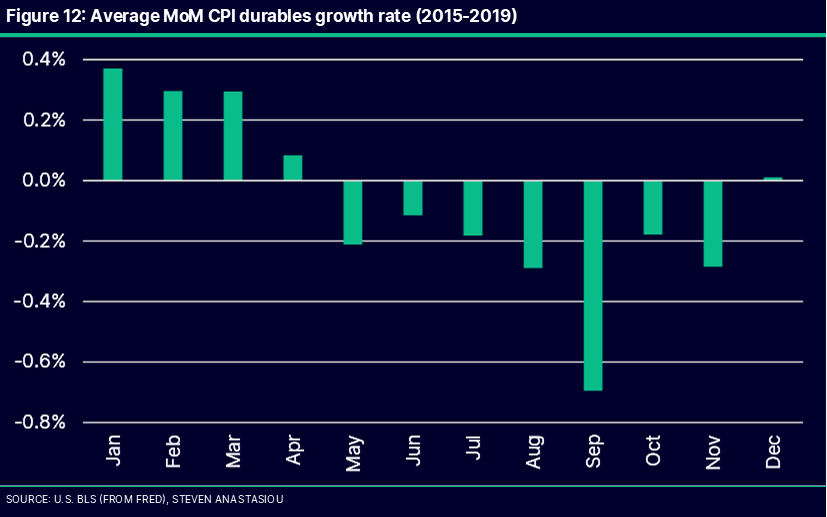
Making this more likely to be achieved, is that durables prices have tended to exhibit significant seasonality. Across 2015-19, MoM durables price changes were lowest across May-November, where on average, they recorded negative price changes (Figure 12).
With decelerating price momentum strengthening in September, there would thus appear to be significant potential for October and November to record negative MoM price changes. If this occurred, then durables prices could fall WELL below 2% by January.
Nondurables benefit from lower fuel prices, plenty of downward oil price pressures remain
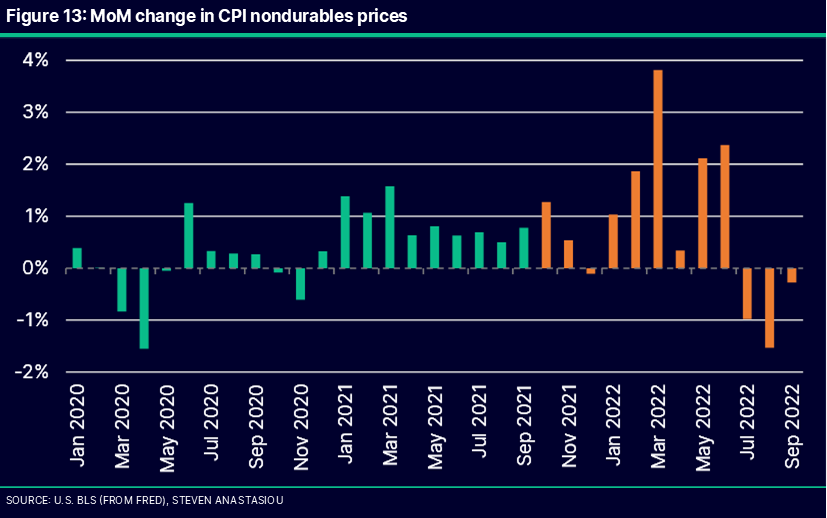
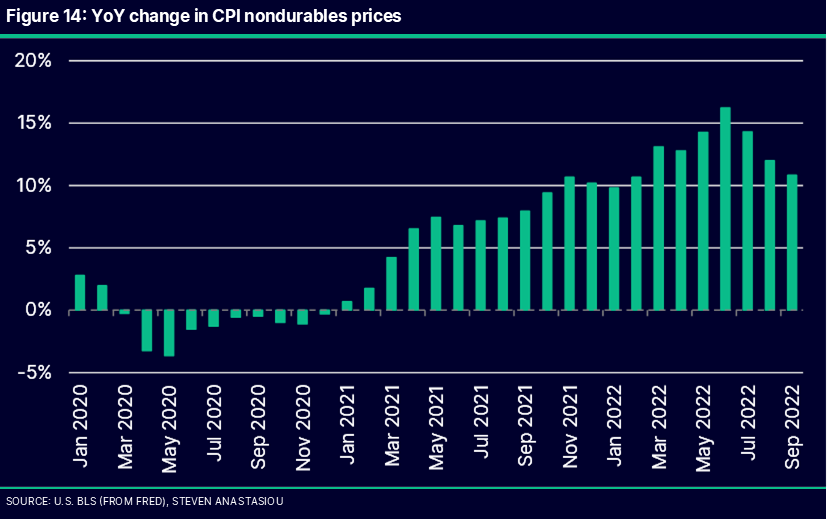
Nondurables prices recorded a 3rd straight decline in September (Figure 13) after another decline in gasoline prices. The YoY rate of nondurables price growth has now fallen from a peak of 16.2% in July to 10.8% in September (Figure 14).
While the benefit of lower oil and gasoline prices has been at least temporarily used up, as gasoline prices have so far moved slightly higher in October, there are plenty of reasons that point to oil prices remaining around current levels, as opposed to seeing another near-term surge higher.
Such reasons include an ongoing commitment to a zero-COVID policy in China and continued SPR releases from President Biden. OPEC production cuts also indicate that the current demand & supply dynamic may not be as supportive as some energy bulls believe. Combined with a continued weakening in the US and European economies, there are plenty of signs that point towards oil prices remaining pressured in the near-term.
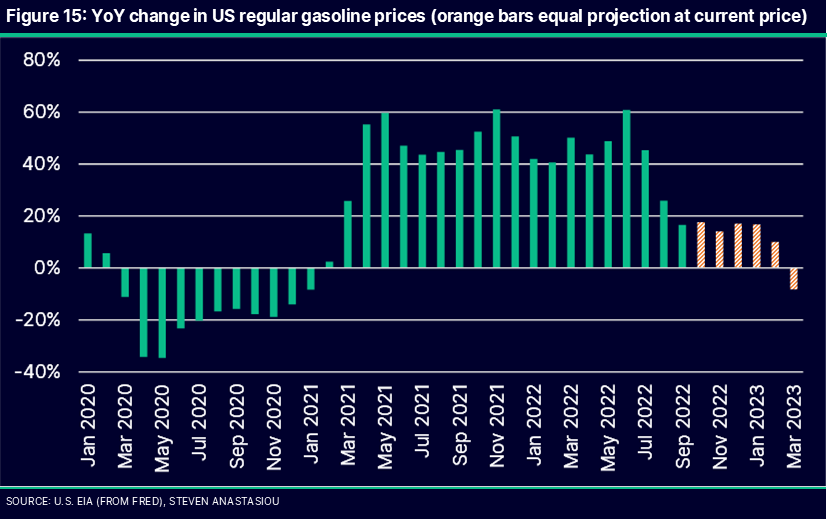
If gasoline prices are able to simply maintain their level as at 17 October, as opposed to falling further, this will have very important implications for inflation, as YoY gasoline prices would turn negative by March 2023 (Figure 15).
Food prices rise by less than 1% MoM but remain elevated
I noted in my CPI preview that some positive signs were being seen in primary food commodities, which have declined from peak levels. Given this backdrop it was important to see if there were signs of this flowing through to the CPI’s food index.
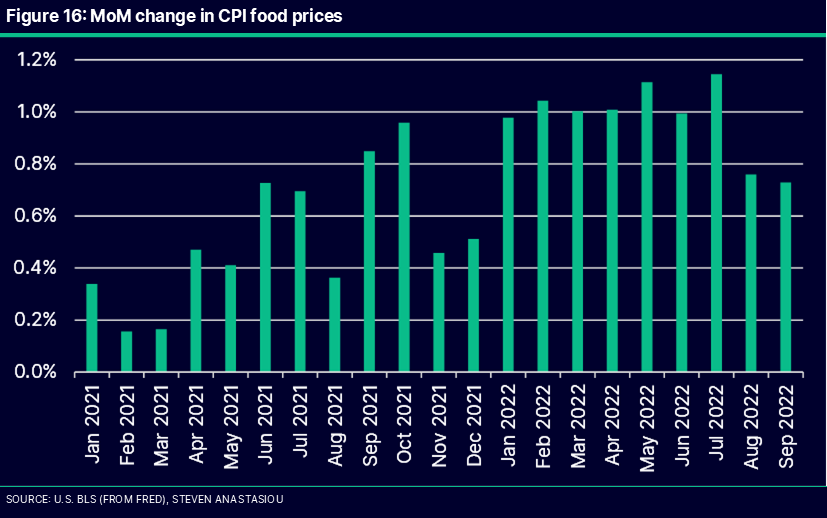
Whilst MoM CPI food price growth was below 1% for the second consecutive month (the first time this has occurred since December 2021), food prices continue to grow at a fast rate, increasing by 0.7% MoM (Figure 16).
Though given a higher comparable in September 2021, this was enough to reduce the YoY growth rate from its August peak. Another high comparable will be cycled in October, and then again from January to July 2023. As long as primary food commodity prices continue to trend lower, a YoY peak in food prices is likely to be reached by December (at the latest).
Lagging rents push core CPI to a new record & there could be higher peaks to come
While I have been continuing to state that headline CPI likely peaked in June, the equation is very different for the “core” CPI, which has an ENORMOUS allocation to shelter costs.
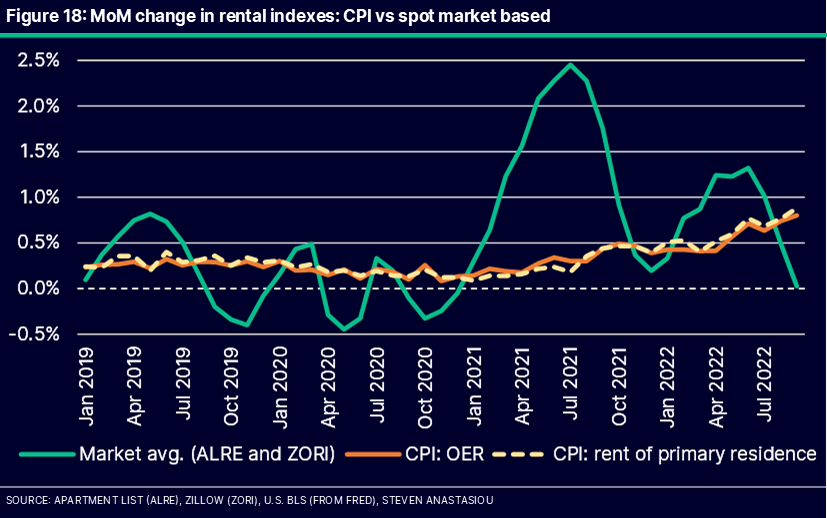
We know that the CPI’s lagging measurements of rent will lock-in significant growth in CPI shelter costs for many months to come. Since January 2019, spot market measures of rents have increased by 12.6% more than the CPI’s owner’s equivalent rent (OER) index (Figure 17).
This is despite OER recording a MoM gain of 0.8% in September versus a 0.0% gain for the average of the Apartment List and Zillow indexes (Figure 18).
Given that the core CPI will be cycling MoM changes of 0.6%, 0.4% and 0.4% over the next three months, there remains a significant chance that a NEW YoY peak in the core CPI is recorded sometime within the next three months. If the core CPI records MoM changes of 0.5% in each of the next three months, then a new YoY peak of 6.8% will be recorded in December. Whether a new peak is reached or not, it is nevertheless likely to remain at high levels.
Summary: underlying inflation trends lower, but high core CPI risks overtightening and a severe recession
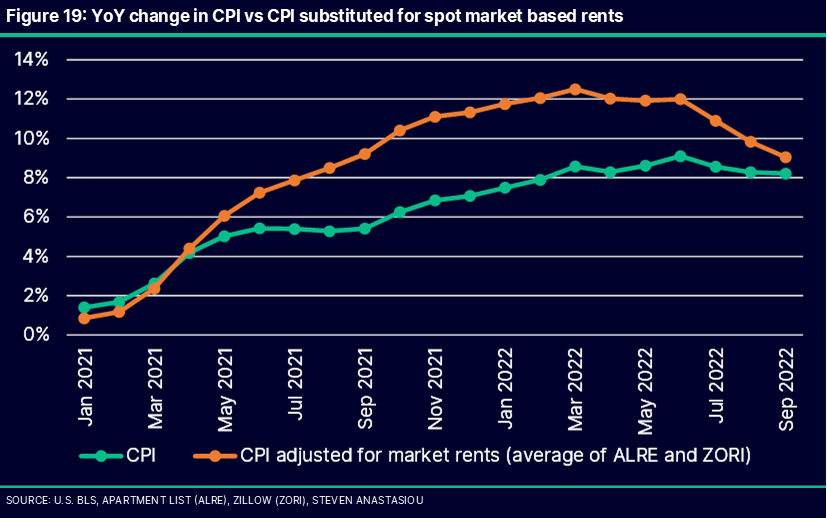
In summary, it is clear that underlying inflation peaked many months ago, and continues to decelerate significantly. We are seeing this in both durables prices, and market rents. The lagging rental measurement in the CPI is now creating a situation whereby the CPI will likely soon begin to SIGNIFICANTLY OVERSTATE underlying inflation (Figure 19).
This is the opposite of what occurred from May 2021, whereby underlying inflation was significantly UNDERSTATED by the lagging CPI, as it continued to report modest rental growth whilst underlying spot market rents were SURGING.
Just as this contributed to the Fed failing to adjust its policy stance, and to adopt the belief that inflation was merely “transitory”, as the opposite process now plays out, it is likely to result in the Fed significantly overtightening. This is likely to be exacerbated by the Fed’s misguided belief that the core CPI is a better measure of inflation, given that the core CPI has a higher weighting to shelter costs.
I hope that you enjoyed and found value in my latest update! Over the weeks ahead I intend to release a detailed inflation forecast, analyse a potential timeline for a Fed pause & pivot, and detail the ways in which this could affect certain asset classes.
In order to receive my upcoming research as soon as it is published, please ensure that you are subscribed to my newsletter, and are following me on Twitter.
If you too believe that everybody deserves to have access to high-quality, institutional grade research, as opposed to just high net worth individuals, hedge funds & asset managers, then please consider sharing this latest article to help ensure that these important insights can be viewed by as many people as possible - thank you!


