Signs of a significant weakening are now being seen in the US jobs market
While the US jobs market continues to appear relatively robust, a deeper look at December's data reveals several signs that point to material weakness emerging.
Executive summary
While overall nonfarm payroll growth remains relatively solid and the unemployment rate remains relatively low, a thorough analysis continues to show that the strength of the US jobs market continues to moderate.
In addition to the gradual moderation in strength that has been seen over many months, some signs of more material weakness were also seen in December.
Key points to consider, include:
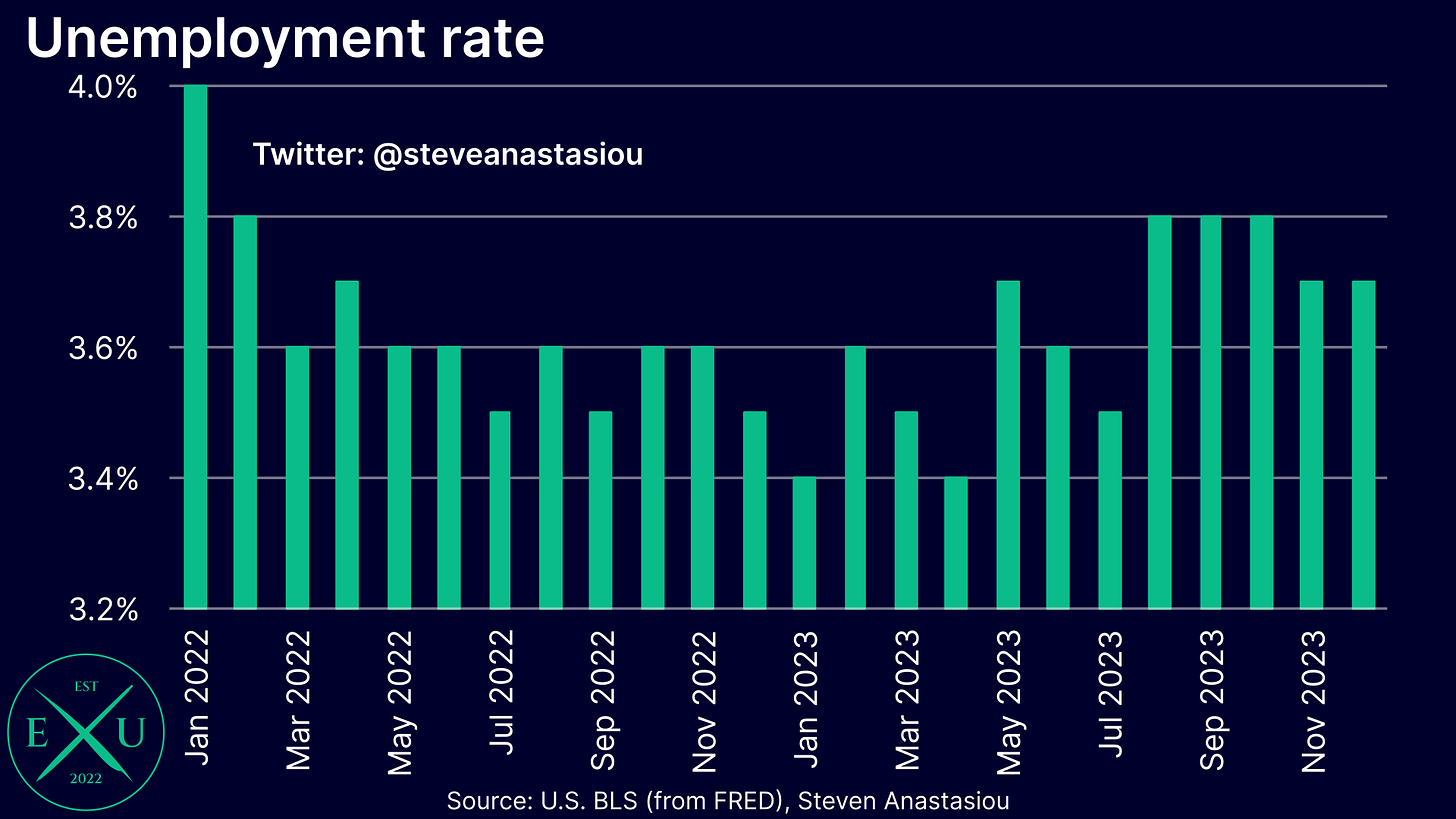
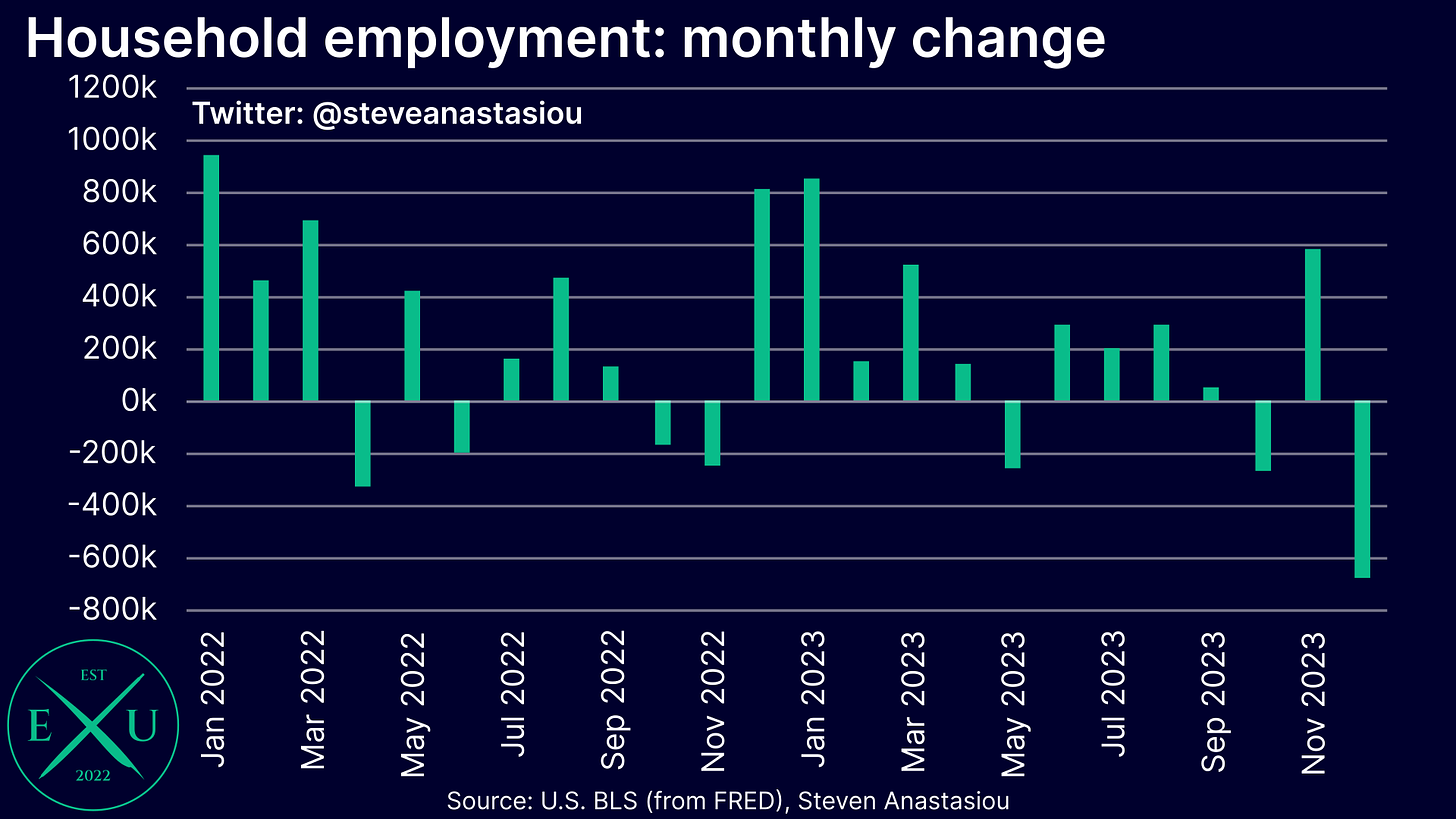
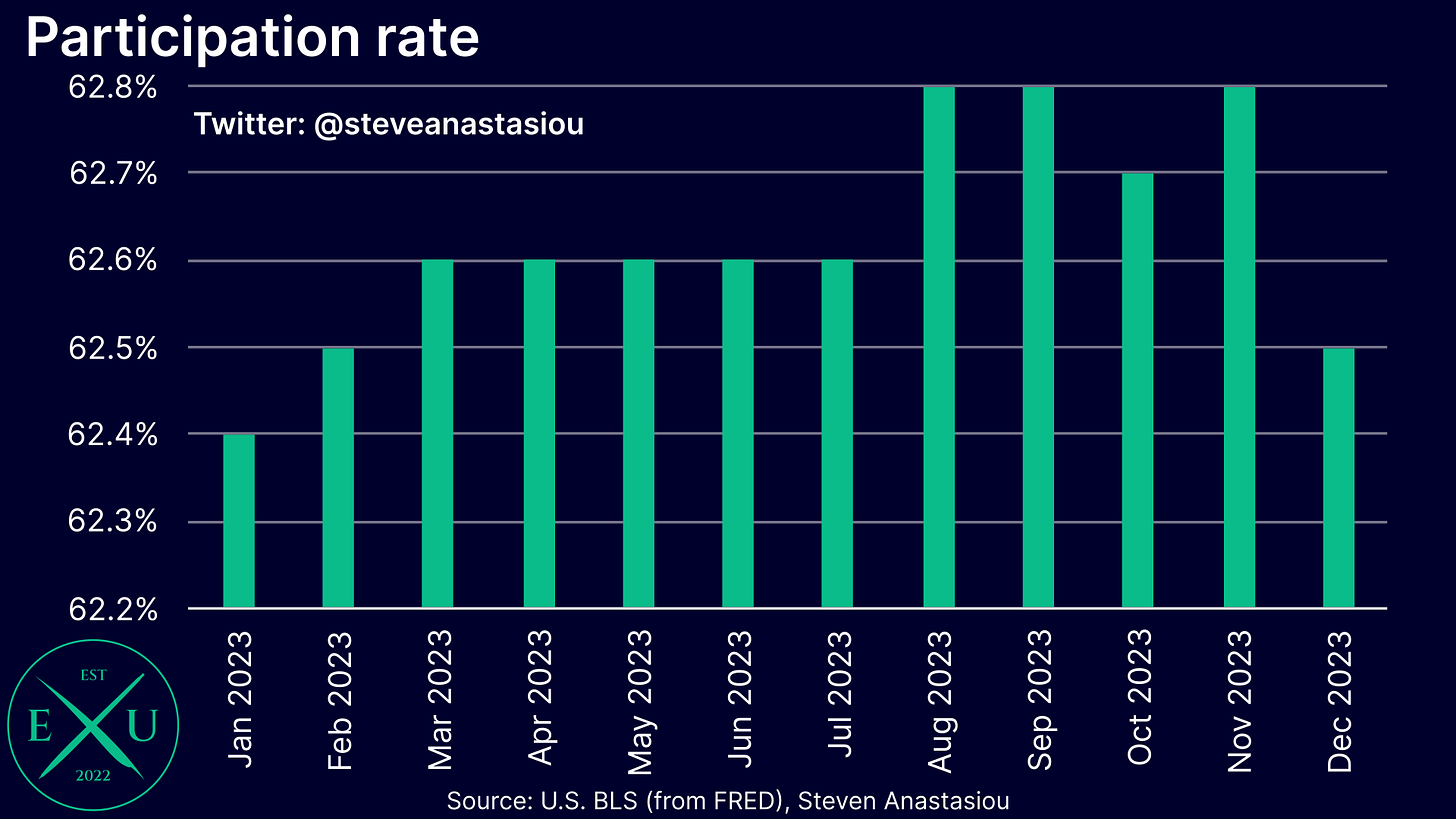
While the unemployment rate remained at 3.7%, household survey employment plunged — only a significant drop in the participation rate kept the unemployment rate stable.
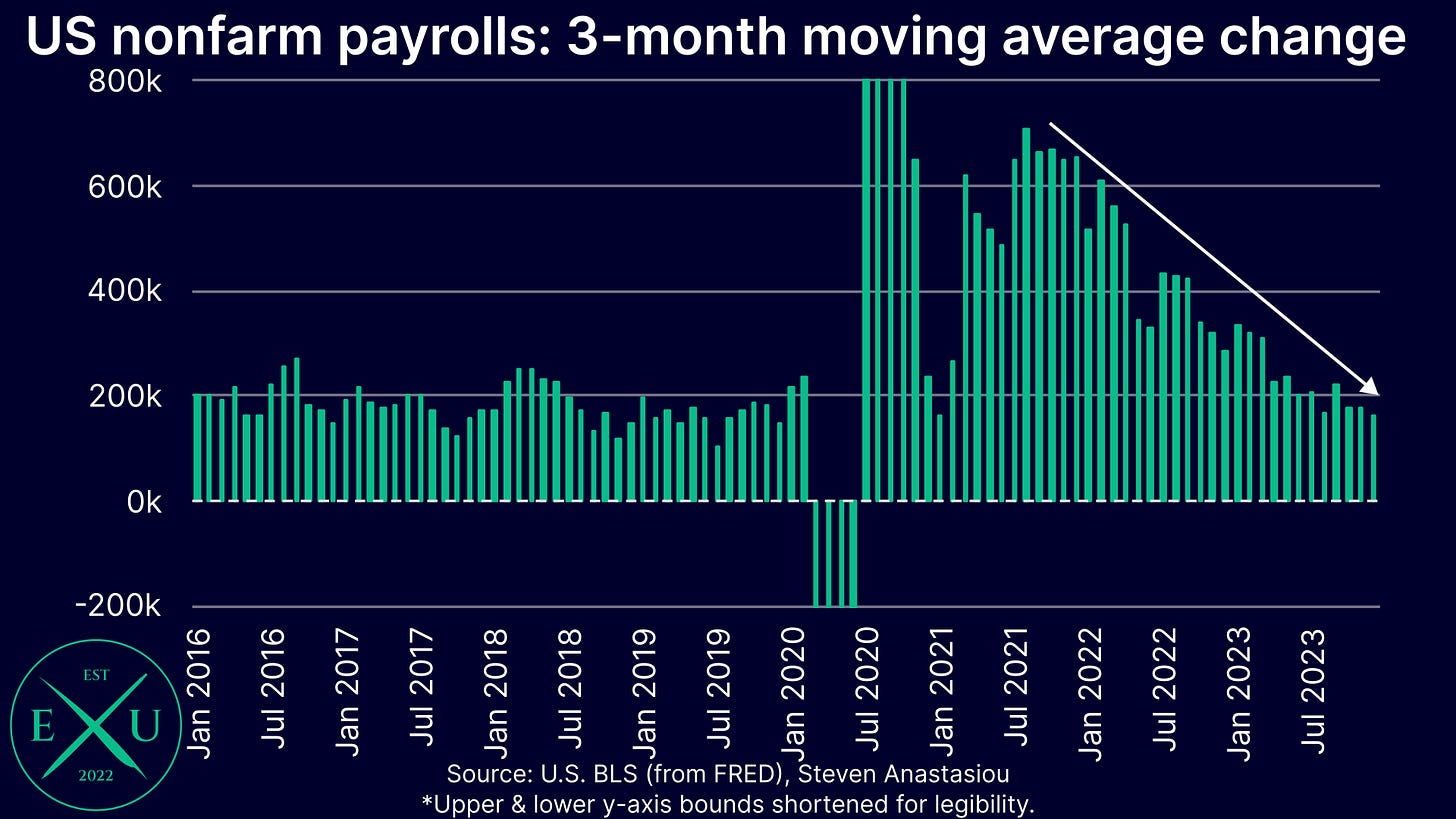
While still recording relatively solid growth, in light of significant downward revisions to prior nonfarm payrolls, 3-month moving average nonfarm payroll growth fell to its lowest level since January 2021.
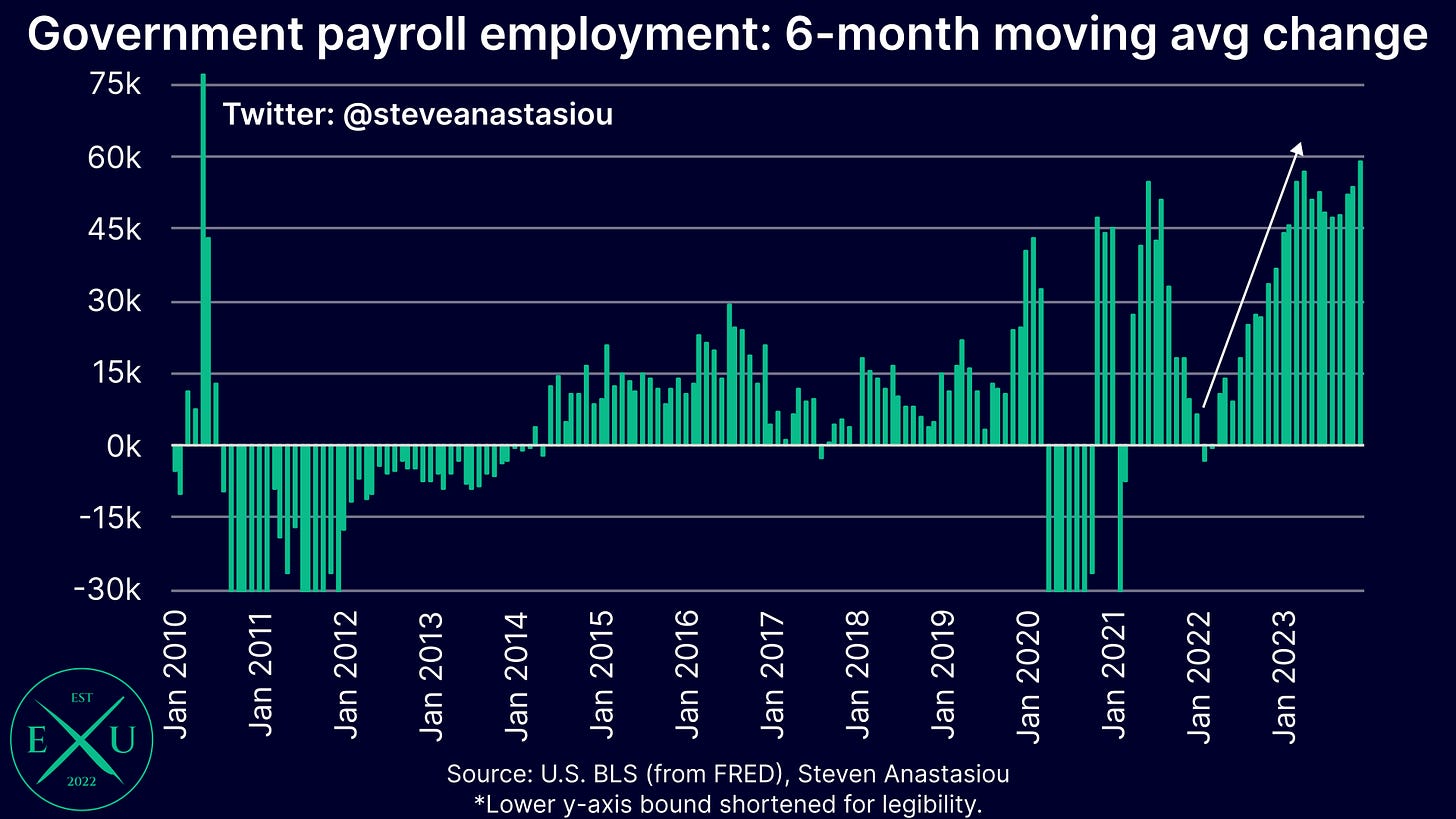
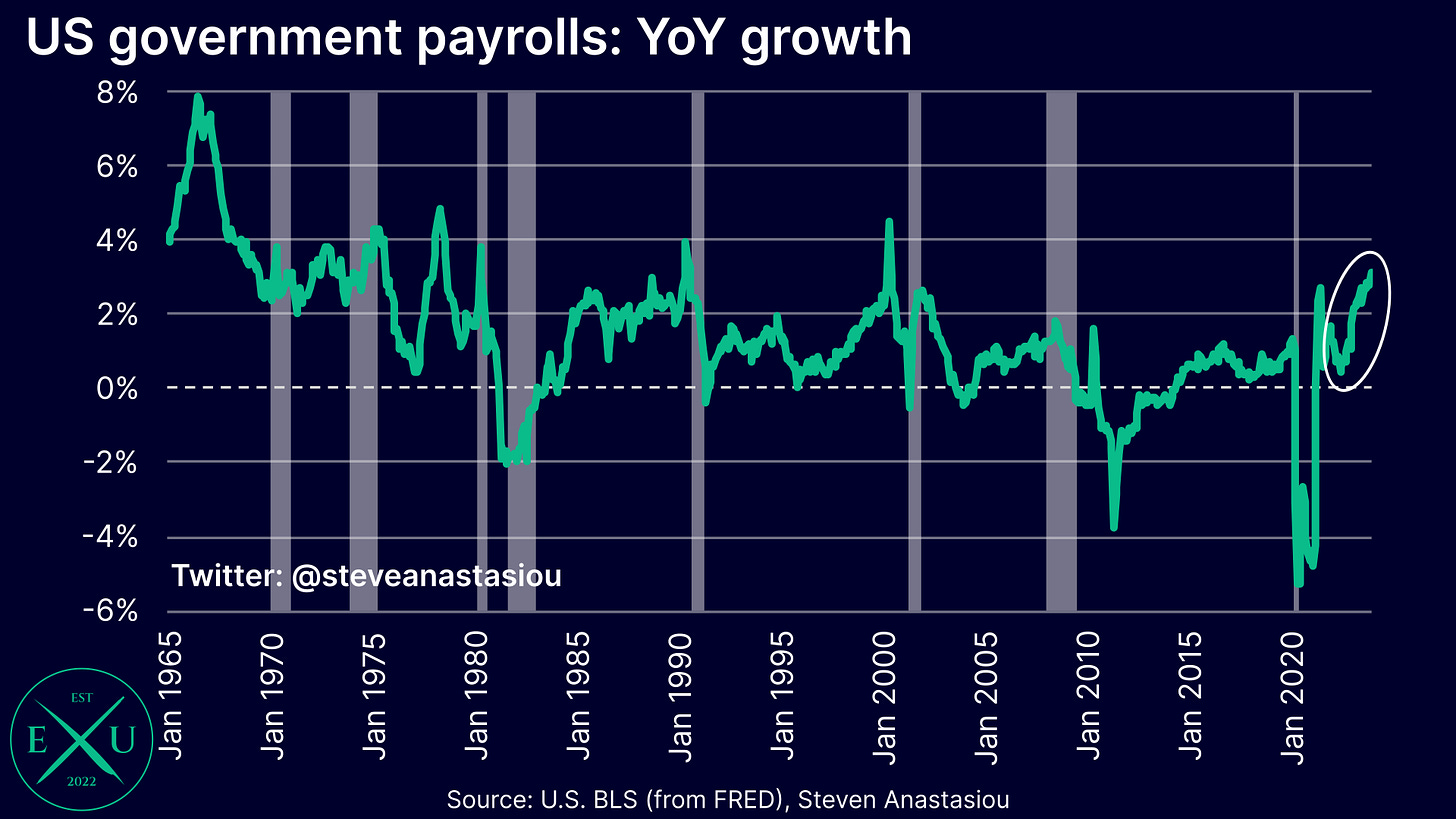
Further still, overall nonfarm payroll growth continues to be propped up by government payrolls, with 6-month moving average growth rising again in December, resulting in growth remaining at levels that haven’t been seen since the aggressive hiring associated with the 2010 census.
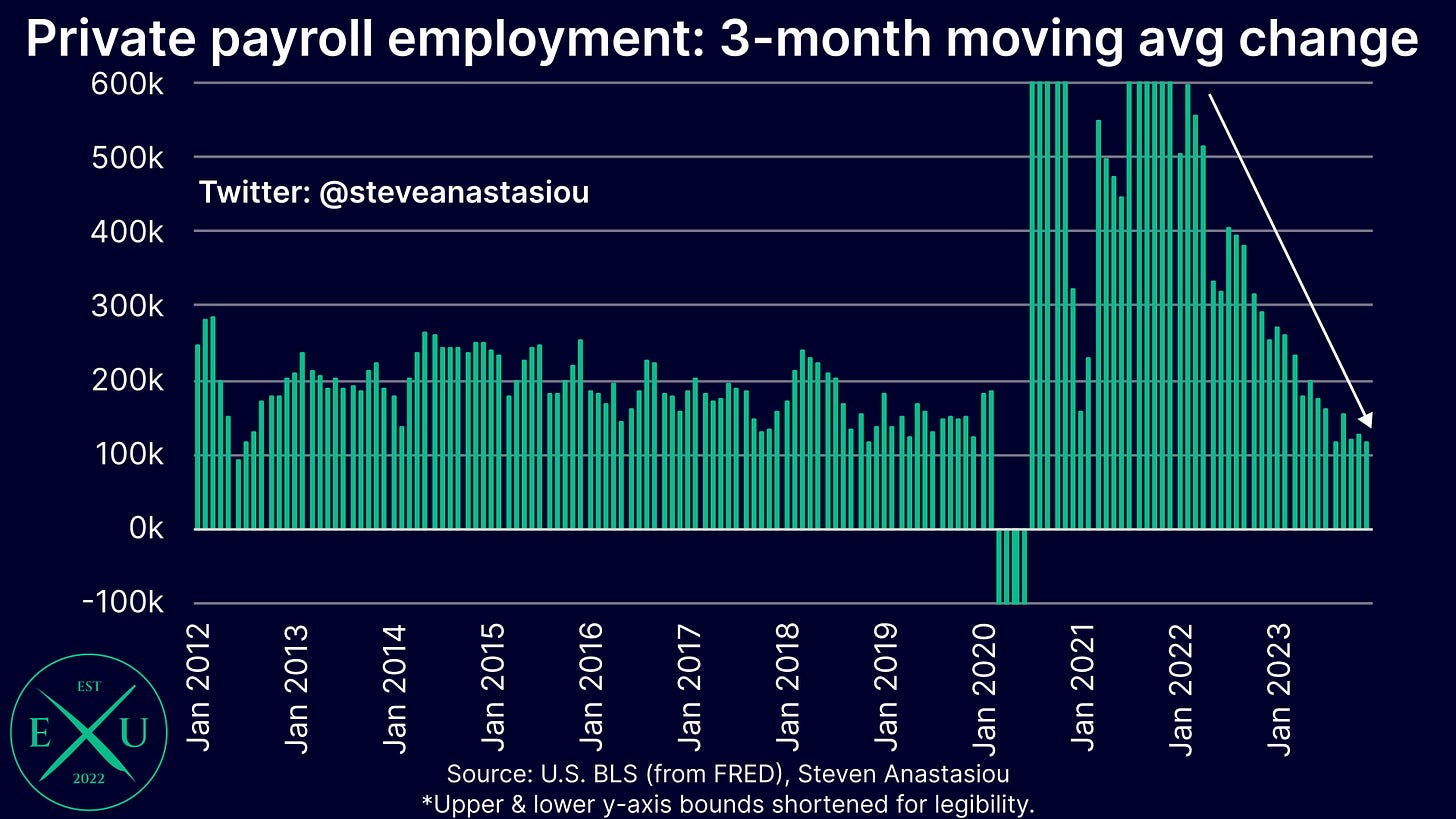
Meanwhile, excluding the COVID lows, 3-month moving average private nonfarm payroll growth fell to its lowest level since July 2012.
6-month annualised full-time employment growth turned significantly negative, with this generally being a more timely recession indicator than other job market metrics.
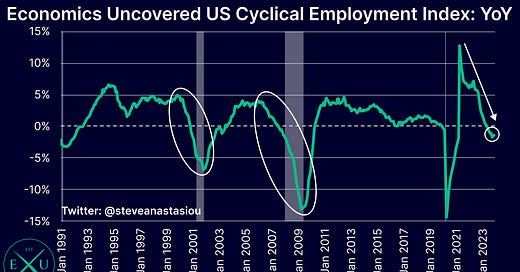
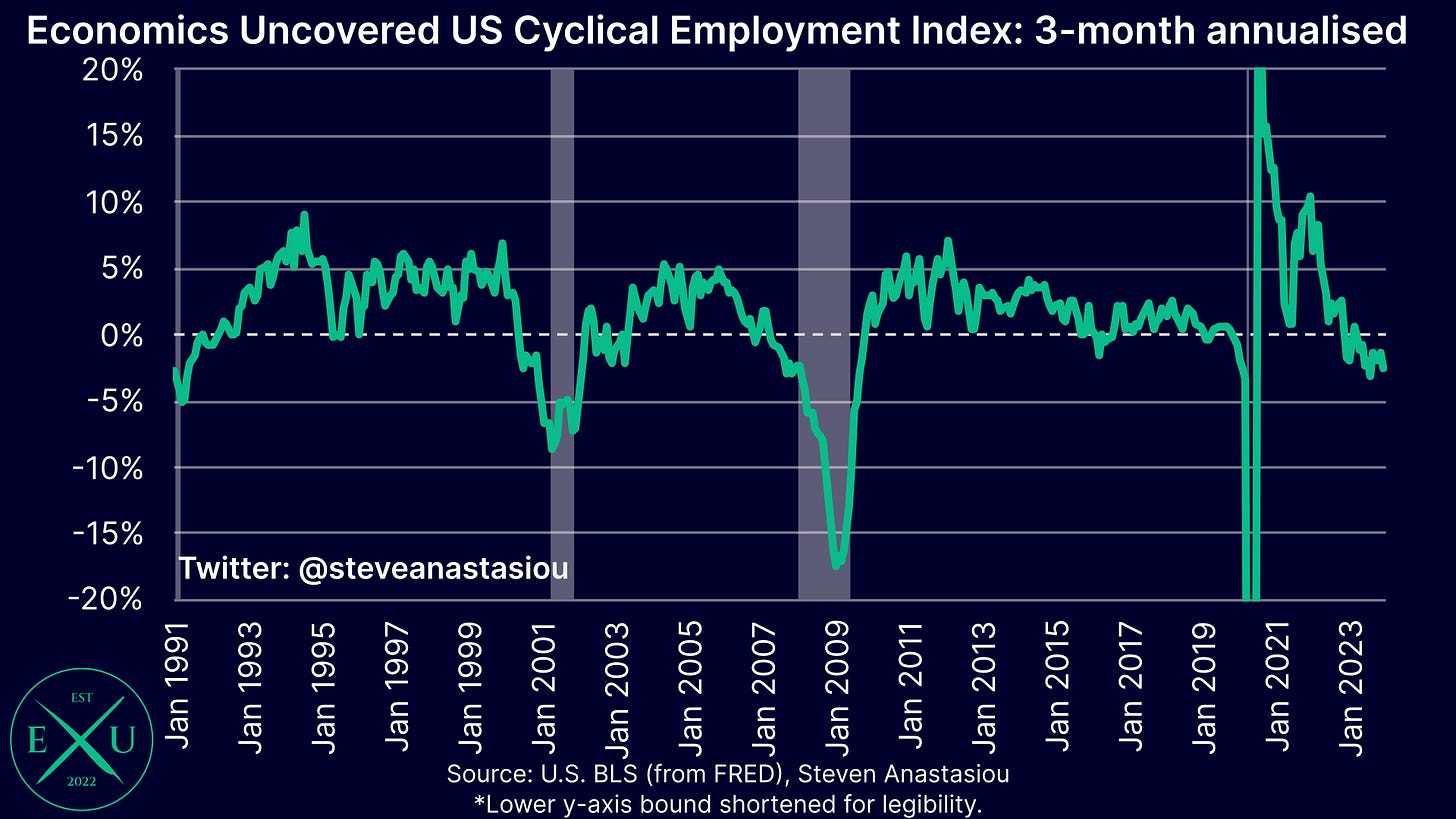
The Economics Uncovered Cyclical Employment Index (a leading indicator) declined for a third consecutive month, with annual growth falling to -1.3% in December.
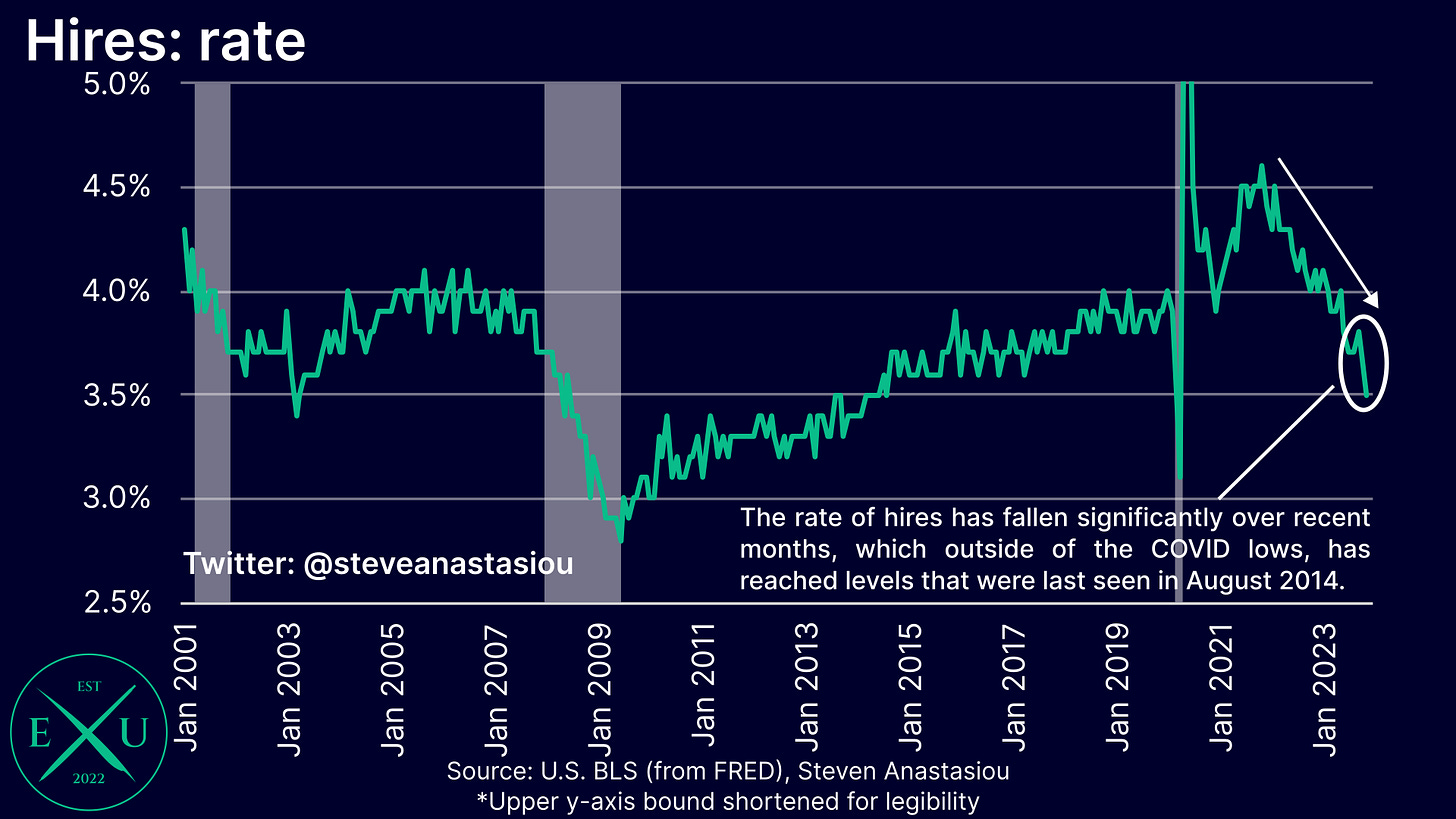
The hiring rate saw another significant decline, which outside of the COVID recession, fell to its lowest level since August 2014.
While layoffs and initial claims remain relatively low, this is typically a lagging indicator. Given the prior difficulties that employers had in reaching their desired staffing levels during the prior economic upswing, they are now likely to be particularly reluctant to layoff staff, which is likely to make layoffs an even more lagging indicator during the current economic cycle.
Despite another broad moderation in job market indicators, 3-month annualised growth in average hourly earnings rose to its highest level since August, highlighting a significant economic readjustment that is occurring — being a shift back to real average hourly wage growth and lower corporate profit margins. The lagging nature of hourly wage growth is important to understanding this shift.
Unemployment rate remains at 3.7%, but only because of a sharp fall in the participation rate
The unemployment rate remained at a relatively low 3.7% in December, which was only modestly higher than where it began 2023.
While the unemployment rate held steady, there was a major decline in the household survey’s measure of employment, which fell by 683k in December. This follows an increase of 586k in November, and a decline of 270k in October, marking a particularly volatile three months.
What prevented a material rise in the unemployment rate in December, was a relatively significant MoM fall in the participation rate, which dropped from 62.8% in November, to 62.5% in December. This is the lowest participation rate that has been seen since February.
Nonfarm payroll growth continues to decelerate, but remains at solid levels
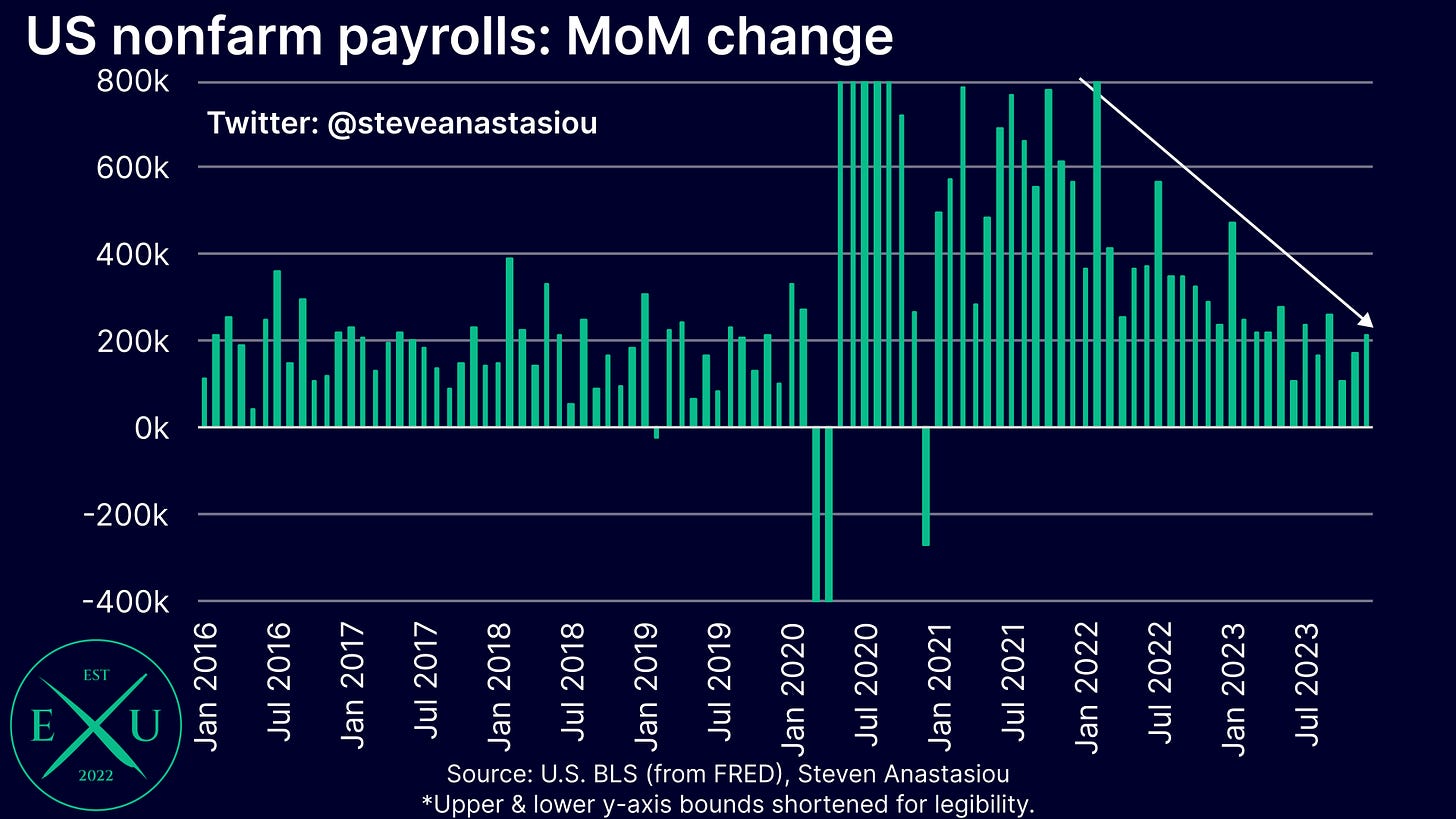
While household employment recorded a large decline for the second time in the past three months, nonfarm payrolls (which are measured by the establishment survey), saw another month of solid growth, rising by 216k in December, following a downwardly revised increase of 173k in November.
Though with October’s nonfarm payrolls also revised lower (by 45k), 3-month average growth fell to 165k, marking the smallest increase since January 2021.
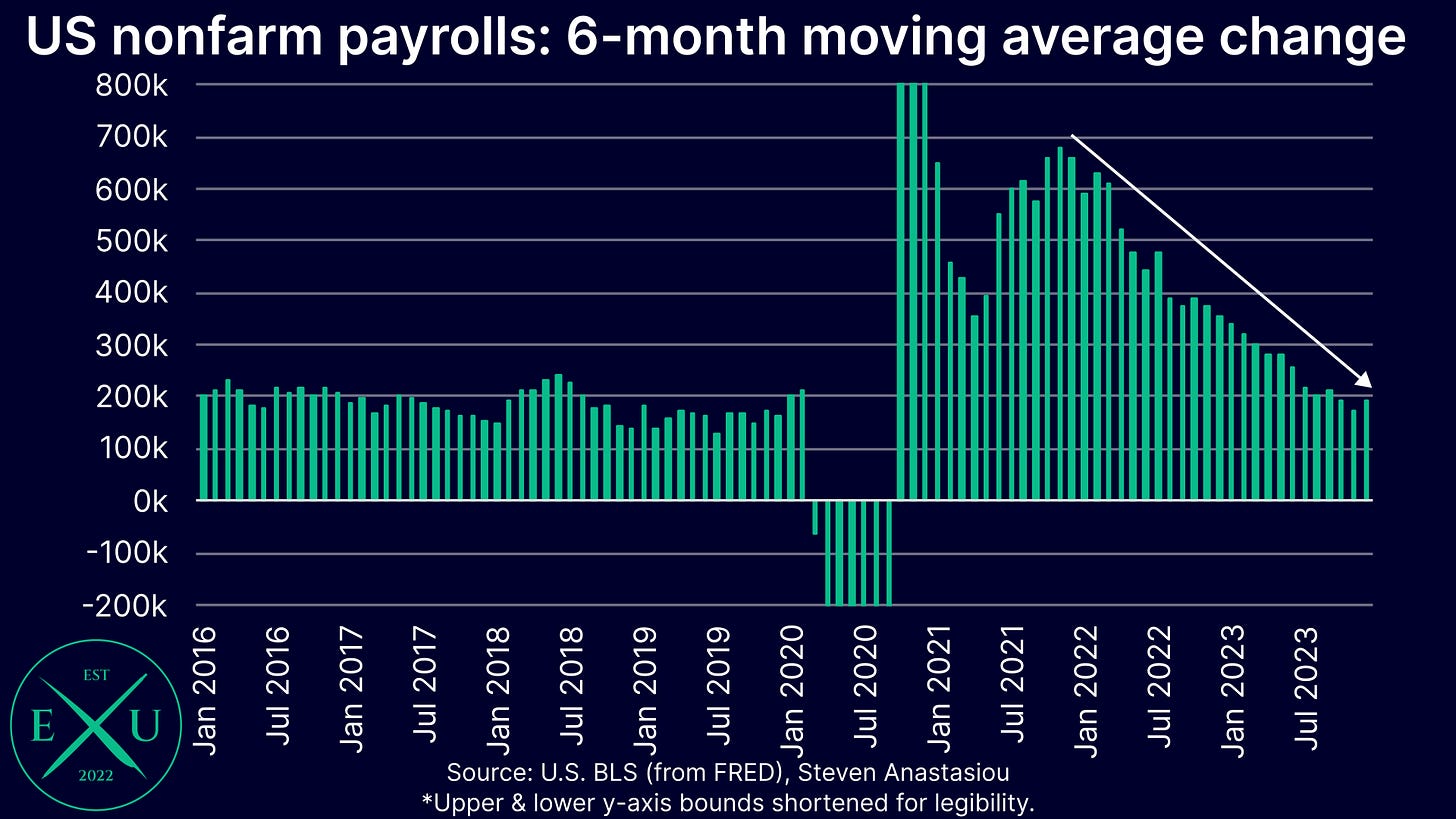
6-month average growth rose slightly to 193k, reverting back to levels seen in October, which is broadly consistent with pre-COVID growth rates.
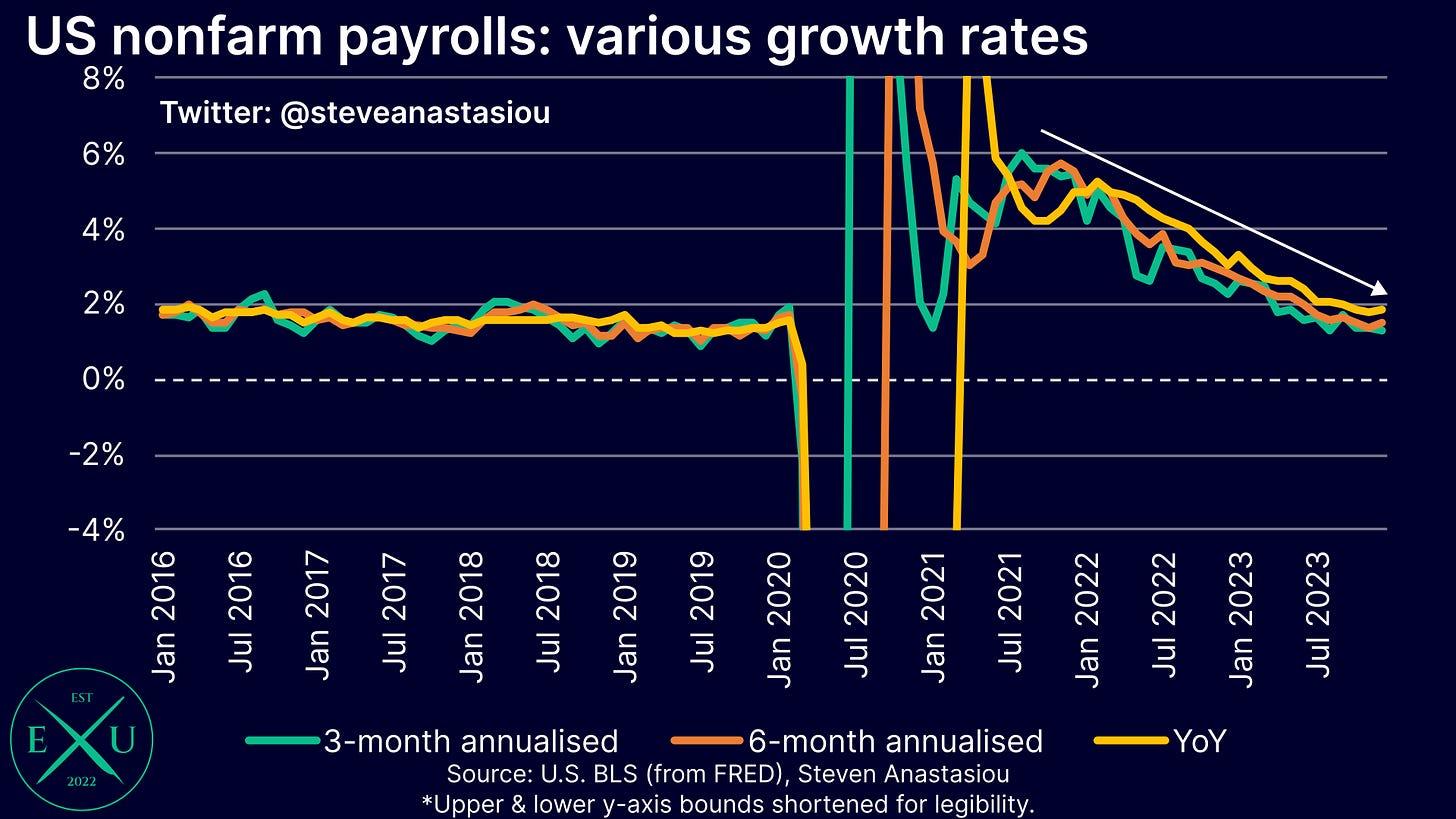
While annual nonfarm payroll growth rose slightly to 1.9% (which remains slightly above its pre-COVID level), 3-month annualised growth fell to 1.3%.
While slowing significantly, headline nonfarm payroll growth ultimately continues to remain at relatively solid levels — but this doesn’t tell the full story.
Government jobs continue to strongly support nonfarm payrolls
With another 52k jobs added in December, government payroll growth continues to strongly support overall nonfarm payroll growth.
On a 6-month moving average basis, government sector job growth rose to 59k, marking the highest rate of growth that has been seen since May 2010 (77k), which was a period that benefited from census hiring.
YoY growth has now increased to 3.1%, which marks the highest rate of growth that has been seen since May 2000.
3-month moving average private payroll growth falls to a very modest level
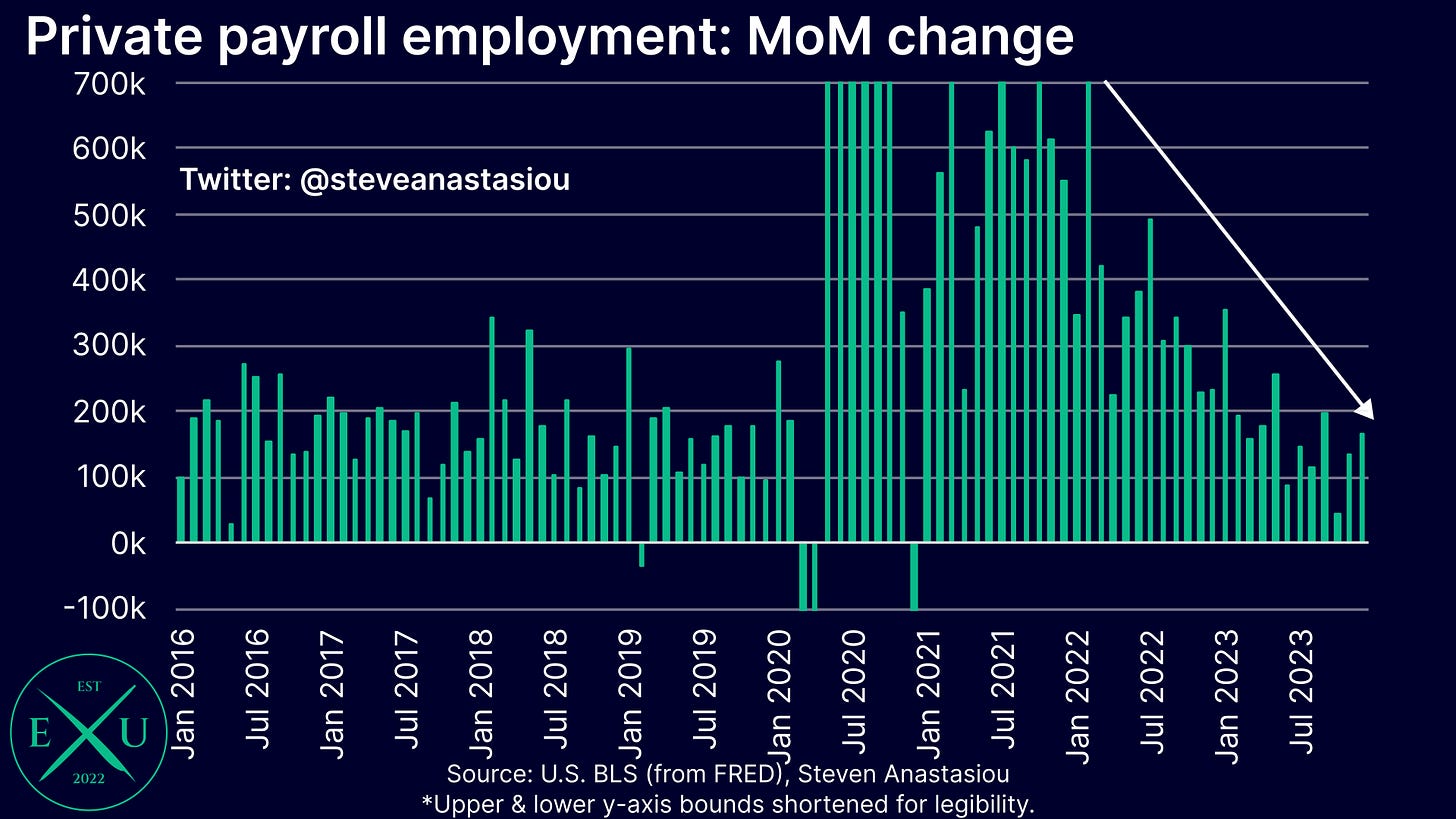
While 164k private payrolls were added in December, growth remains in a clear downtrend.
Excluding the COVID period, 3-month average growth fell to its lowest level since July 2012.
Annual nonfarm payroll growth remained at 1.6%, which is largely in-line with pre-COVID levels, but more recent trends suggest this will weaken over the months ahead — 3- and 6-month annualised growth is currently 1.0%, and 1.2%, respectively.
While private payroll growth remains in a clear downtrend and has fallen significantly, growth has not yet fallen to levels that constitute cause for imminent recession concerns, with more robust overall nonfarm payroll growth helping to fuel current widespread soft landing expectations.
Full-time employment turns negative on a 6-month annualised basis
Further emphasising the significant weakening that has taken place in the jobs market, is the decline in full-time employment, with 6-month annualised growth turning materially negative in December. While not having a 100% strike rate, this has historically been a very good recession indicator.
Cyclical employment continues to suggest that the jobs market will weaken further
A key leading indicator of the employment market, being the Economics Uncovered Cyclical Employment Index, also continues to suggest that a further weakening of the jobs market is likely.
Given downward revisions to prior monthly data, the Economics Uncovered Cyclical Employment Index saw its third consecutive MoM decline, recording an annual growth rate of -1.3% in December.
Meanwhile, 3-month annualised growth fell to -2.5%.
Job openings continue to moderate
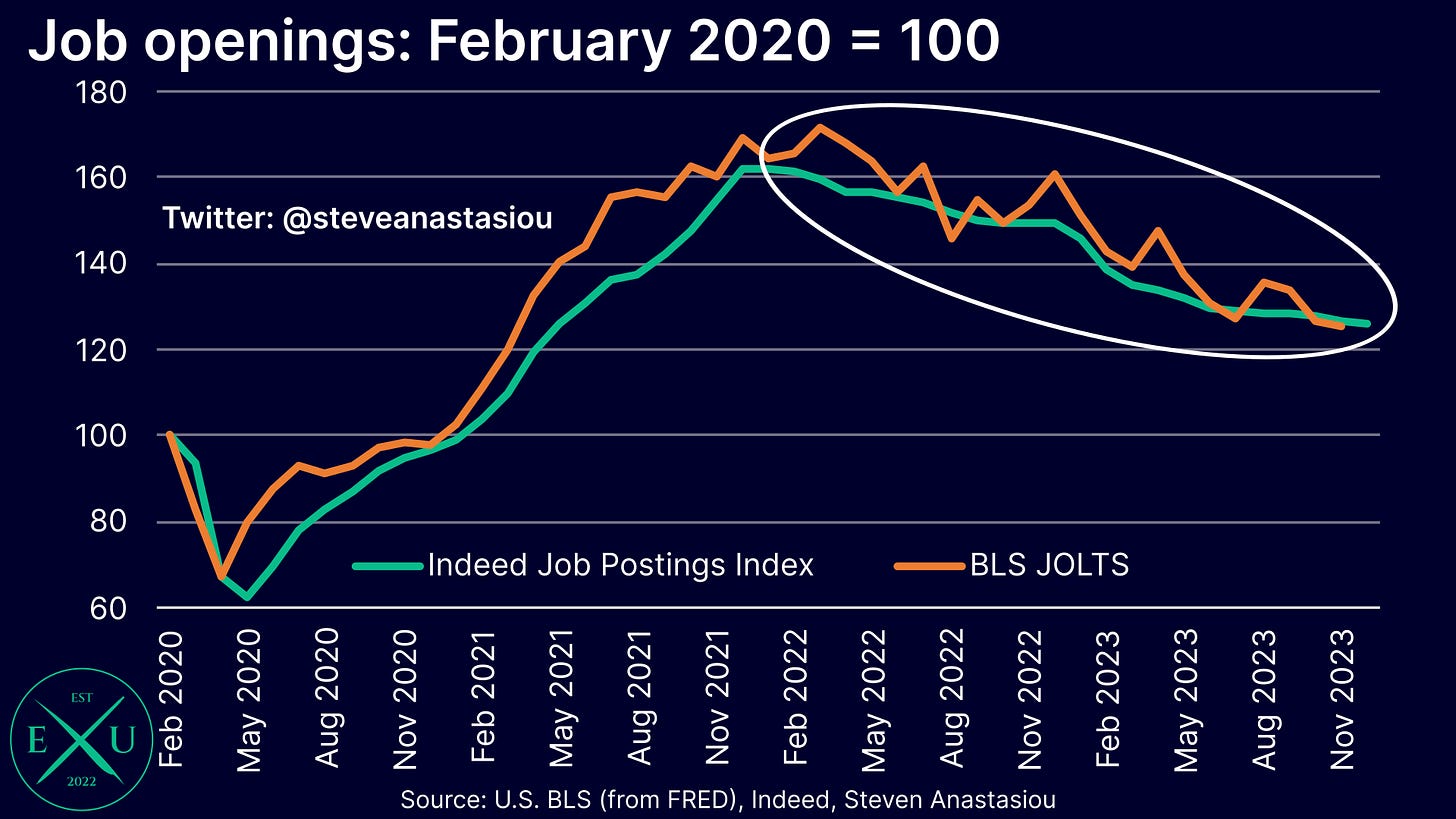
As measured by both the BLS, and Indeed, the number of job openings continues to decline.
In November, the BLS’ measure of job openings fell by 0.7%. Meanwhile, the more timely Indeed measure of job openings has declined by 0.3% in December, slowing from a 1.0% decline in November.
While the number of job openings thus continues to also illustrate a weakening jobs market, with job openings still well above pre-COVID levels, it also shows that job market conditions have not yet reached a level that is particularly concerning, helping to fuel expectations for a soft landing.
Hiring rate sees another significant decline, but layoffs remain low
The rate of new hires fell significantly in November, which outside of the COVID recession, plunged to its lowest level since August 2014. At 3.5%, the rate of new hires is currently at an important juncture and potentially indicative of a material weakening in employment metrics ahead — note that the unemployment rate was 6.1% in August 2014.
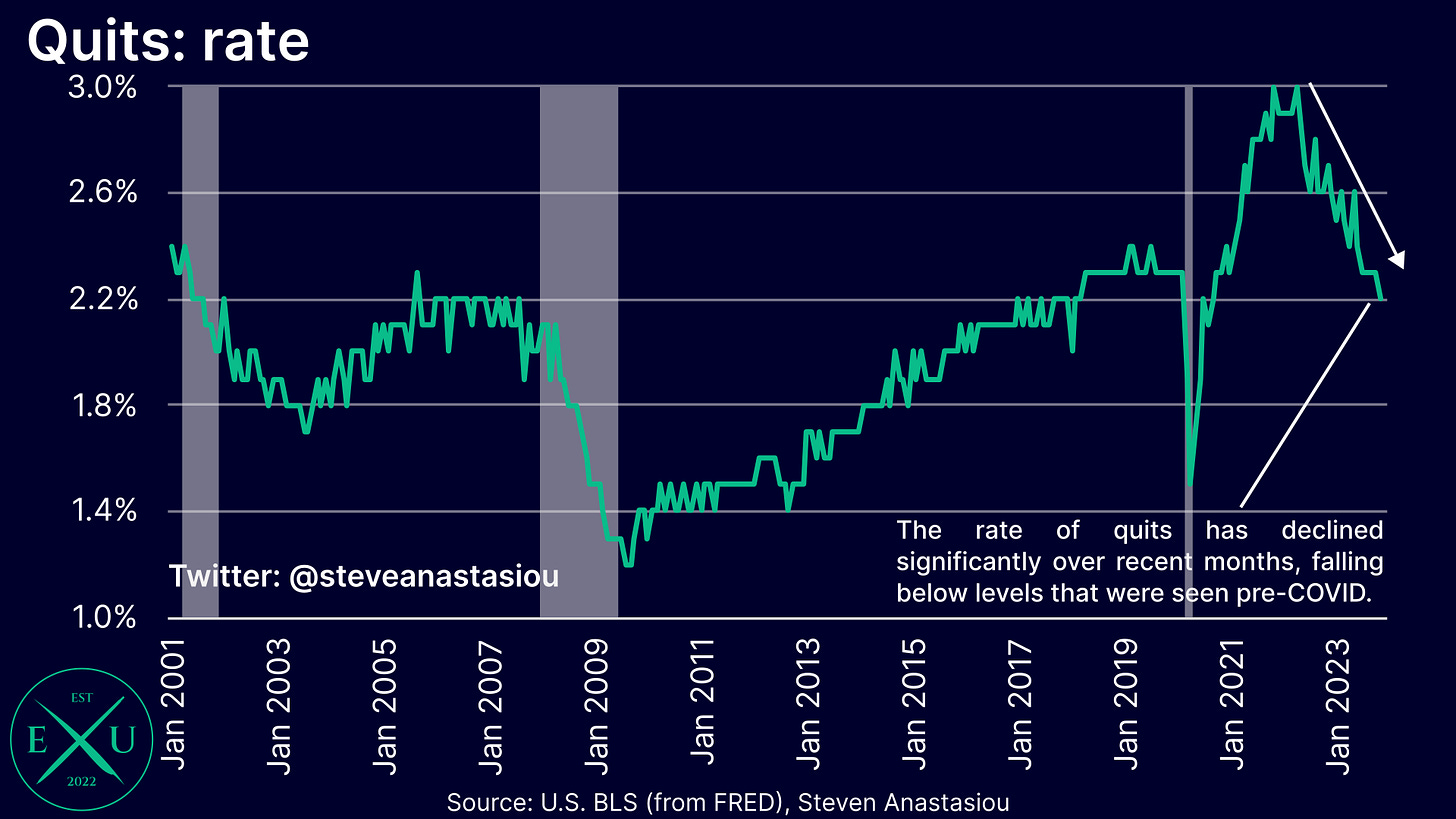
Further indicating that the US employment market is losing momentum, is that the rate of quits also fell in November, falling to 2.2%, a level not seen since September 2020 — though this remains at an historically elevated level.
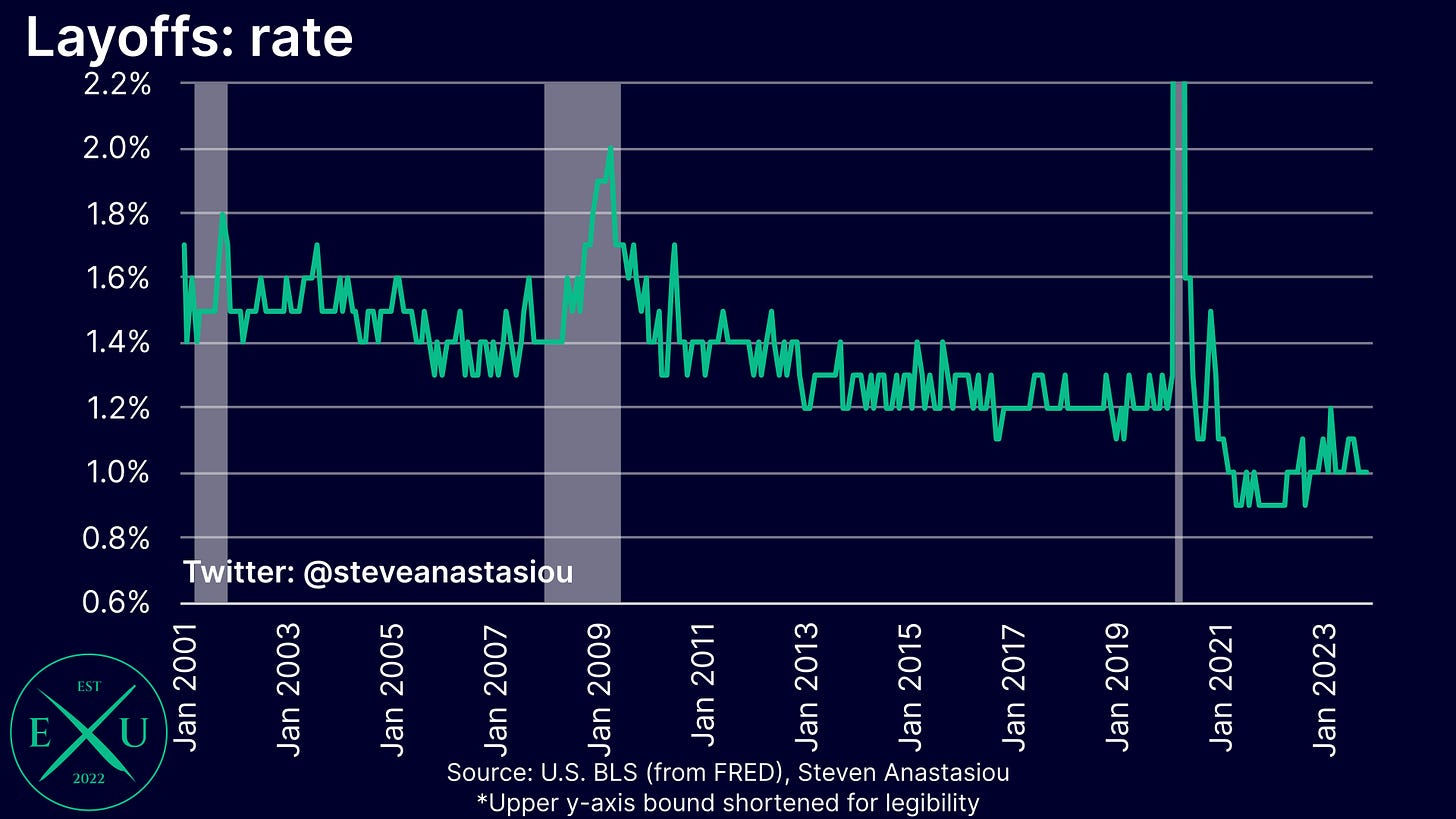
At the same time, the rate of layoffs remained relatively low, again recording a rate of 1%. This remains close to the lowest levels seen (0.9%) since data was first recorded in December 2000.
It’s important to note that layoffs didn’t materially rise during the 2001 recession or the GFC, until the economy was deep into each recession, emphasising that during an ordinary business cycle, layoffs are a lagging indicator.
Given the prior difficulty that businesses had in securing their desired staffing levels during the stimulus driven boom of the current cycle, it’s important to recognise that layoffs are likely to be even more lagging than usual during the current cycle, as businesses will be more reluctant to lay off staff.
As such, in response to moderating nominal economic growth, businesses are more likely to first focus on reducing hiring levels, and allowing natural attrition to reduce staffing levels if business activity falls, with a continued elevated rate of quits reducing the need for businesses to be overly proactive in laying off staff.
It’s also important to note that while nominal economic growth is slowing, the prior stimulus driven boom saw a significant increase in corporate profit margins, meaning that a further moderation in economic growth and business profitability will likely be needed before businesses feel the need to significantly reduce staffing levels.
Low layoff rate corroborated by claims data
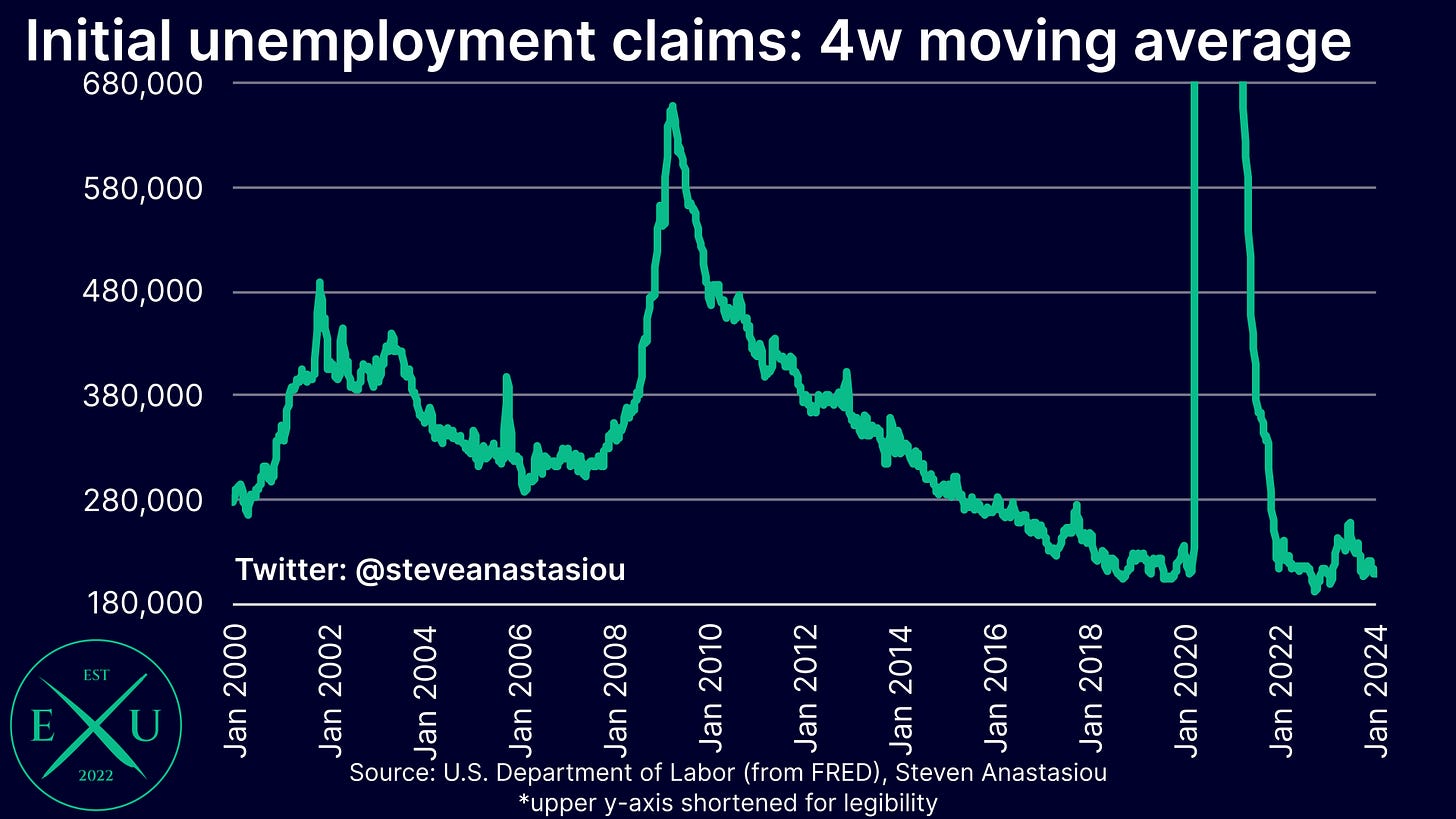
A low rate of layoffs, as measured by the BLS’ JOLTS report, is being corroborated by unemployment claims data from the U.S. Department of Labor, with initial claims remaining relatively low.
At under 210k, the 4-week moving average of initial claims remains around the lowest levels seen this century.
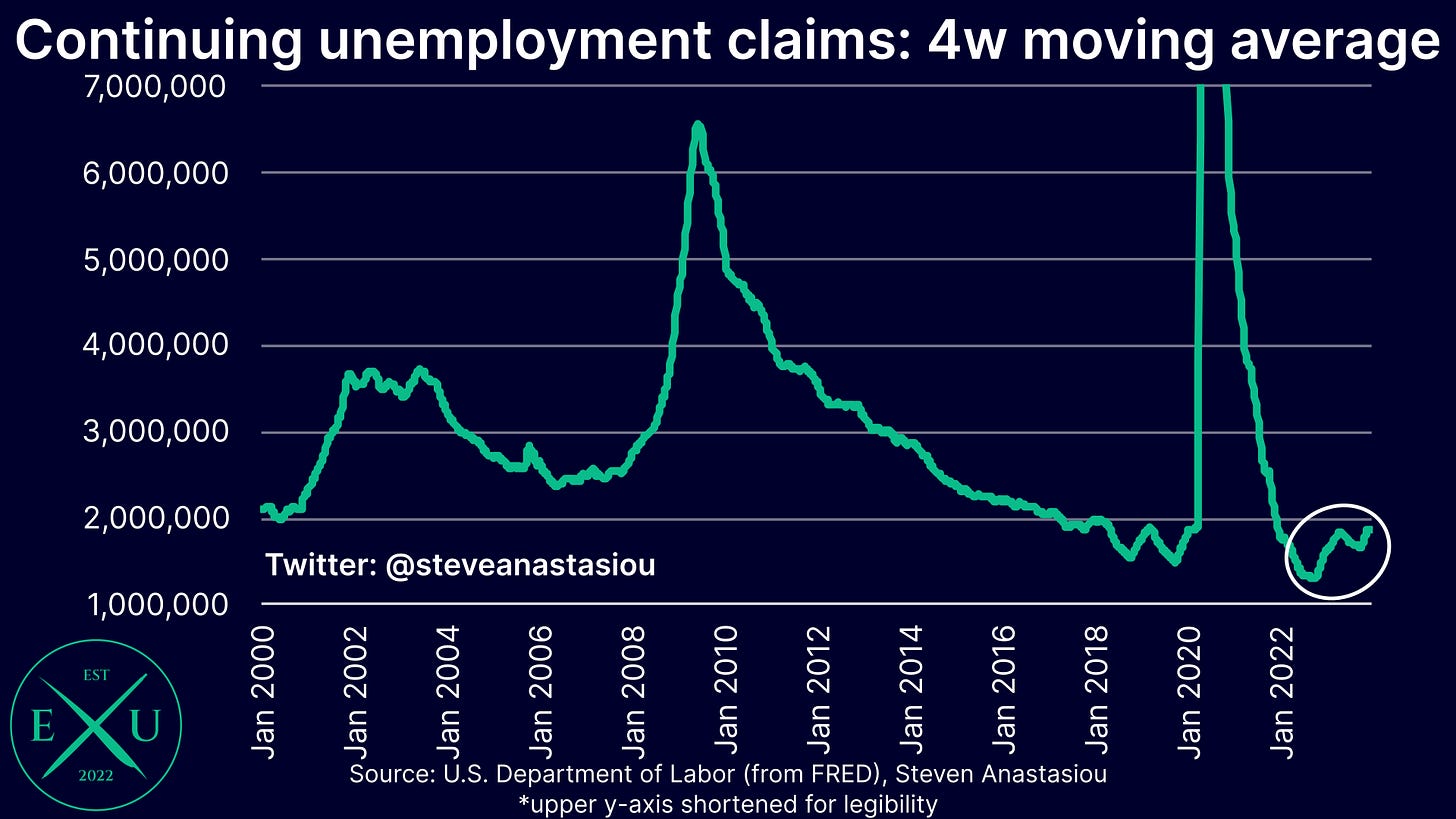
While continued claims have risen from their trough, they also remain at relatively low levels.
Hours worked fall back down, growth in aggregate hours remains modest
Average weekly hours once again fell back down to 34.3 in December, further supporting the narrative that the employment market continues to gradually weaken.
At 34.3 hours, this remains around the lowest levels seen outside of a recession, or the subsequent recovery from one.
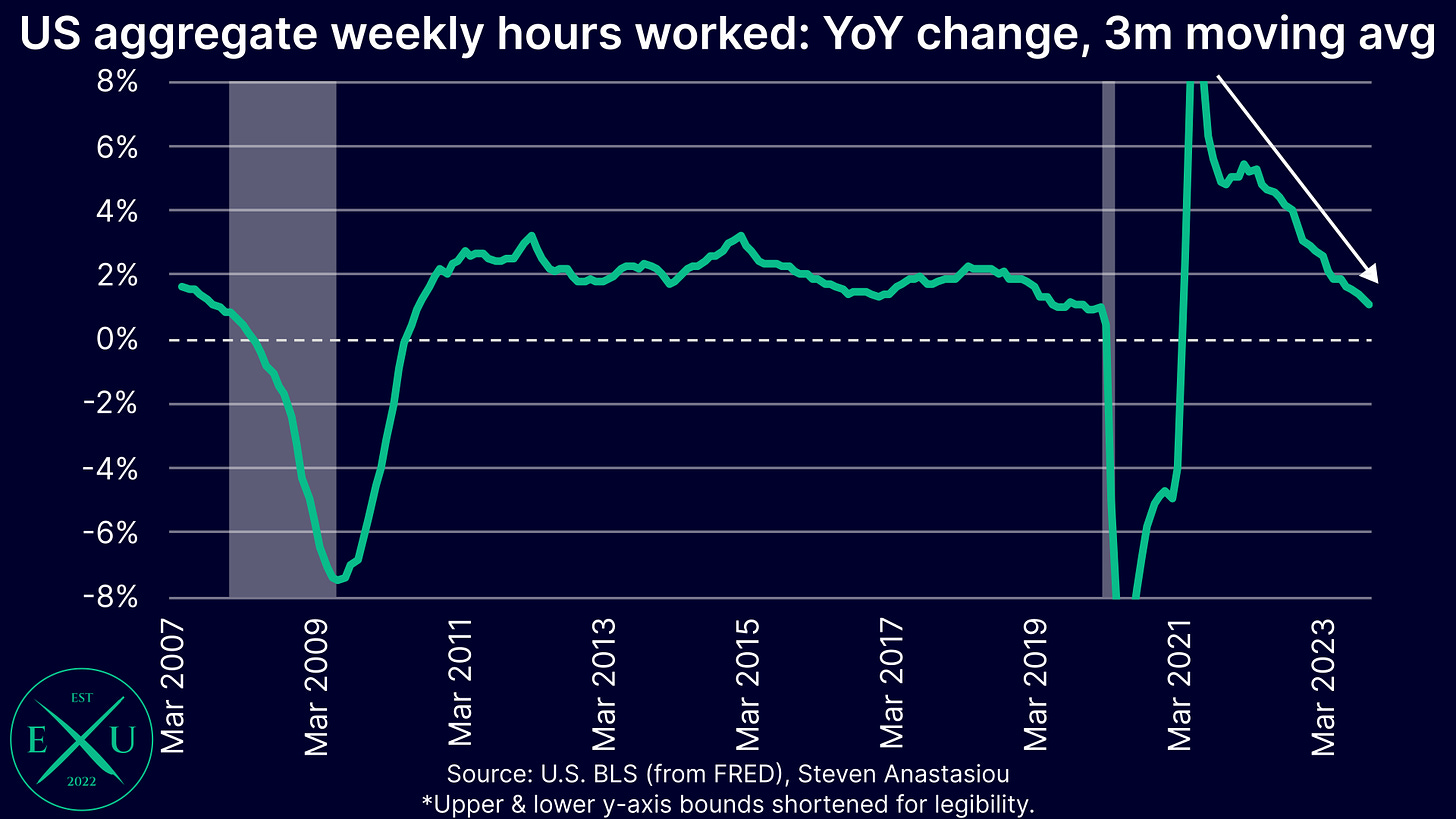
In terms of aggregate hours worked, the rolling 3-month average of YoY growth remained at 1.1% in December. This is well below the average growth rate of 2.0% that was seen across the non-recessionary 2011-2019 period.
Wage growth rises in December, highlighting a significant economic readjustment that is occurring
Average hourly earnings growth saw an increase in MoM growth, rising by 0.44% in December. This saw 3-month annualised growth rise above 4% for the first time since August.
While this may be viewed as a reason to suggest that the jobs market remains relatively strong, it also highlights a significant economic readjustment that is now occurring.
To understand this economic shift, the first key thing to note, is that average hourly wage growth is a lagging indicator, with typically infrequent (i.e. biannual/annual) salary reviews responding to prior changes in business profitability, employment market conditions, and inflation.
Given its lagging nature, current real wage growth is occurring alongside falling M2 and inflation, and moderating nominal economic growth. Should this set of economic conditions continue, this is likely to put downward pressure on corporate profit margins, and in-turn, put downward pressure on the demand for labour over time. This represents a reversal of the prior real wage stagnation/decline that came as nominal wage growth lagged the increase in inflation. Given that this occurred alongside strong nominal economic growth, it supported higher corporate profit margins and a significant increase in the demand for labour.
Given the prior period of stagnating/declining real average hourly wage growth and growing corporate profit margins, it’s important to note that there may be significant “slack” in business profit margins, which suggests the potential for the current economic readjustment (i.e. a shift back to real average hourly wage growth and lower corporate profit margins) to continue for some time.
Thank you for reading my latest research piece — I hope that it provided you with significant value.
The next report due to be released is an update to my medium-term US CPI forecasts.
Should you have any questions, please feel free to leave them in the comments below!
In order to help support my independent economics research, please consider liking and sharing this post and spreading the word about Economics Uncovered — your support is greatly appreciated!
If you haven’t already subscribed to Economics Uncovered, subscribe below so that you don’t miss an update.







Hello Steven. Do you see : disinflation + soft landing + aggressive rate cuts + spx 5k coming this year (or) any chances the inflation might start to spur back & fed dialing back the rate cut talk due to the easing fci and putting downward pressure on the markets? What us your macro view (esp inflation wise) for the rest of year?
I'm curious. Why does NFP get revised? Do they get additional survey responses or change the seasonal adjustment? My judgement on the NFP is that it is detailed granula data from a poorly responded to survey, then poorly seasonally adjusted (particularly bad post COVID) resulting in nonsense results that don't correlate well with real data. Am I being too negative?