Latest PCE data shows why the Fed should shift its monetary policy stance
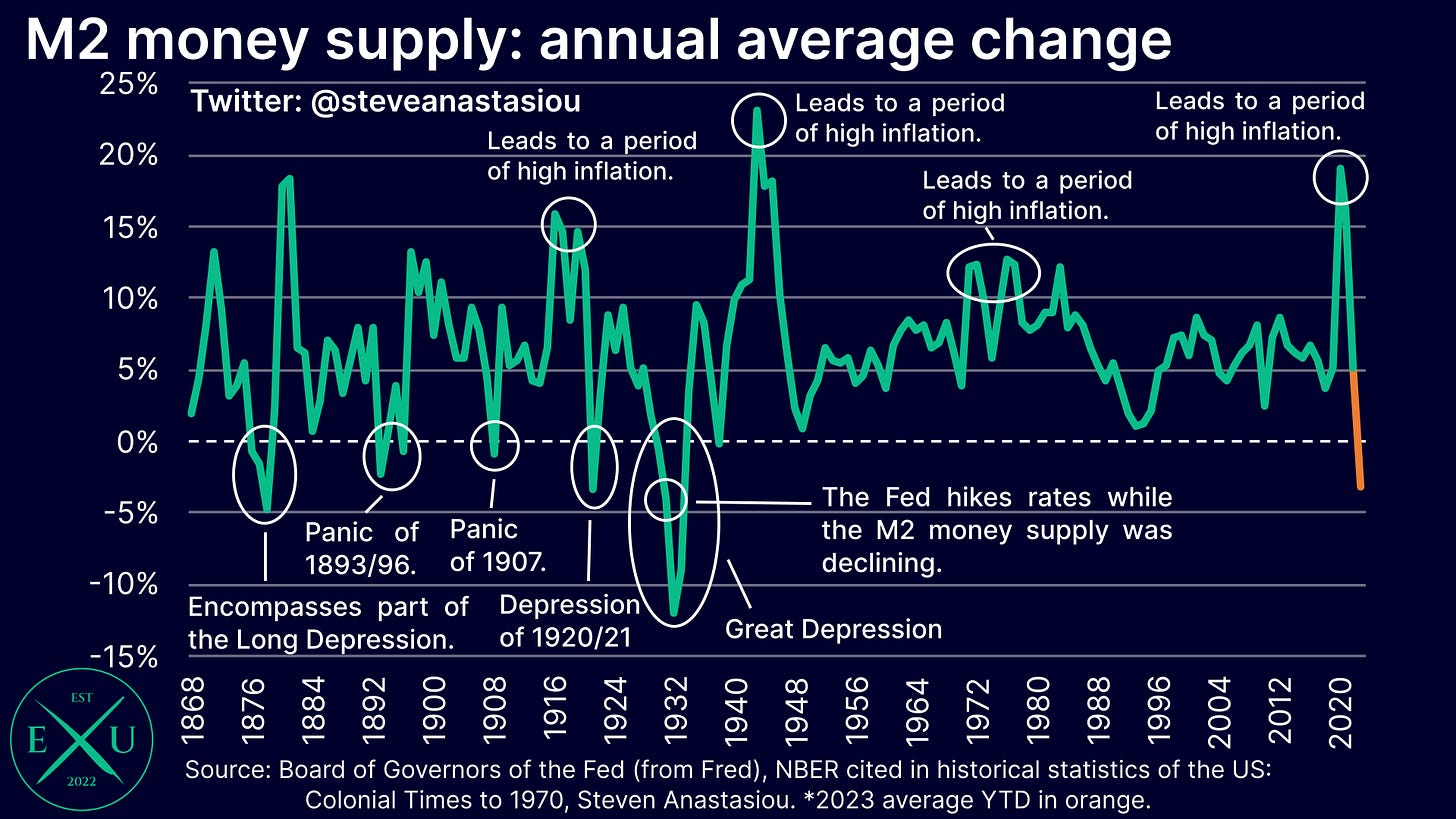
Rather than "higher for longer" messaging, continued disinflation amidst falling M2, shows that the Fed should shift its monetary policy stance in order to help avoid tipping the US into a recession.
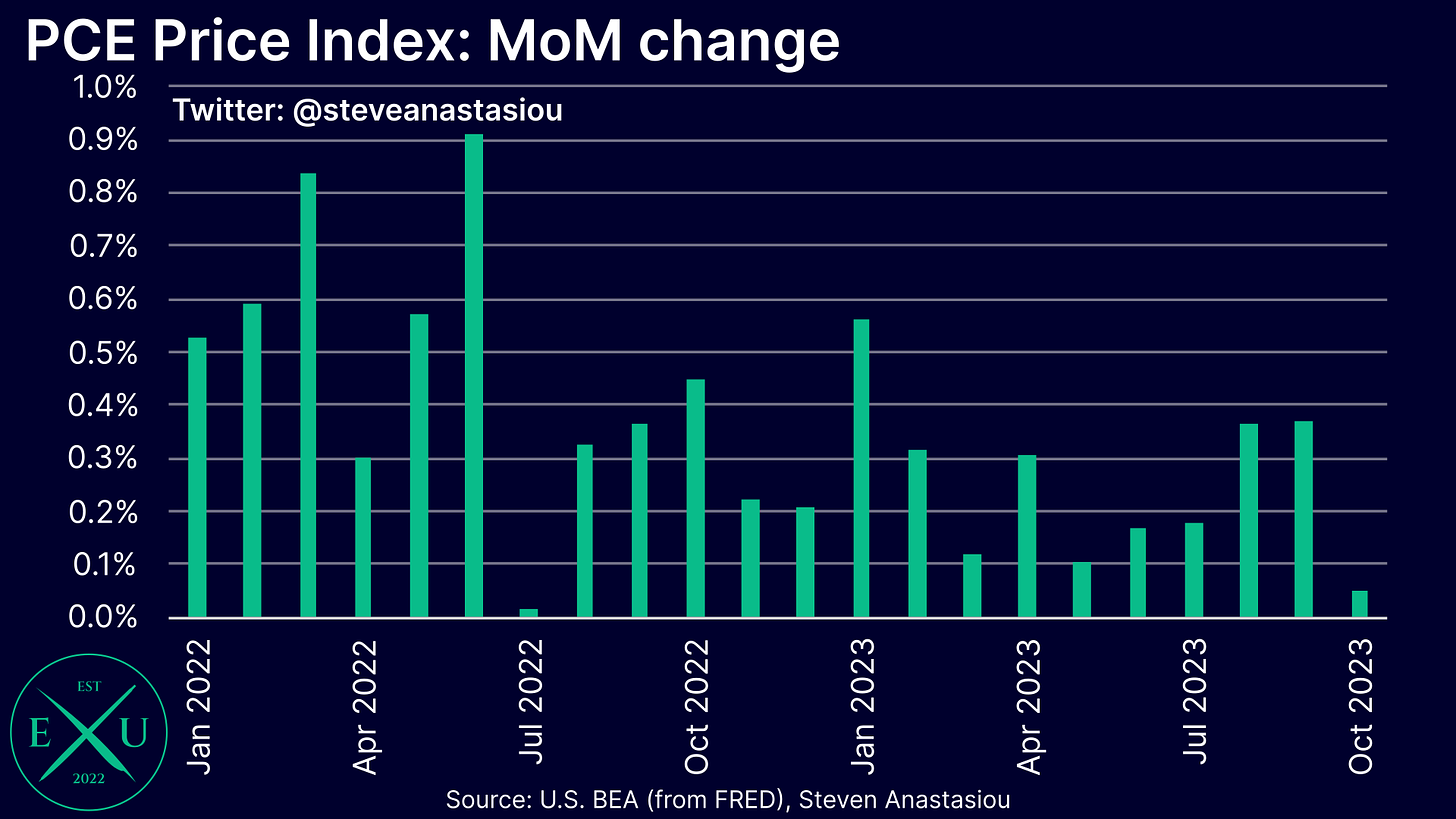
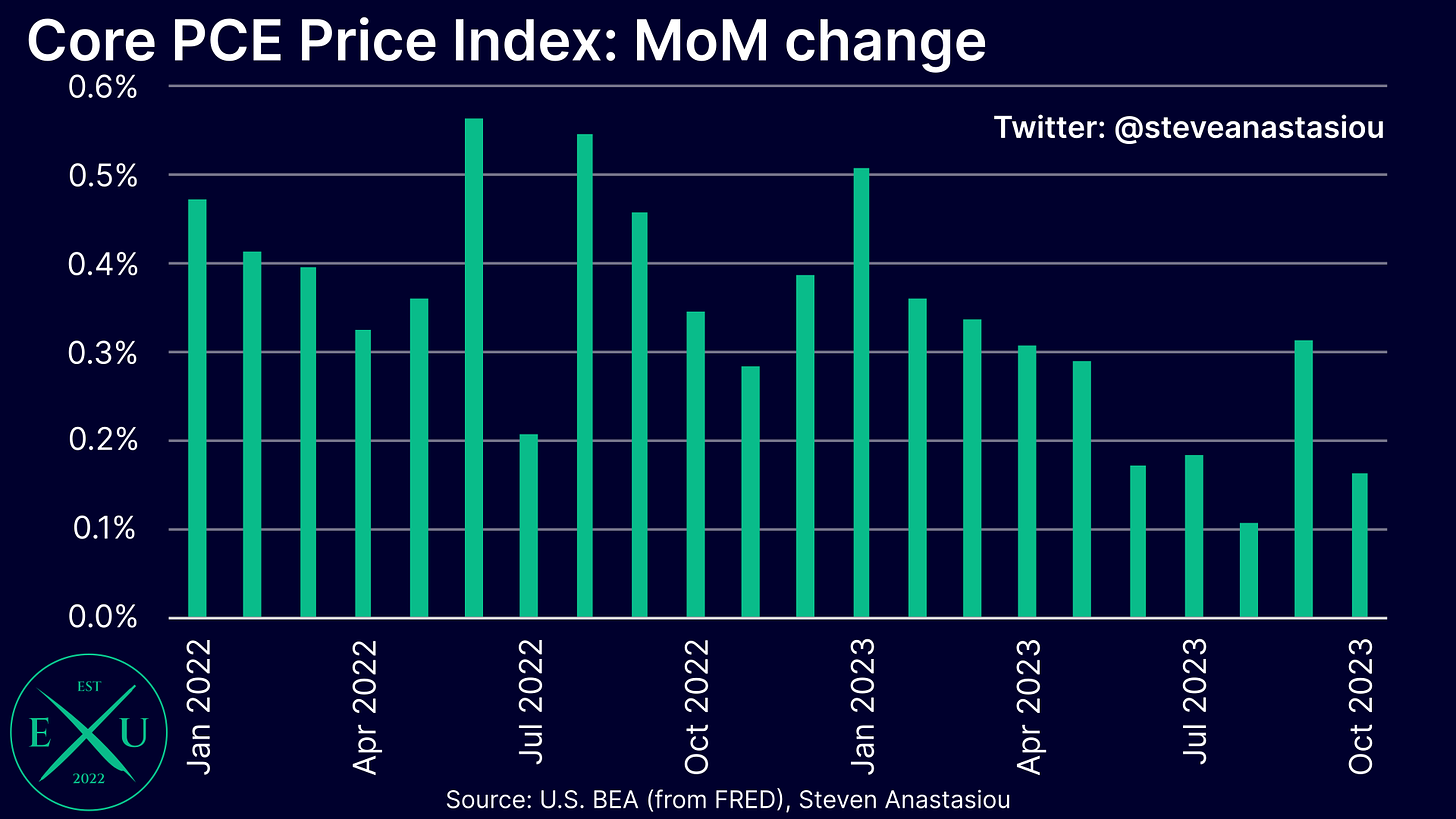
For the month of October, headline PCE inflation saw relatively flat MoM growth, while core PCE inflation rose 0.2% MoM, down from 0.3% in September.
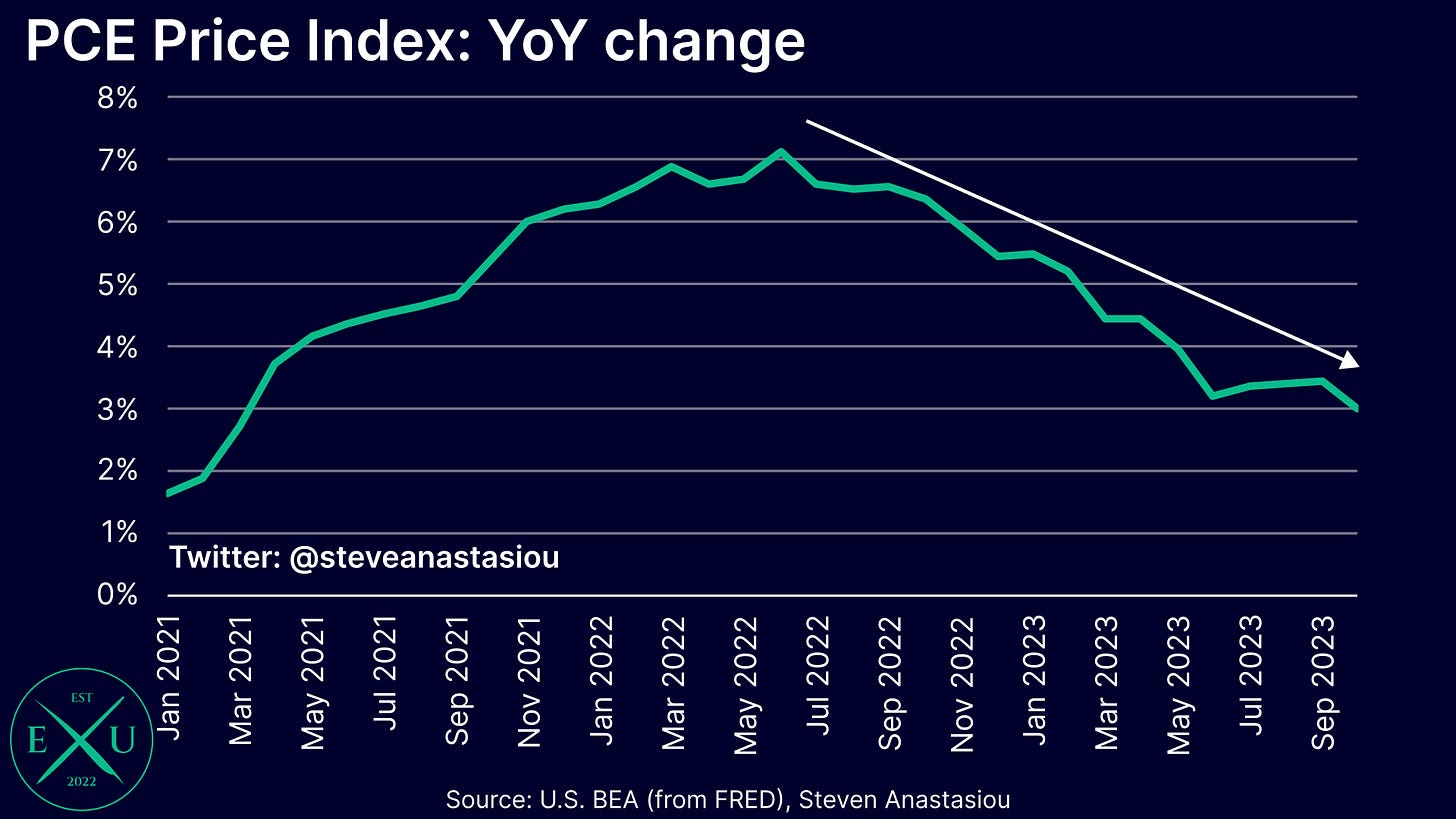
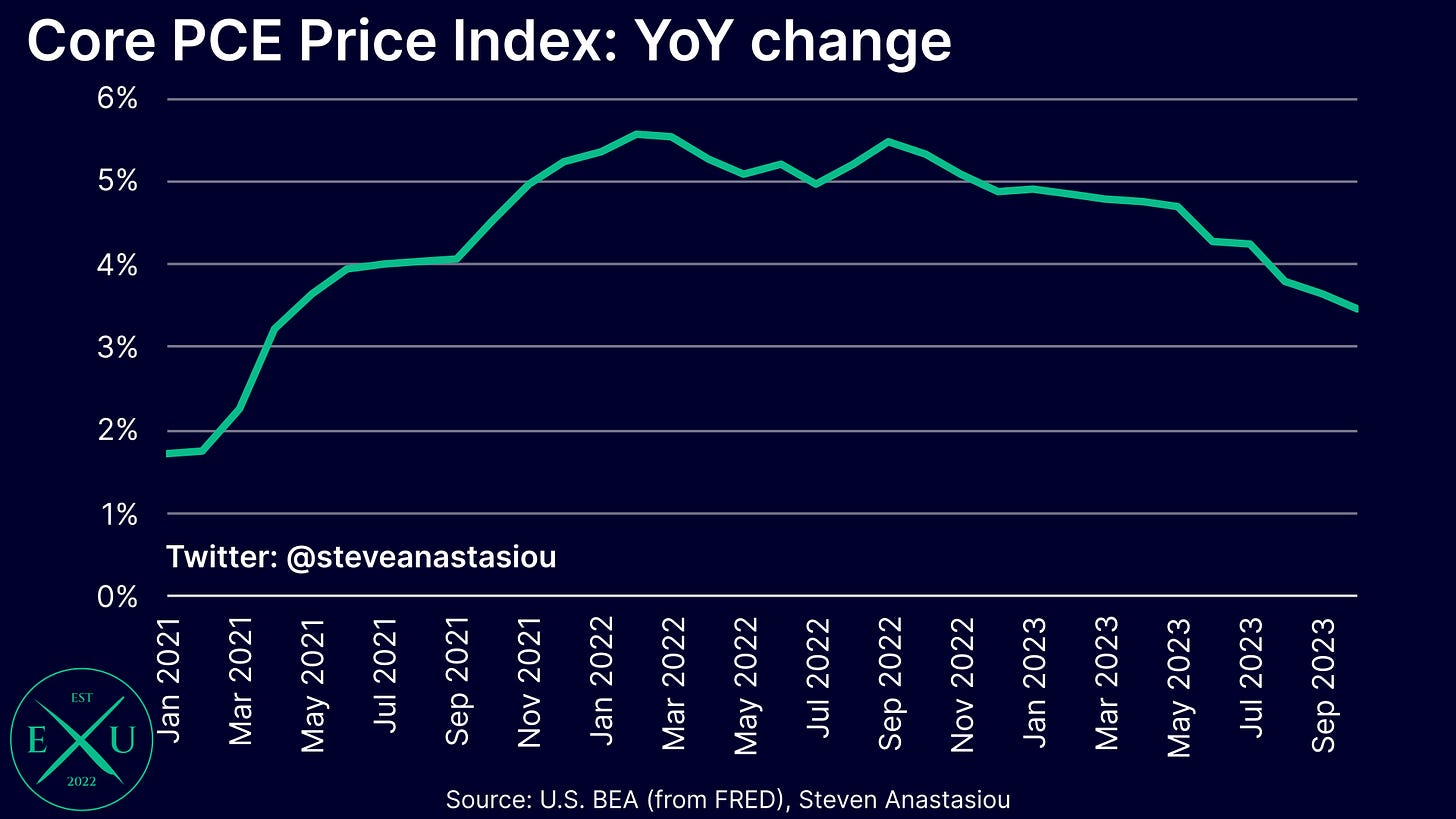
This saw annual headline PCE growth fall to 3.0%, from 3.4% in September.
Core PCE growth fell to 3.5%, from 3.7% in September.
Durables and nondurables prices saw MoM deflation
In breaking down the latest PCE Price Index (PCEPI) data into its key components, both durable and nondurable goods categories saw deflation in October, with both categories seeing MoM declines of 0.3%.
Looking firstly at durable goods, three of the four key subcomponents saw MoM deflation with the “other durable goods” component the only one to record MoM growth in October.
This marks the fifth consecutive month of durable goods price deflation.
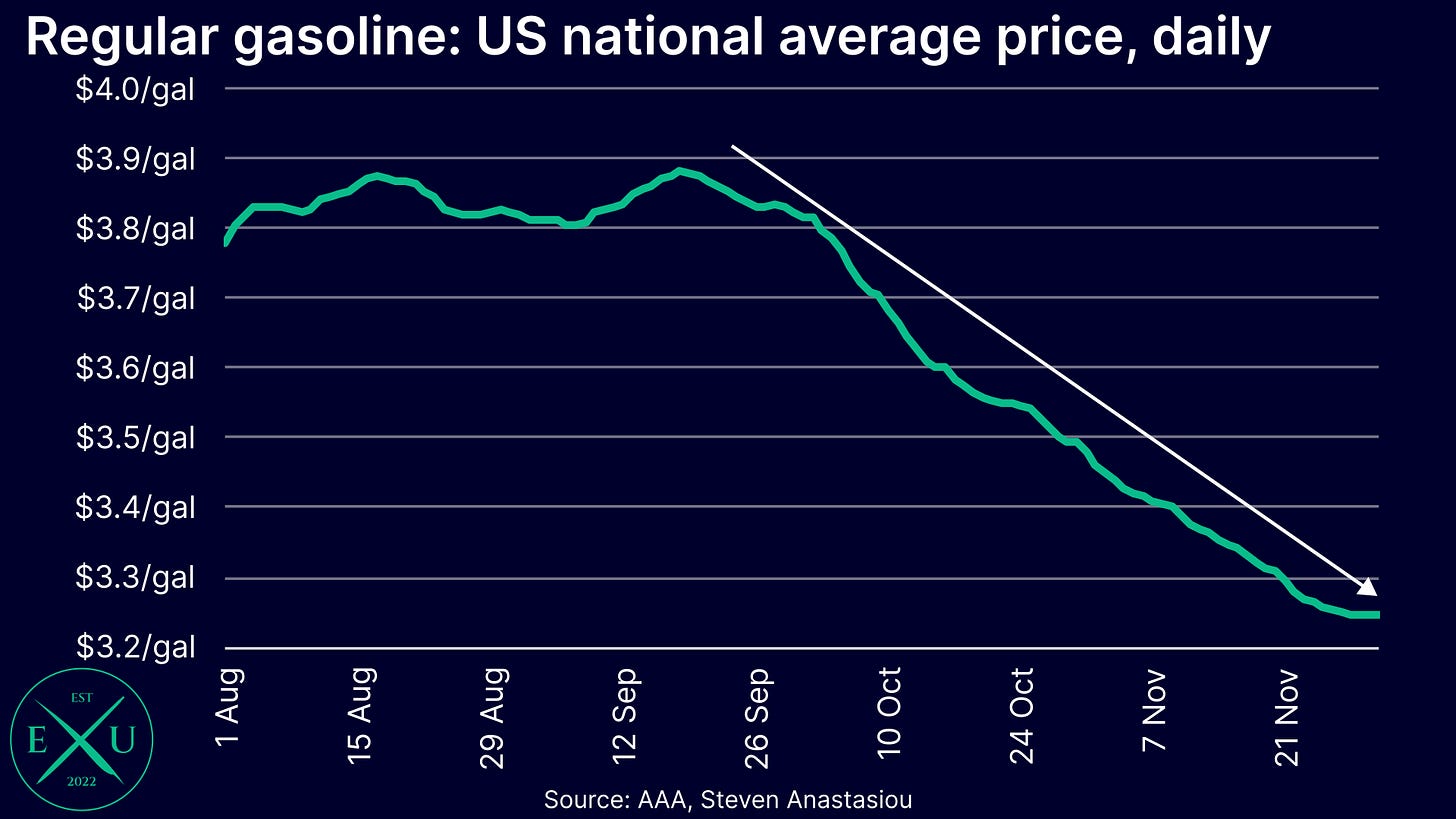
Moving to nondurable goods, the key driver of the 0.3% MoM price decline was the “gasoline and other energy goods” category, which saw a MoM decline of 4.6%.
Clothing and footwear prices were broadly flat, whilst food and beverages saw MoM growth of 0.2%.
Other nondurable goods price rose by a very significant 0.5% — the highest MoM growth that’s been seen since May.
Given the significant further declines that have been seen in gasoline prices in November, there’s likely to be significant additional downside pressure for nondurables prices in the next PCEPI report.
After a hot month in September, services price growth moderates in October
After seeing relatively elevated price growth in September (0.5%), MoM services price growth moderated in October, with prices rising by 0.2%.
A material moderation in MoM growth versus September’s levels was seen across several categories, including: transportation services; recreation services; food services and accommodation; and financial services and insurance.
The housing and utilities category continued to record elevated MoM growth. As outlined in my latest US CPI Review, while housing related costs are expected to moderate on account of the shift that has occurred in spot market rents, this deceleration is expected to gradual — I currently expect MoM growth in the CPI’s rent based indexes to remain elevated through 1H24 (which would be expected to also largely apply to the PCEPI).
Longer-term trends show a clear and ongoing deceleration
3-month annualised growth
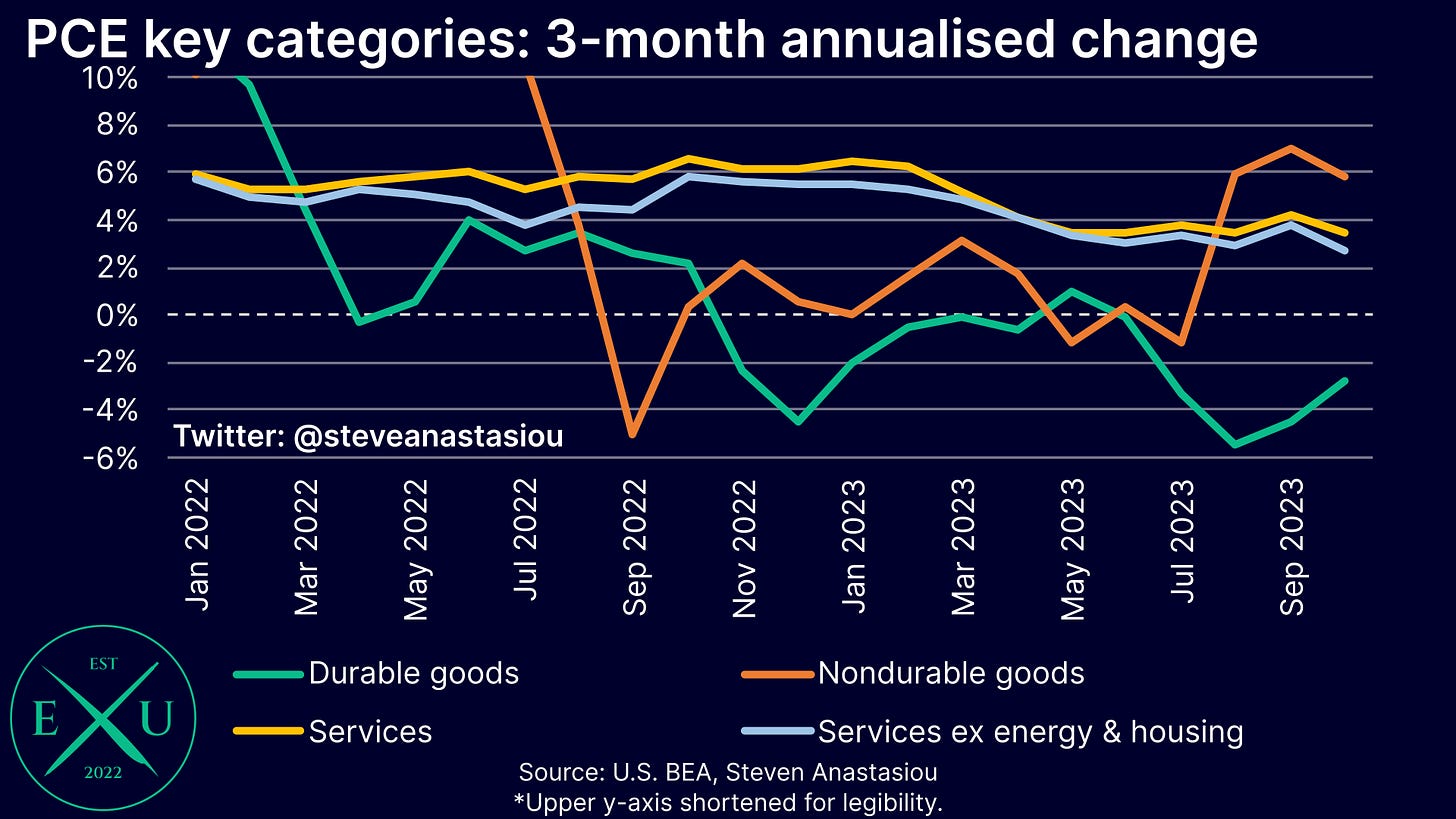
Looking now at longer-term trends, 3-month annualised growth remained sharply negative for durables prices in October, at -2.8%.
The more volatile nondurables component (on account of gasoline prices), saw 3-month annualised growth of 5.8% in October, down from 7.0% in September. While this may seem elevated, 3-month annualised nondurables price growth may turn negative in November, as additional declines in gasoline prices are reflected in the PCEPI.
3-month annualised growth in services prices fell to 3.4% in October, returning to levels that were seen in May and June.
Excluding energy and housing from the services price equation, sees 3-month annualised growth of 2.7% — the slowest rate of growth that has been seen since December 2020.
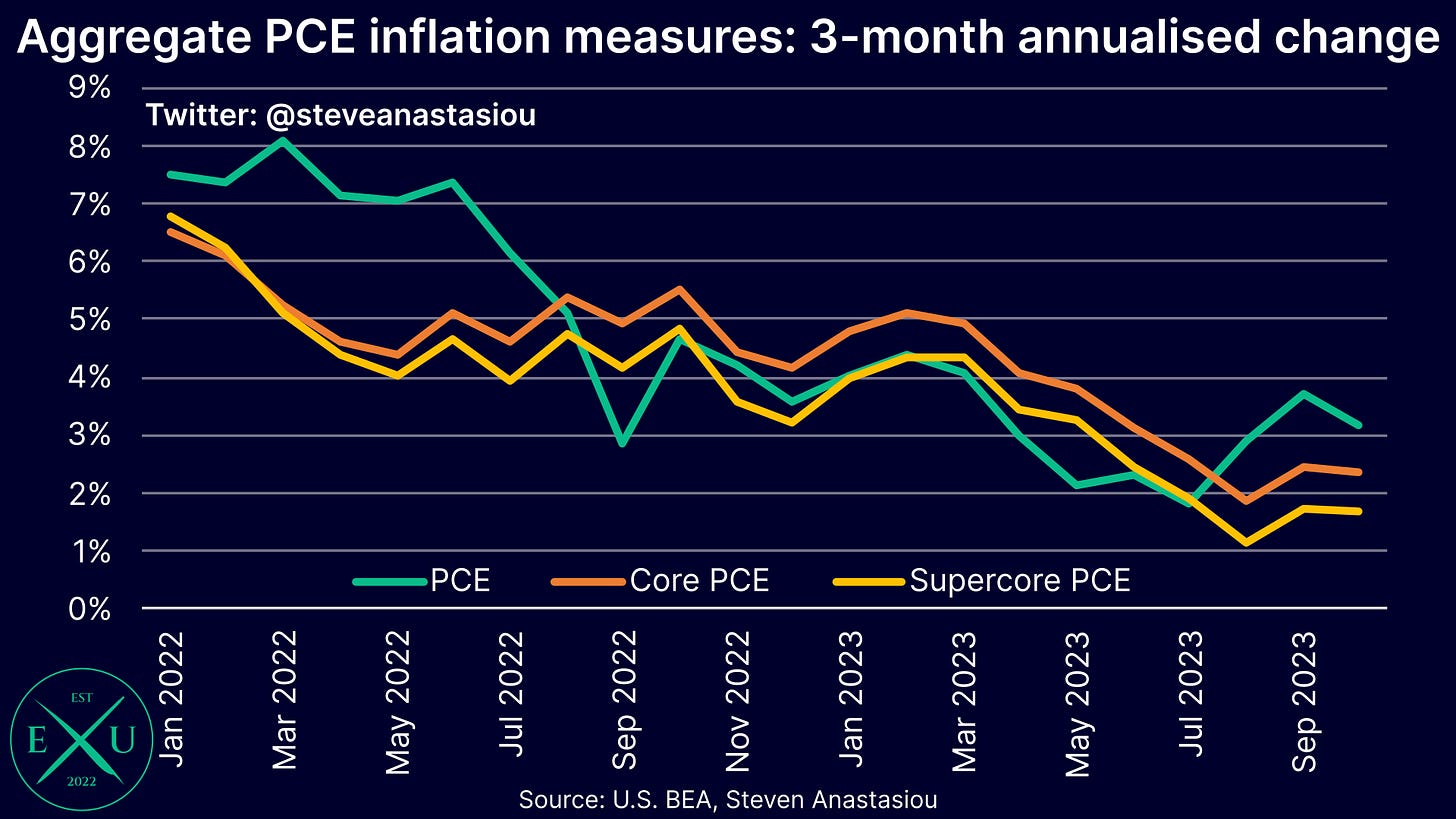
Putting all of this together, saw 3-month annualised headline PCEPI growth of 3.2% in October, down from 3.7% in September.
Core PCE growth remained unchanged at 2.4%, whilst supercore PCE growth (i.e. excluding food, energy and lagging housing), saw 3-month annualised growth of 1.7% — this marks the fourth consecutive month of growth below 2%.
Over the past four months, 3-month annualised supercore PCE growth has averaged 1.6%. This compares to average YoY growth of 1.4% across 2010-19.
6-month annualised growth
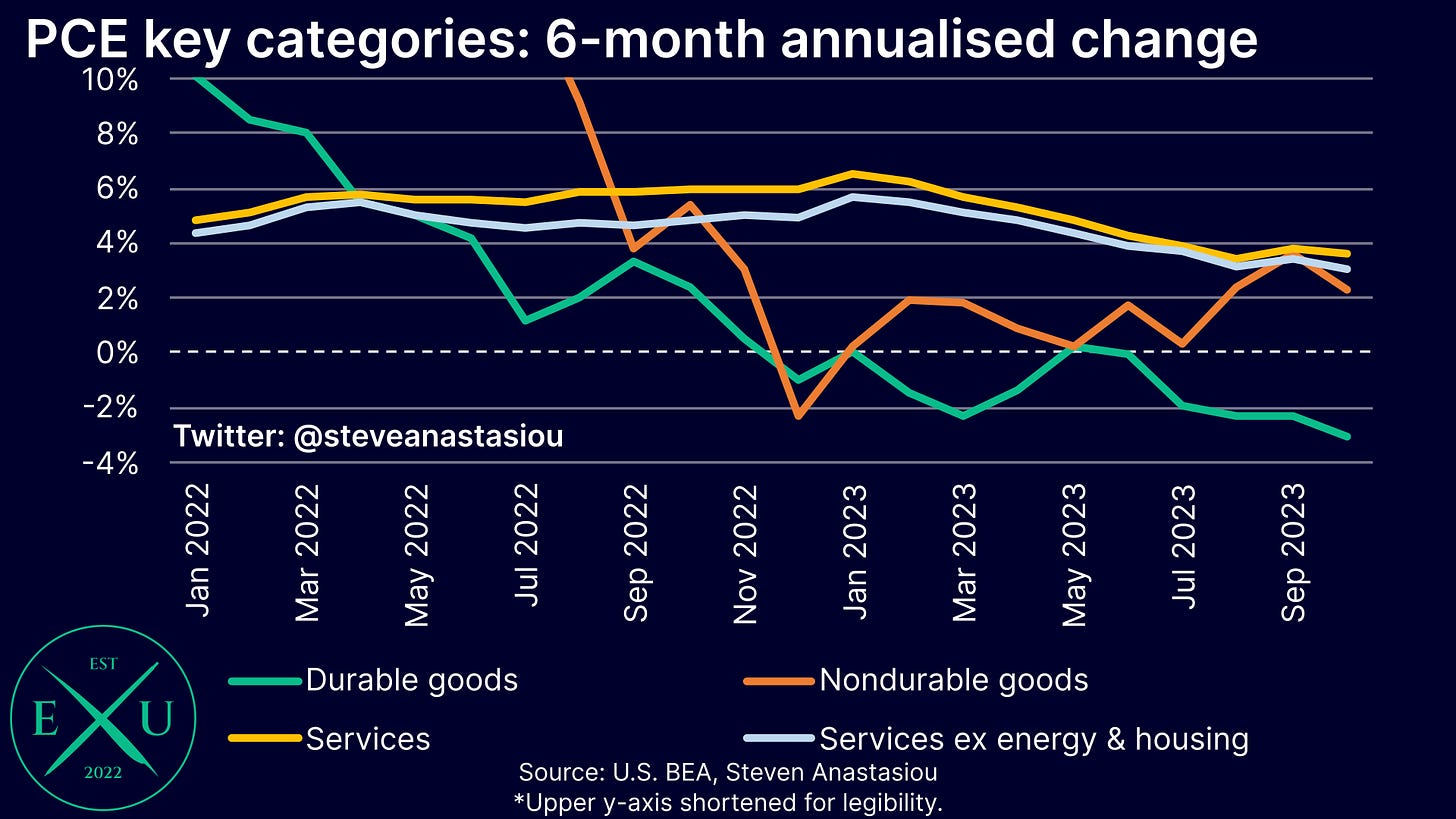
On a 6-month annualised basis, durable goods prices fell 3.0%, which was a faster rate of decline than the 2.3% recorded in September — price declines of at least 2.0% were seen across all four key durables subcomponents.
Nondurable goods prices rose 2.3%, down from 3.6% in September. Again, growth is likely to decline sharply in November, as the decline in gasoline prices is more fully reflected.
Services price growth moderated from 3.8% to 3.6%. Excluding energy and lagging housing prices, 6-month annualised services price growth fell to 3.0%. This was down from 3.4% in September and marks the slowest rate of growth that has been seen since November 2020.
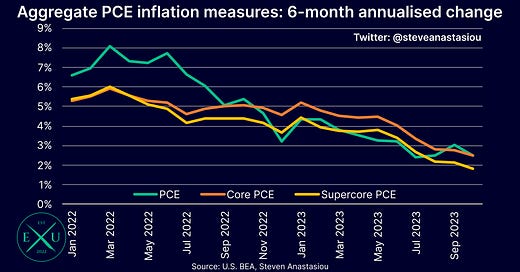
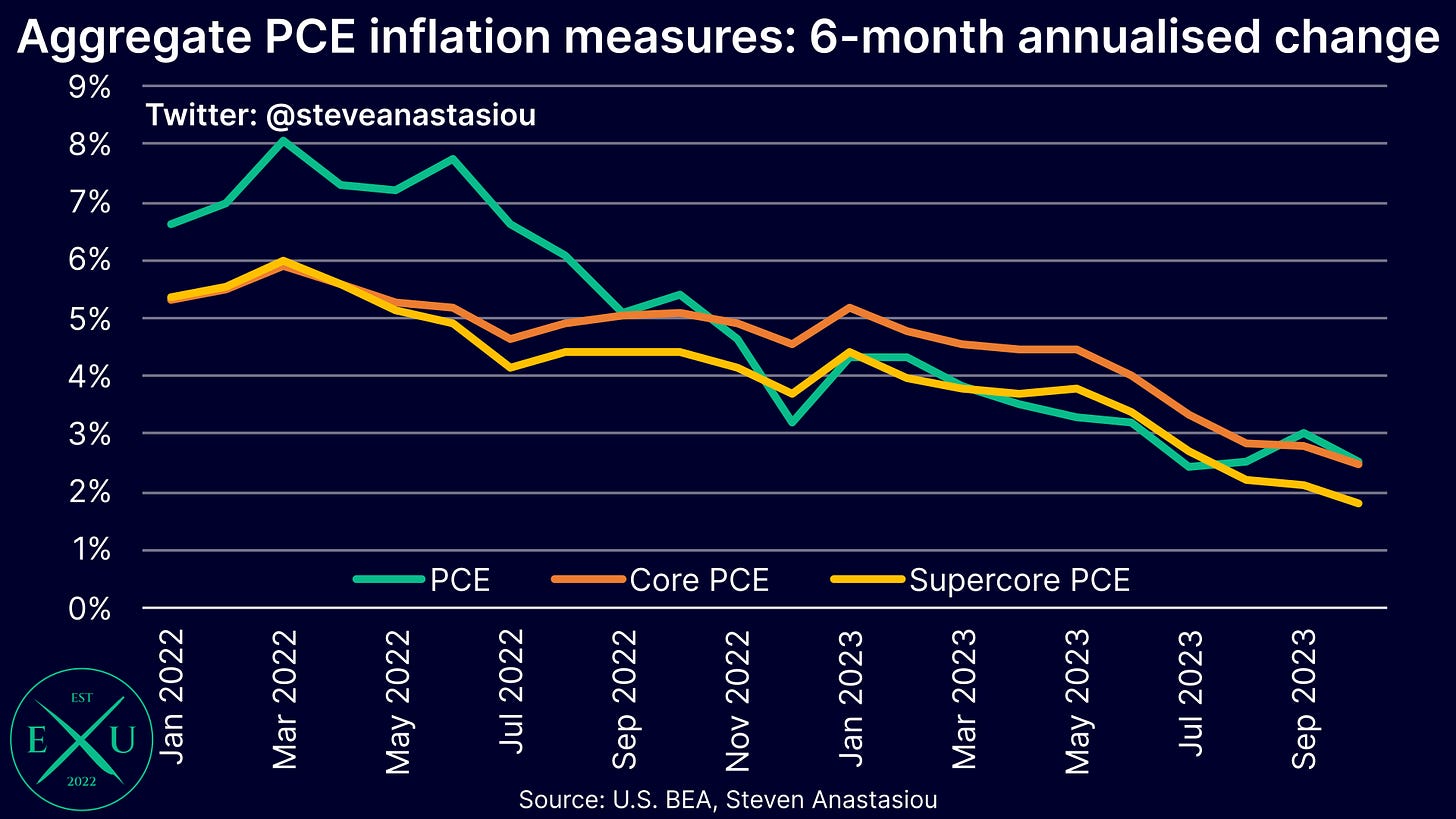
Putting it all together, 6-month annualised headline PCE growth was 2.5% in October, down from 3.0% in September and returning to levels that were seen in August.
Core PCE growth was also 2.5%, down from 2.8% in September, and marking the lowest rate of growth since February 2021.
Supercore PCE growth was just 1.8%, down from 2.1% in September, and the lowest rate of growth that has been recorded since September 2020.
YoY growth
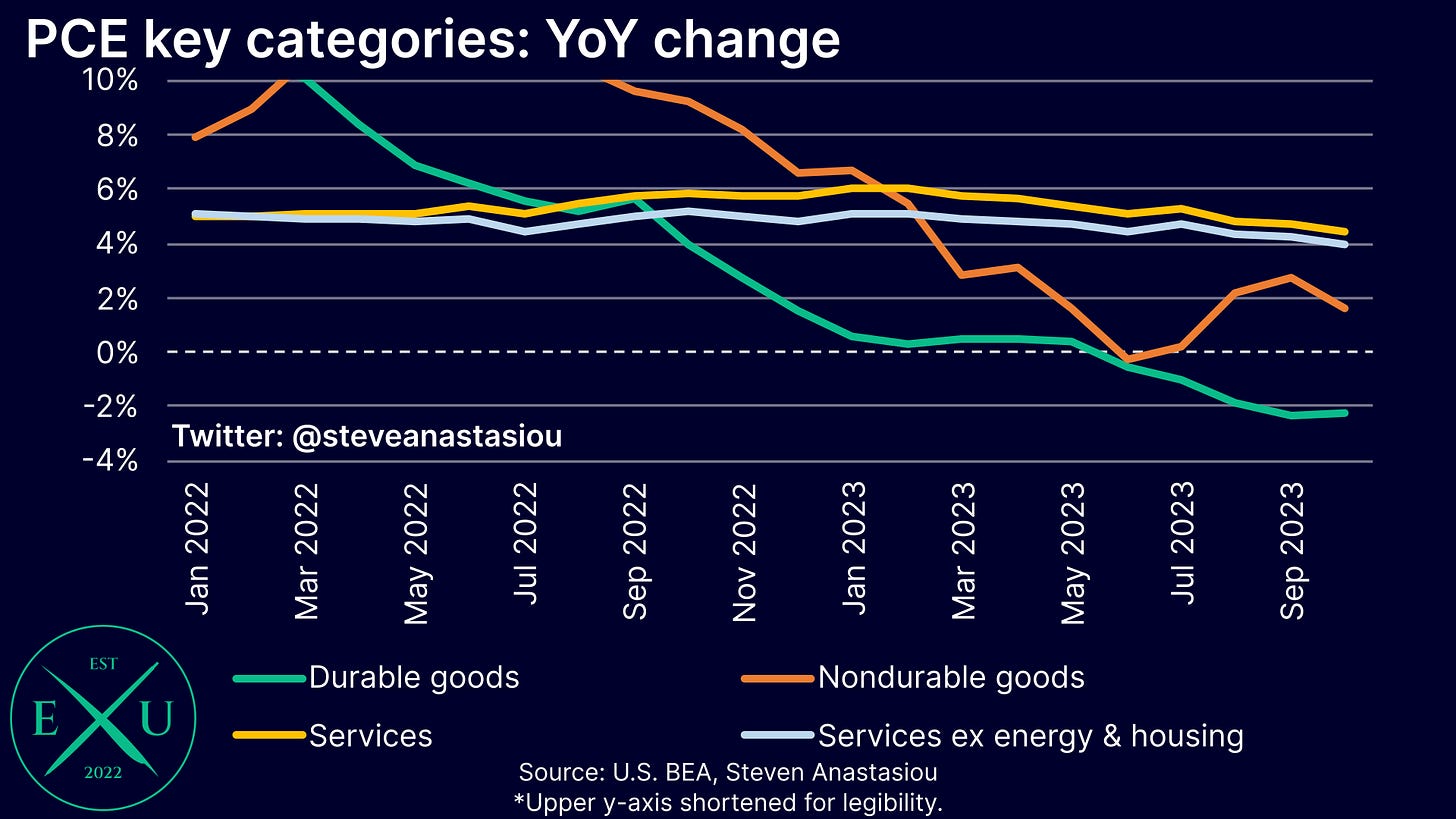
On an annual basis, durable goods prices are also in outright deflation, recording YoY growth of -2.2% in October.
Nondurable goods prices recorded annual growth of 1.6% in October, returning to an annual growth rate of below 2% for the first time since July.
Services prices continued to moderate, with annual price growth falling to 4.4%, down from 4.7% in September. While annual growth has been decelerating, at 5.9%, housing and utilities price growth remains elevated, and is now the fastest growing services price category.
Excluding food and the lagging housing category, services prices rose by 3.9% YoY, down from 4.3% in September.
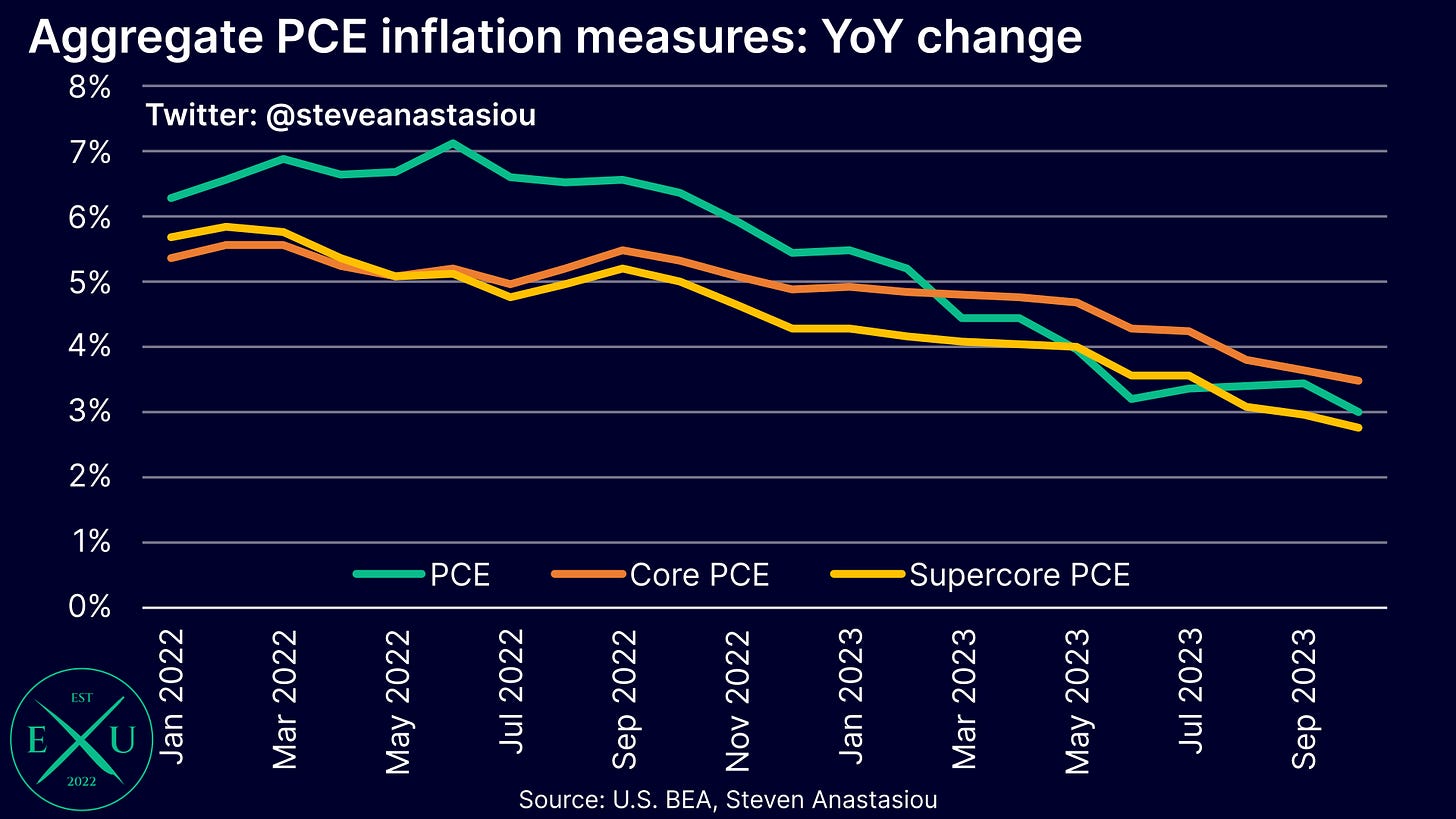
Overall headline PCE growth was 3.0% YoY in October, down from 3.4% in September.
Core PCE growth moderated to 3.5%, down from 3.7% in September.
Supercore PCE growth fell to 2.8%, down from 2.9% in September. This was the slowest rate of growth that has been recorded since March 2021.
PCE data continues to show that high inflation should no longer be a concern — it’s time for the Fed to shift its policy stance
Given the trends that have been seen in 3- and 6-month annualised growth rates, and current YoY declines in the M2 money supply, annual PCEPI growth rates are likely to decline materially during 2024.
While the Fed is likely to remain cautious for a while longer, and particularly so should the employment market remain relatively solid, with 6-month annualised PCE and core PCE growth already having largely fallen to the Fed’s 2% target (both were 2.5% in October), now is not the time to assert that rates are likely to remain “higher for longer”.
Instead, now is the time for the Fed to shift its stance towards a loosening bias, and to lay the groundwork for rate cuts to soon be delivered, in an attempt to avoid tipping the US economy into a recession.
Further supporting a shift in its policy stance, is that current 6-month annualised PCE growth continues to reflect significantly elevated housing inflation, which is a significantly lagging component. Given that we know that underlying spot market rents have already decelerated significantly, this is likely to flow through to a gradual, but significant moderation in, housing services inflation during 2024, thus supporting declines in headline and core PCE inflation beyond what more recent price trends have been indicating.
Given the lagging nature of the PCEPI’s rent based housing components, in order to gain additional insights into the rate of underlying inflation, one can look at the PCEPI on an ex-housing basis — which is what the supercore measure achieves. In October, 6-month annualised supercore PCE inflation was just 1.8% — not too far above the 2010-19 average YoY growth rate of 1.4%, which was consistent with headline PCEPI growth of 1.5% (i.e. a rate of growth that’s below the Fed’s 2% target). On a 3-month annualised basis, supercore PCEPI growth has been below 2% for four consecutive months. In light of the known moderation in underlying spot market rents, this provides clear evidence that price growth has broadly returned to the Fed’s target.
While a very large federal government deficit means that the Fed may need to keep monetary policy relatively more restrictive than would otherwise be needed to sufficiently restrain M2 growth and inflation over the medium-term, given the clear evidence that the recent bout of high inflation has been defeated, significantly delaying the loosening of monetary policy not only raises the risk of a recession, but in-turn, it raises the risk of another bout of high inflation — the very thing that current monetary policy tightening is designed to prevent.
Why’s that?
Because a recession is the key thing that’s likely to result in another round of aggressive money printing, and this is the very thing that risks another bout of high inflation — just as it did in response to the COVID recession, and just as it has throughout history.
Thank you for reading my latest research piece — I hope that it provided you with significant value.
Should you have any questions, please feel free to leave them in the comments below!
In order to help support my independent economics research, please consider liking and sharing this post and spreading the word about Economics Uncovered. Your support is greatly appreciated and goes a long way to helping make Economics Uncovered a sustainable long-term venture that can continue to provide you with valuable economic insights for years to come.
If you haven’t already subscribed to Economics Uncovered, subscribe below so that you don’t miss an update.






The only PCE analysis I read - and I think the only I need to read!
Thank you! :-)
Deflation will be the risk.. oh boy, the BRRRRR after that scare!