Are expectations for shelter disinflation misguided or is major disinflation on the way?
While the trend in owners' equivalent rent suggests that it may stabilising at an elevated level, a deeper look at the BLS' rental dataset indicates that major disinflation could be on the way.
This post was subsequently updated to reflect the fact that despite using economic rents, the ATRRI more closely tracks OER than RPR.
After releasing my research piece on the outlook for core services prices more broadly on Monday, this second research piece on services prices focuses on the outlook for the CPI’s two key rent based measures, being owners’ equivalent rent (OER) and rent of primary residence (RPR).
Given their large weighting (34.4% of the overall CPI in February) the outlook for OER and RPR has significant ramifications for the overall inflation equation. With spot market rents seeing a major deceleration since peaking in late 2021/early 2022, the consensus expectation has been, and continues to be, that both OER and RPR are set to disinflate significantly over the course of 2024 — indeed, I too have expected both of these items to materially disinflate during 2024.
Though with OER remaining stubbornly elevated over much of the past year, is it necessary to alter this view?
In order to help answer this question, let’s firstly review the latest spot market rental data.
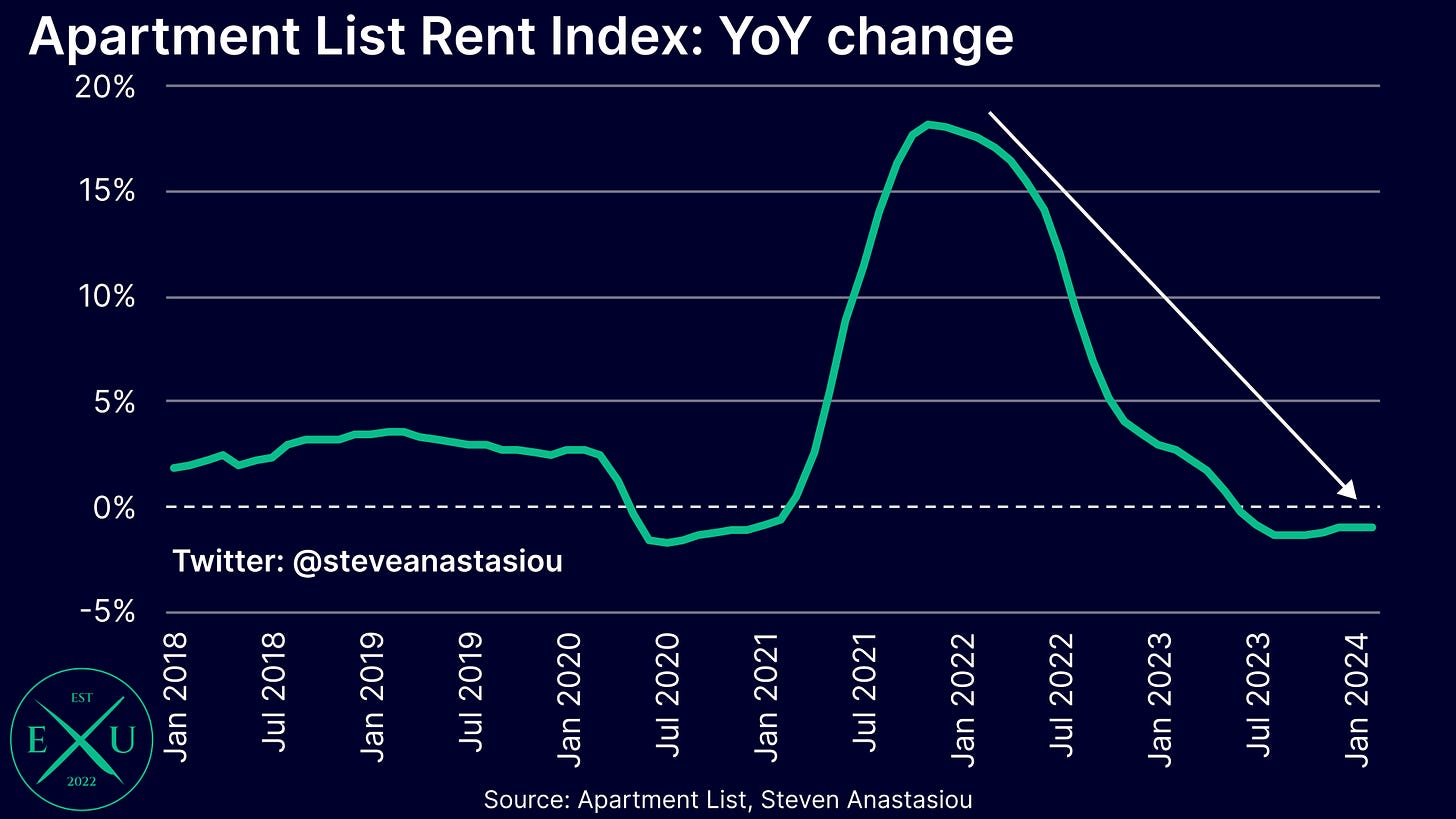
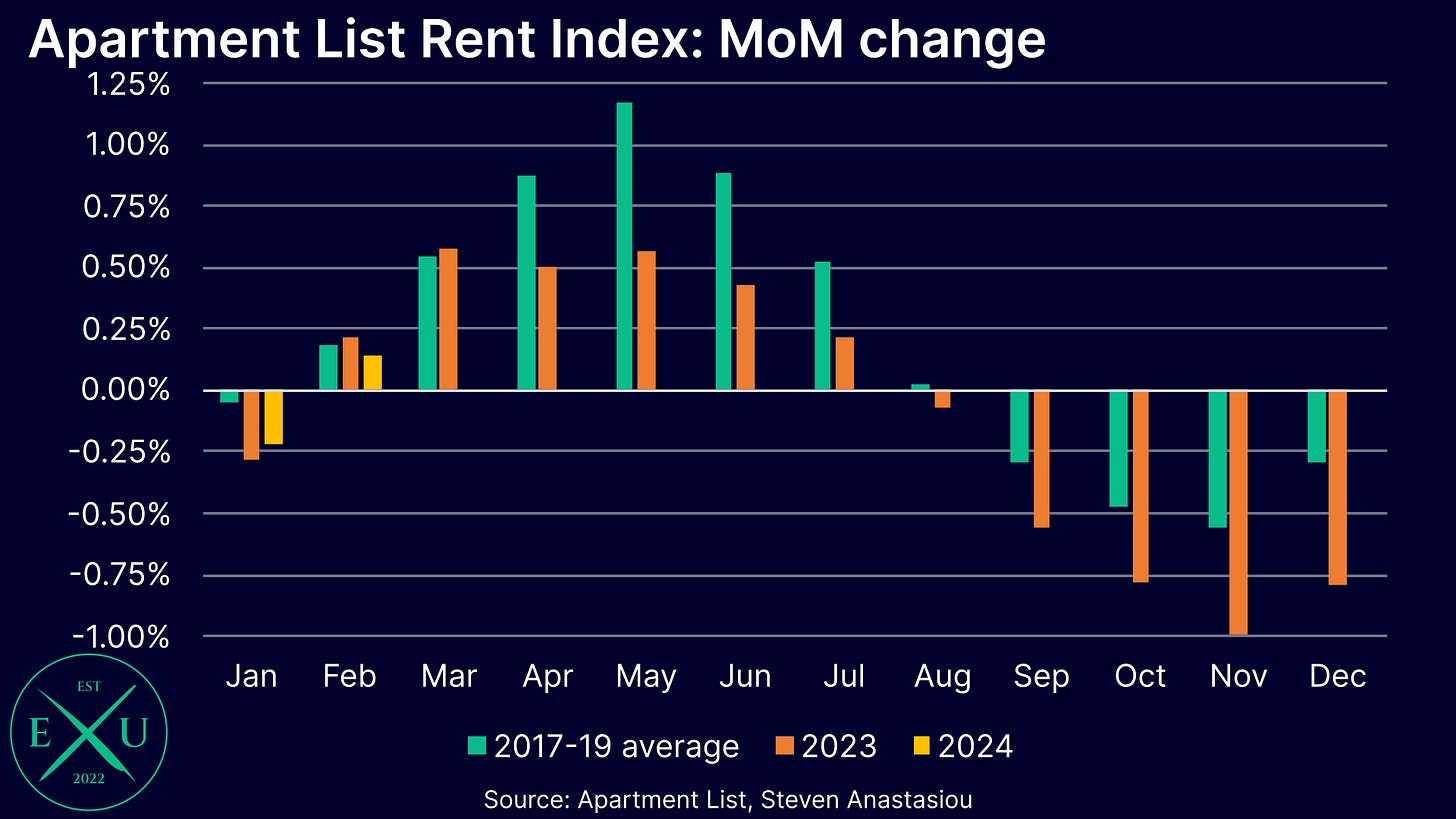
Starting firstly with the Apartment List Rent Index, we can see that it has been recording outright YoY deflation for nine consecutive months, and that MoM growth has been below its respective historical average for 11 consecutive months — although the strength of the below average change has moderated over the past two months.
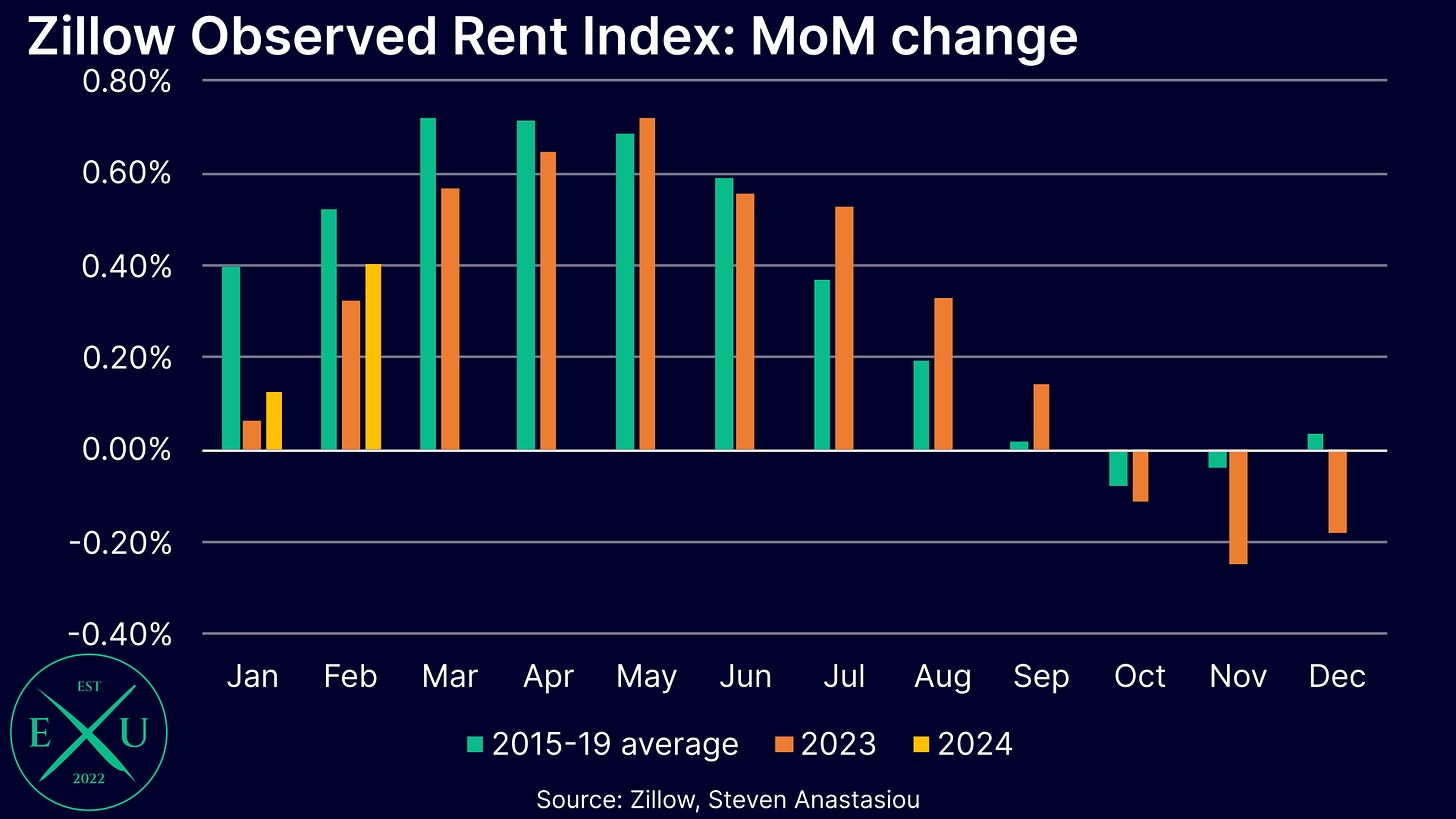
Turning now to the Zillow Observed Rent Index (ZORI), we can see that YoY growth has fallen to 3.5%, down from a peak of 16.0% in February 2022.
While this is slightly above the trough of 3.3% that was reached in September, with MoM growth coming in below its respective historical average for five consecutive months, a disinflationary trend remains in place.
Given the major deceleration from peak levels, spot market rents have suggested for sometime now, and continue to suggest, that both OER and RPR will see a significant deceleration in growth.
In light of this backdrop, let’s now review the growth rates that OER and RPR have actually been recording over the past year.
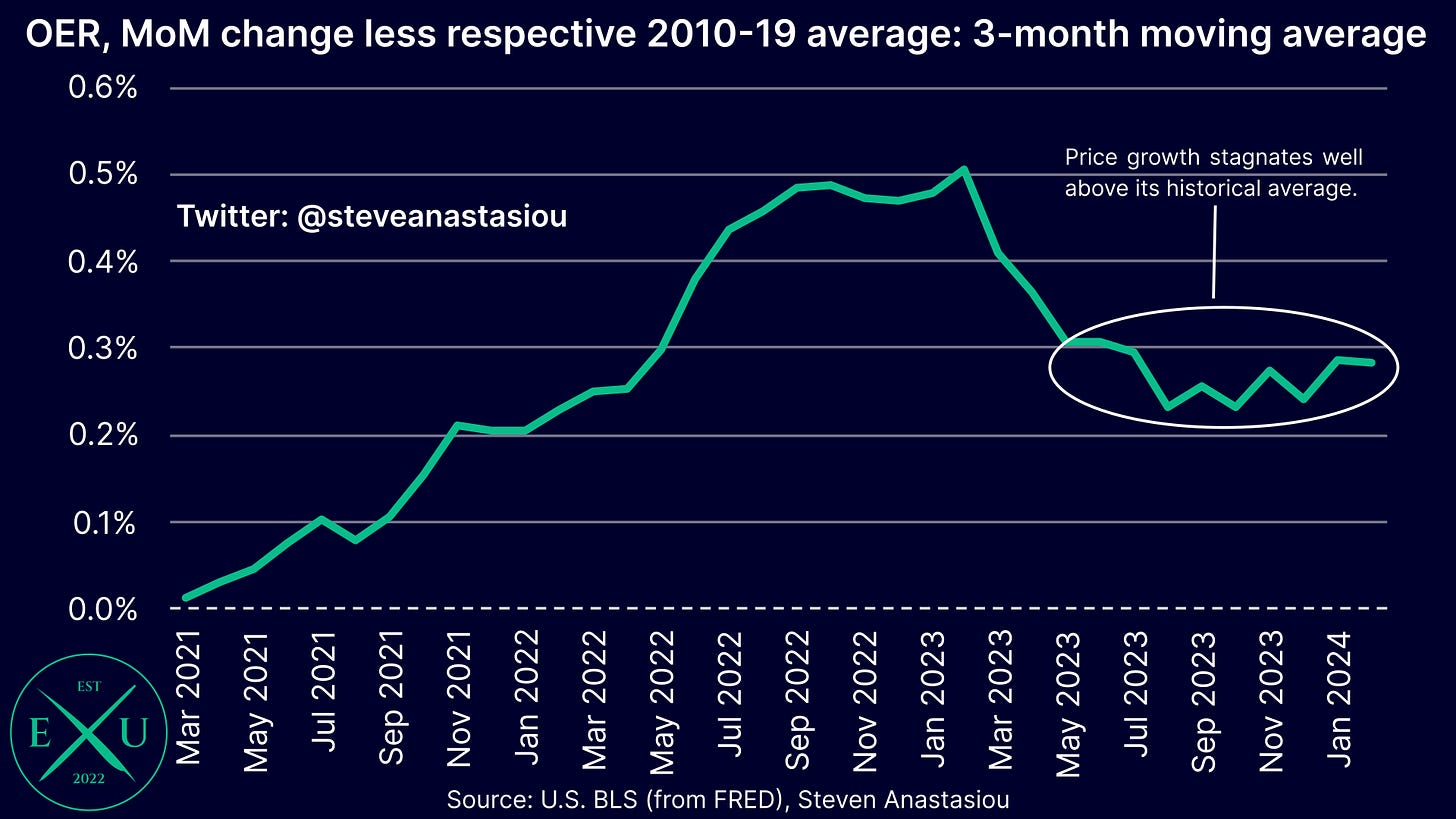
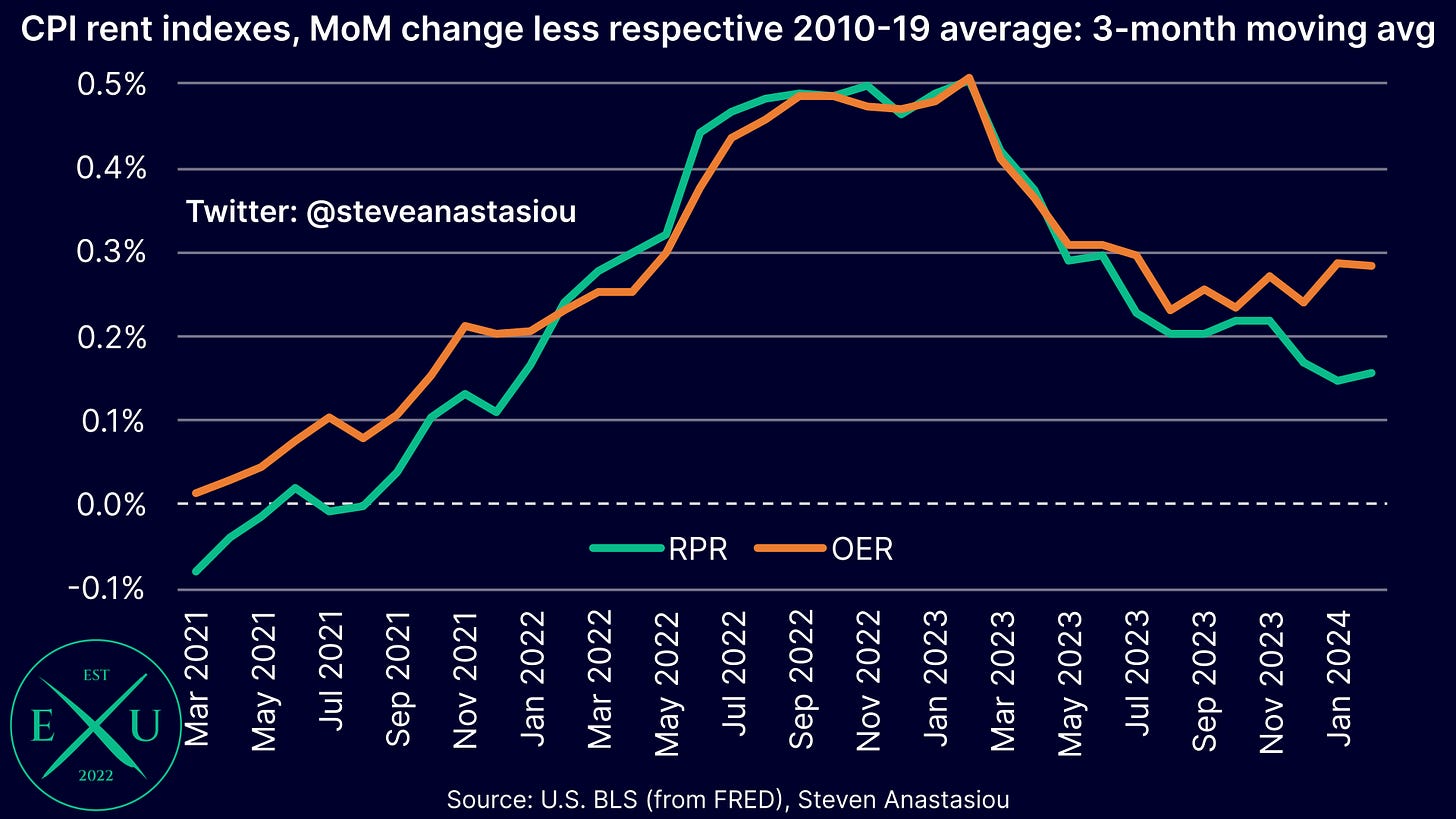
Looking at growth on a 3-month moving average basis in order to smooth out monthly volatility, and comparing growth to its respective historical (2010-19) average, shows that both OER and RPR decelerated significantly from March - May 2023. This deceleration occurred ~six months after the ALRI and ZORI began to record significantly lower MoM growth.
The very significant size of the deceleration in MoM growth, which came after a period of stabilisation at high levels (as opposed to a period of increasingly stronger MoM growth), strongly suggested that the CPI’s rent based measures had turned a corner and were now on a pathway towards decelerating materially.
Indeed, RPR has shown a continued downtrend in price growth, with MoM growth just 0.16% above its historical average in February on a 3-month moving average basis, versus a peak of 0.50% in February 2023.
In contrast to this ongoing deceleration, OER recorded 3-month moving average growth that was 0.28% above its historical average in February, which while down materially from a peak of 0.51% in February 2023, it has barely moved from the level of 0.31% that was recorded in May 2023. Indeed, if anything, it has actually been trending slightly higher over recent months.
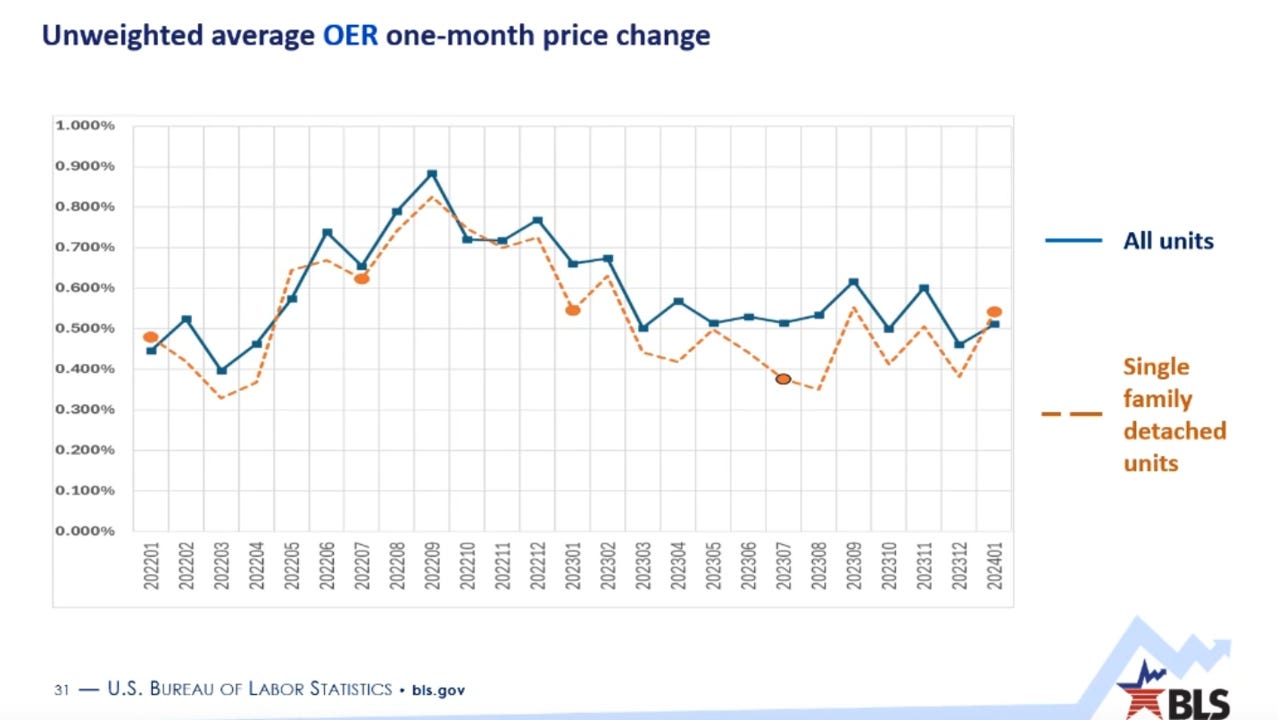
While some may conclude that this is a result of the higher growth that is being recorded in attached housing rents (with OER having a significantly higher weighting to single-family detached housing versus RPR), the BLS’ own data shows that single-family detached housing has actually generally been recording slower growth than other housing types.
For more information on the recent change that saw OER receive a further increase in its weight to single-family detached housing, please see my prior research piece, here.
Given that the higher weight to single-family detached housing isn’t driving the higher growth, this suggests that other factors are driving the ongoing deceleration in RPR, which may include its inclusion of utilities — RPR measures “economic rent”, which incorporates the value of utilities, whereas OER measures “pure rent”.
Given its “pure rent” scope, the stagnation in OER suggests that the BLS’ rental sample saw some disinflation from peak levels, but has not seen an ongoing moderation like that shown by the various private sector measures of spot market rents, and as such, the long awaited deceleration in OER may not actually be forthcoming.
Though before making such a conclusion, we first need to look at an additional rental dataset that is provided by the BLS. While it is not as commonly known, in my view, this dataset actually provides the best leading indicator of the CPI’s rent based indexes.
The latest information contained within this dataset reveals that there’s likely to be a MAJOR shift in the CPI’s rent based measures during 2024, which in-turn, points to MAJOR ramifications for both CPI and PCE Price Index inflation.
Let’s now undertake a deep dive of this data, and analyse what it likely means for OER and RPR.


