November's US CPI data reveals deepening disinflation: initial thoughts
From falling new car prices to services prices, the latest CPI data provides further confirmation that disinflation is spreading, and deepening.
November CPI aggregates vs my forecasts 🔍
For the month of November, my headline US CPI forecast of 3.14% was equal to the actual result, and down from 3.35% in October.
Meanwhile, core CPI growth came in below my estimate for a second consecutive month, managing to eke out an eighth consecutive month of disinflation on a two decimal place basis.
Used car prices unexpectedly rise, new car prices unexpectedly fall 🚗
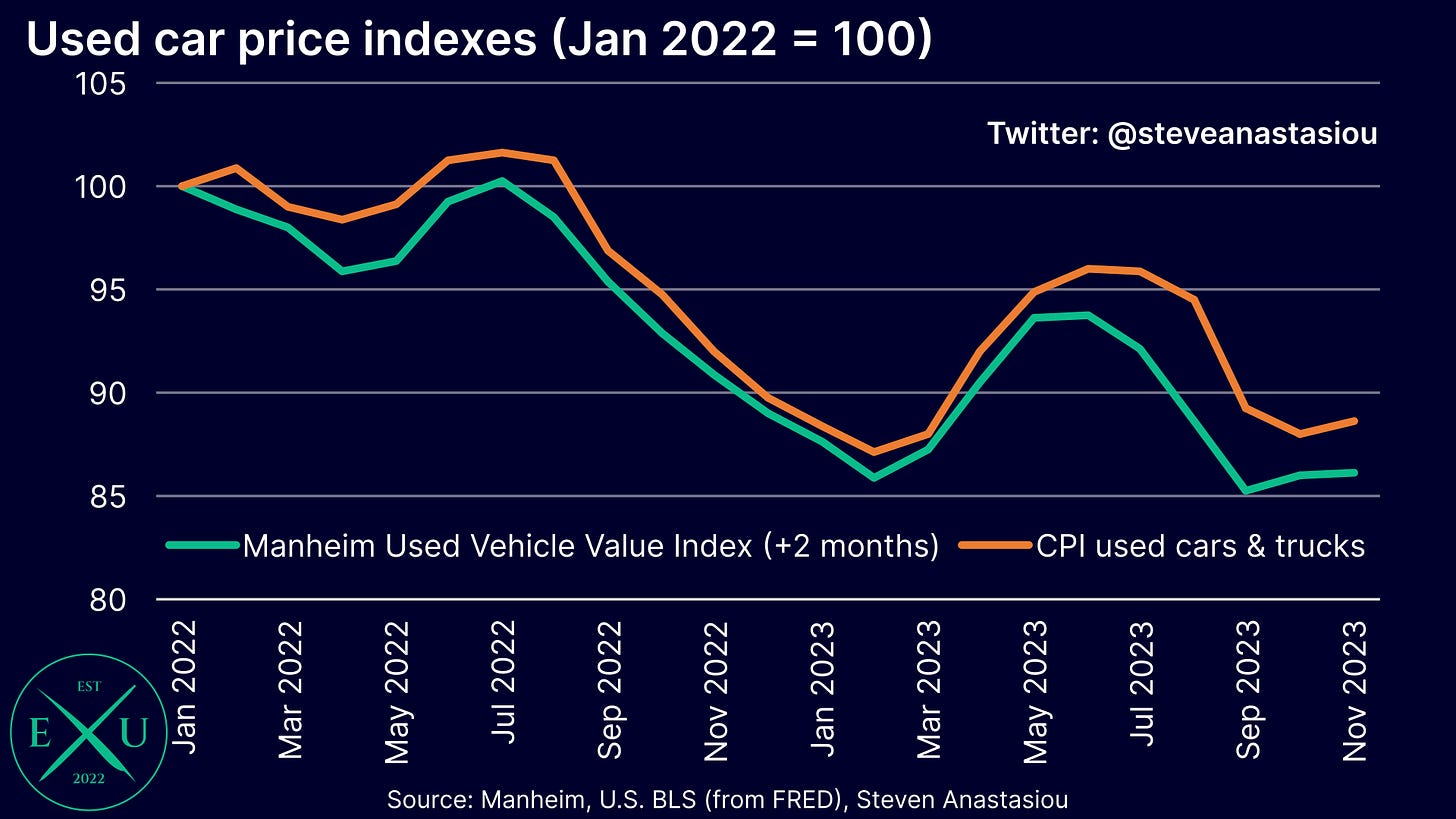
Given the prior move in wholesale prices, the seasonality in retail used car prices, and the relative levels of wholesale vs retail used car prices, I had expected used car prices to record a MoM decline for a 5th consecutive month — instead, they rose.
This has increased the gap that exists between wholesale and retail used car prices.
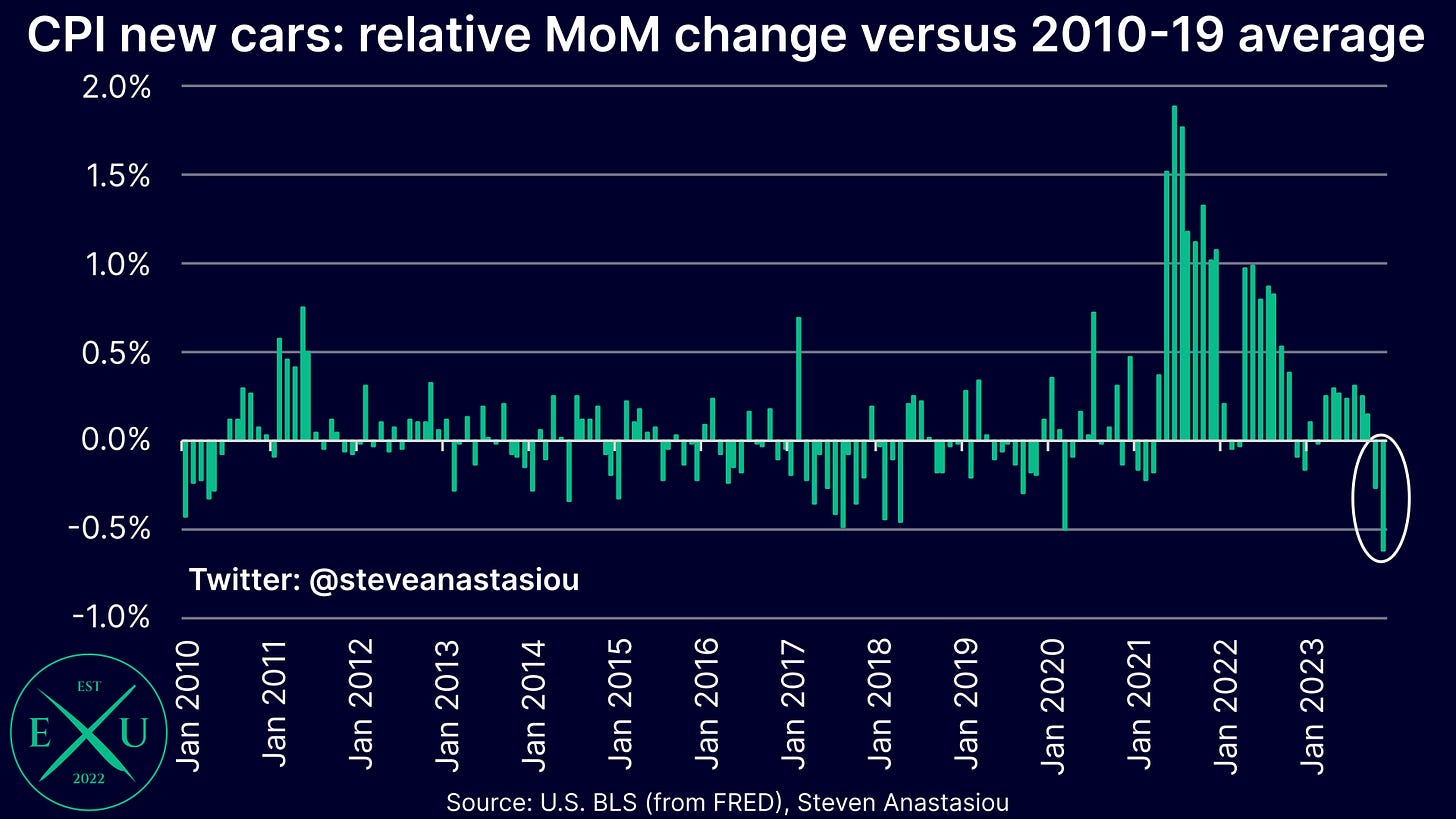
Though the unexpected increase in used car prices was offset by an unexpected decline in new car prices. This resulted in a second consecutive month of relatively lower MoM new car price growth, with MoM growth 0.6% below the 2010-19 average for November — going all the way back to 2010, this was the lowest relative MoM growth that has been recorded.
After long stretches of significantly above average MoM growth since April 2021, new car price growth has now shown significant signs of material disinflation.
Services price disinflation strengthens — lagging motor vehicle insurance is a key driver of apparent high growth
Focusing on the core services side of the CPI equation, a detailed review reveals that additional further progress was seen in November.
When analysing core services prices, it’s currently important to exclude shelter costs (which are lagging and currently heavily overstating the underlying move in spot market rents). It’s also important to exclude the CPI health insurance component, which is indirectly measured and has seen huge gyrations over recent years (meaning that it is often unlikely to reflect the underlying reality of prices paid by consumers). I also exclude the inconsistently measured CPI household operations component.
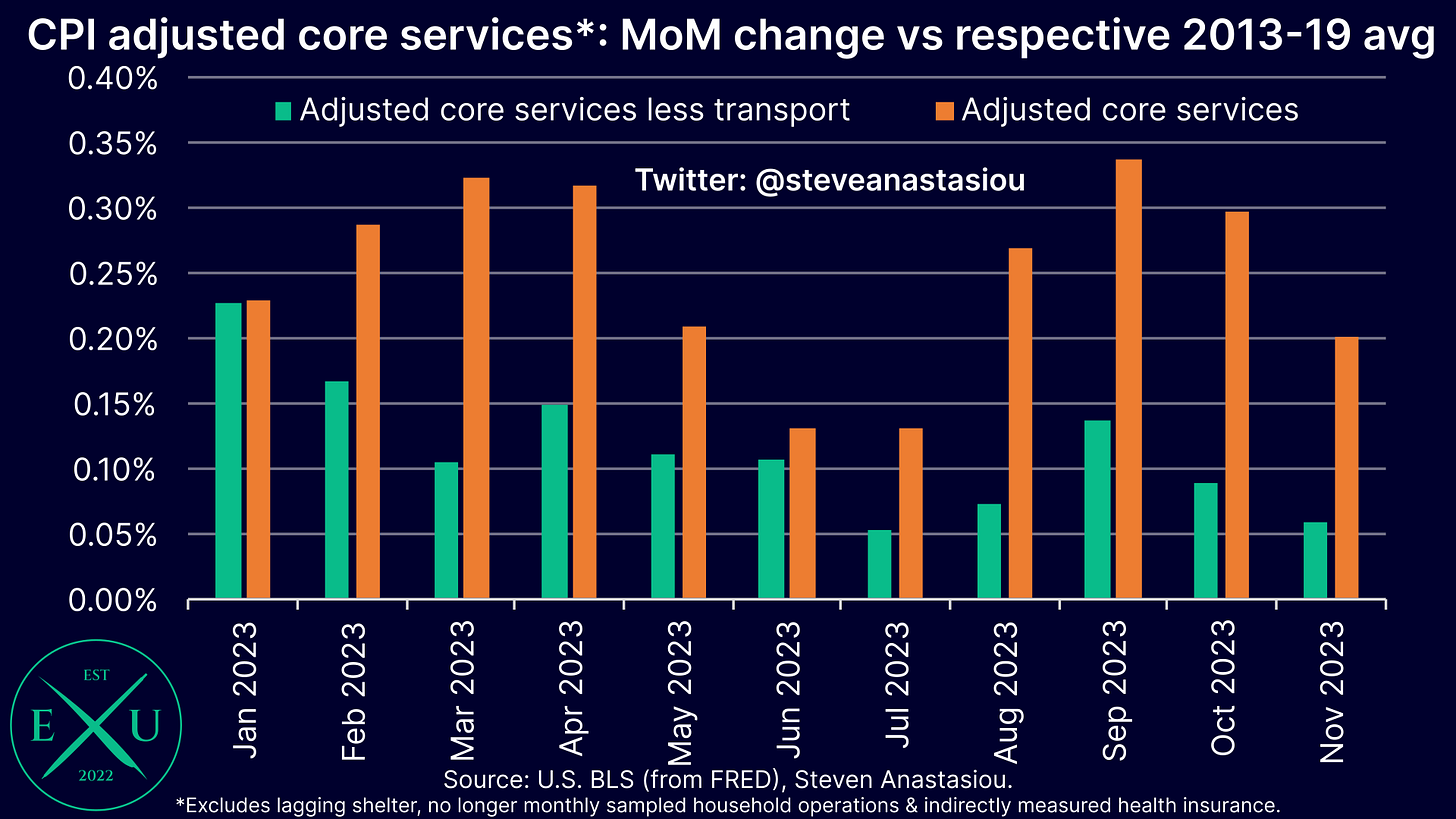
On such a basis, MoM price growth has remained elevated (often very significantly) since January 2022. On a 3-month moving average basis, MoM growth peaked at more than 0.3% above the historical monthly average in September. Since then, some disinflation has occurred, but MoM growth remained 0.2% above the 2013-19 average in November.
Though it’s important to note that this growth has been significantly distorted by just two line items — one of which is now showing significant signs of decelerating.
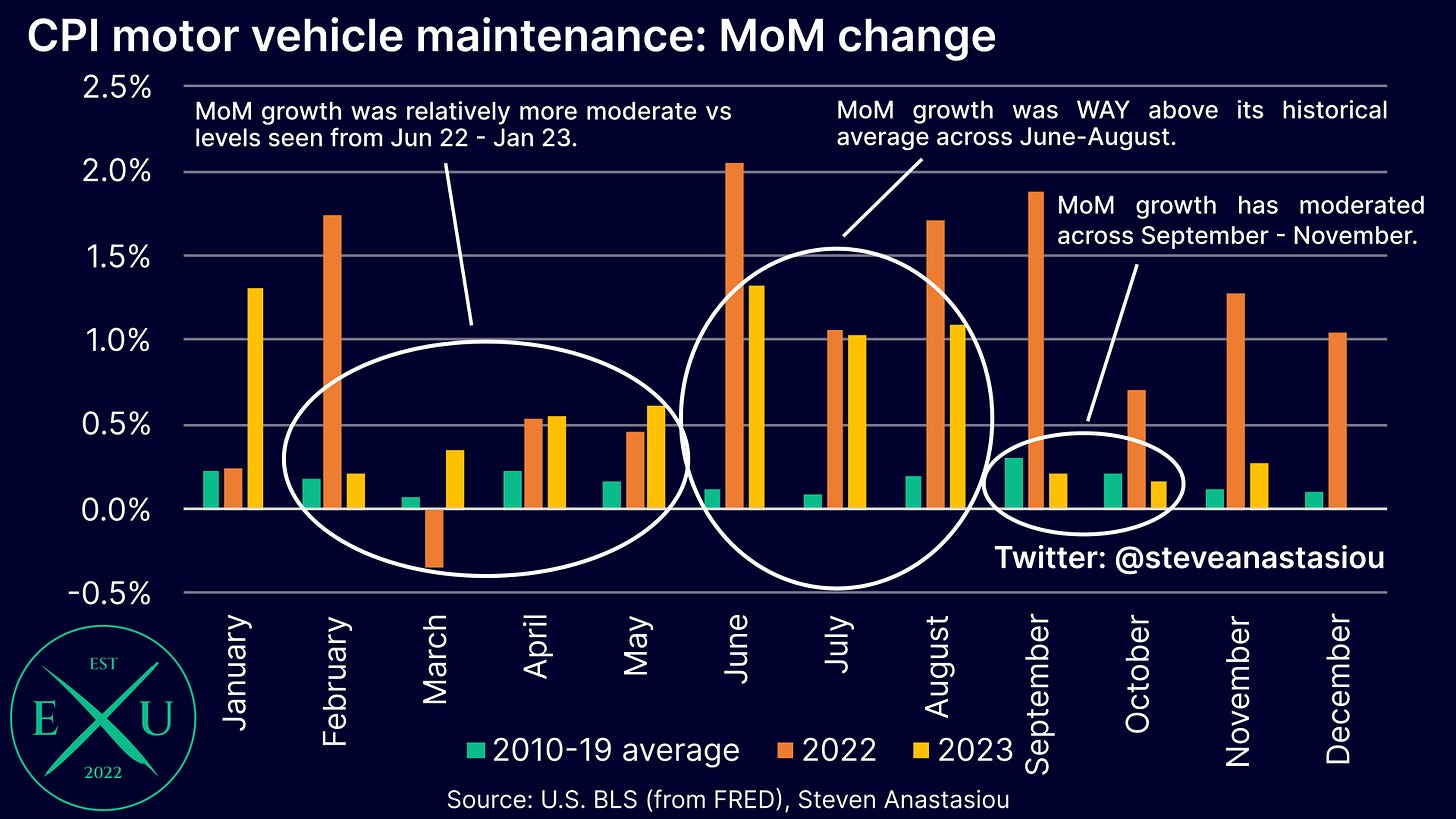
The two items are CPI motor vehicle maintenance, and CPI motor vehicle insurance.
After seeing growth peak at 14.2% YoY in January, growth in CPI motor vehicle maintenance prices has decelerated significantly, with MoM growth in-line with its 2010-19 average on a 3-month moving average basis in November.
CPI motor vehicle insurance prices rose by an enormous 19.2% YoY in November, and are mechanically lagging in nature, with price growth reflecting the prior surge in used car prices, as well as increases in repair costs. Now that used car prices have fallen materially from peak levels, CPI motor vehicle insurance price growth would be expected to moderate over time — there are now some initial signs of this occurring, whereby in relative terms, November’s MoM CPI motor vehicle insurance price growth was the slowest that has been seen since November 2022.
Once the transport component is excluded (which includes both CPI motor vehicle maintenance and CPI motor vehicle insurance prices), one can see that adjusted core services price growth has been much more modest. On a 3-month moving average basis, MoM growth was just 0.06% above its respective 2013-19 average in November, indicating a broadening of services price disinflation.
All items less lagging shelter shows the extent of the disinflation that’s taken place
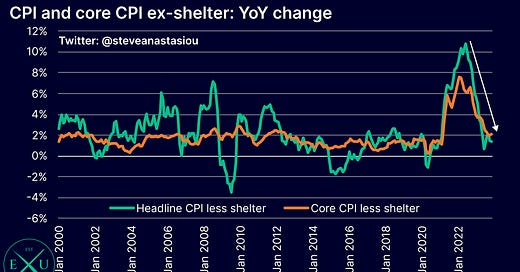
Looking at the CPI as a whole, but simply removing the lagging shelter component, clearly shows the large amount of disinflation that’s taken place.
The headline CPI ex-shelter index recorded its third consecutive month of relatively weaker MoM growth versus its 2010-19 average in November. This saw YoY growth fall to 1.4% — in-line with its 2010-19 average.
Meanwhile, the core CPI ex-shelter index also recorded MoM growth that was below its historical average for the third consecutive month in November. On an annual basis, growth was 2.1% — while this is materially above the 2010-19 average of 1.4%, it marks a major deceleration from peak levels, and appears likely to fall further as higher prior comparables are cycled in 1H24.
Summary 📝
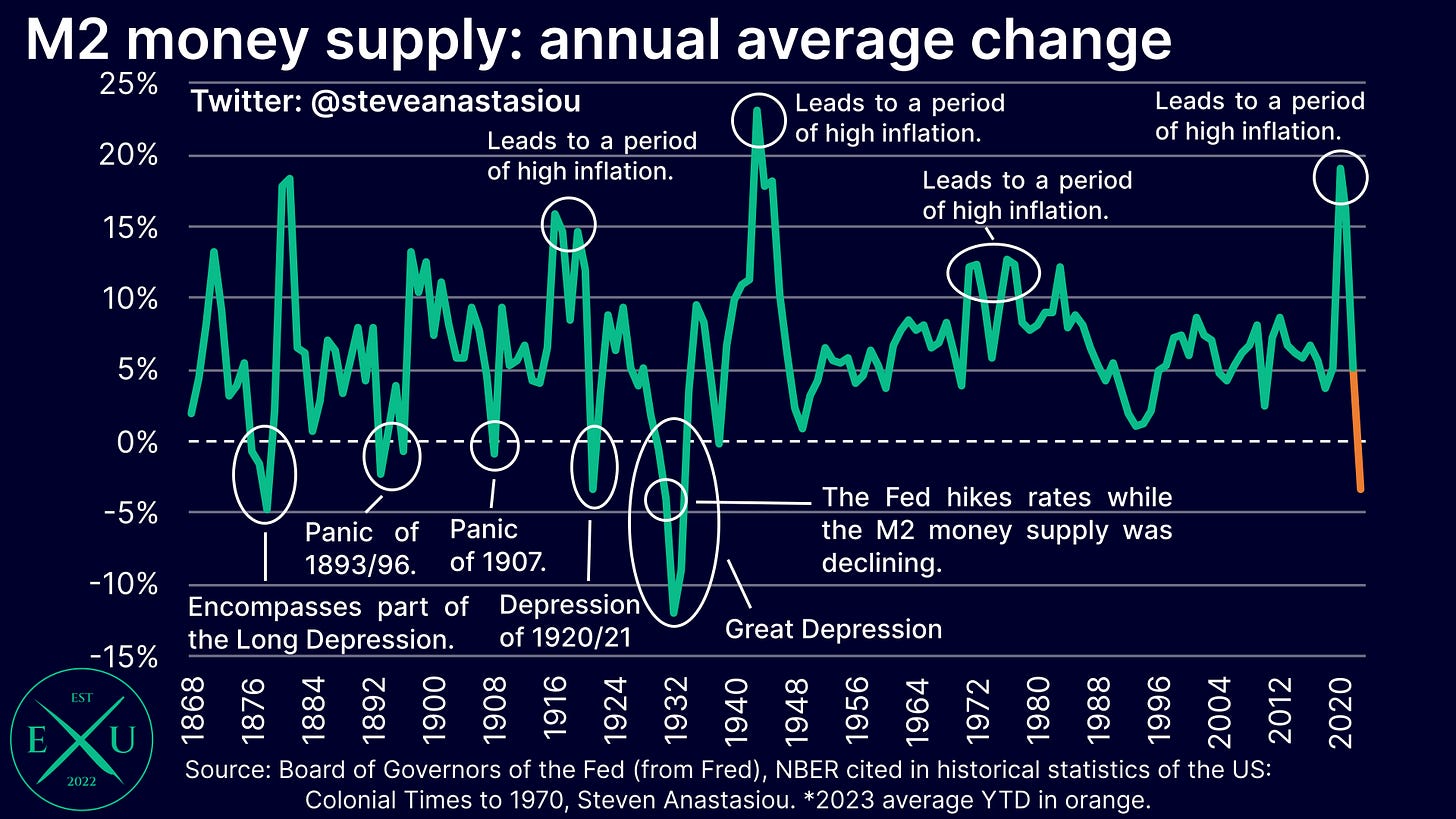
Given the move in the M2 money supply, and the clear disinflation that has been visible for a significant length of time, for some time now, I have been contending that monetary policy does not need to be this tight in order to further reduce inflation, and that the Fed can instead adopt a loosening bias — this view was again articulated after reviewing the latest PCE data, which you can read about here.
The latest CPI data only acts to reinforce this view, whereby from new car prices to services prices, a broadening and deepening of the current disinflationary cycle was evident.
I hope you enjoyed this short summary of the latest US CPI data, which I have provided in order to give you my latest thoughts and insights in a more timely manner. Stay tuned for my full US CPI Review, which will include flash forecasts for December.
Thank you for reading my latest research piece — I hope that it provided you with significant value.
Should you have any questions, please feel free to leave them in the comments below!
In order to help support my independent economics research, please consider liking and sharing this post and spreading the word about Economics Uncovered. Your support is greatly appreciated and goes a long way to helping make Economics Uncovered a sustainable long-term venture, that can continue to provide you with valuable economic insights for years to come.
If you haven’t already subscribed to Economics Uncovered, subscribe below so that you don’t miss an update.




Thanks!