Continuing on from my previous CPI previews, the time has arrived for November’s edition. Here’s my 8 key points:
1) Gain a high-level overview by breaking inflation down into three key categories
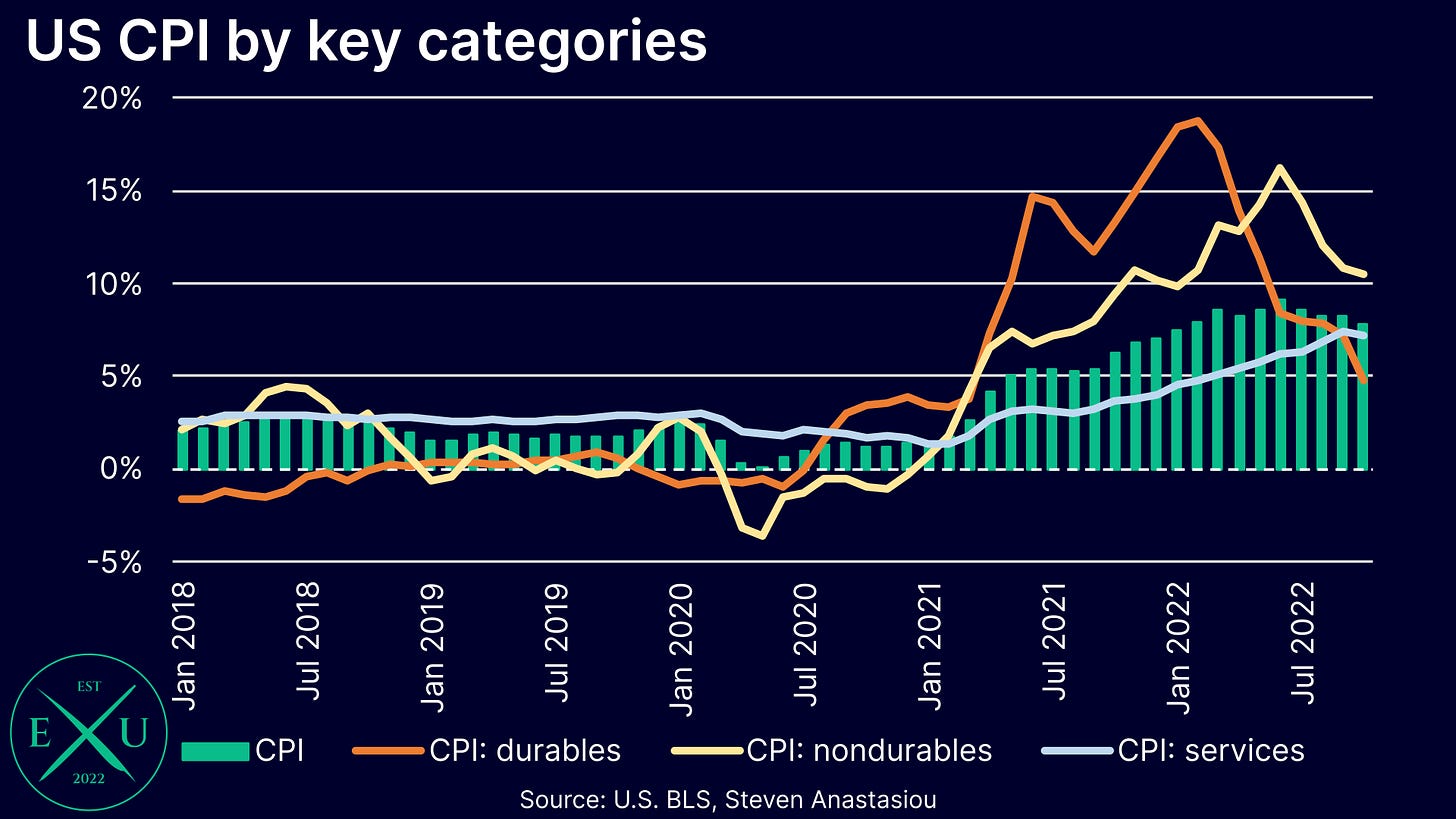
In order to gain a high level overview of the current inflation, one needs to firstly recognise that it has been marked by some COVID peculiarities. Namely, COVID lockdowns meant that spending on items that are already more elastic to stimulus measures (i.e. durable goods), was further exacerbated. As COVID stimulus checks were handed out whilst people were told to stay at home, spending on durable goods thus surged.
Given that durables were the first to see a rise in demand from the influx of newly printed money, they were the first category to see a large increase in prices. Nondurables followed, whilst the services category was the last to record significant price growth as the economy gradually re-opened. Services price changes also lagged due to the manner in which the CPI records rents.
Given this dynamic, it is important to analyse inflation by breaking down these three categories. From the chart below, one can see that after leading inflation higher, durables prices have since decelerated drastically, and fallen back below services price growth. This leads to the 2nd key point.
2) Expect another MoM decline in durables prices & a fall in the YoY rate to ~3%
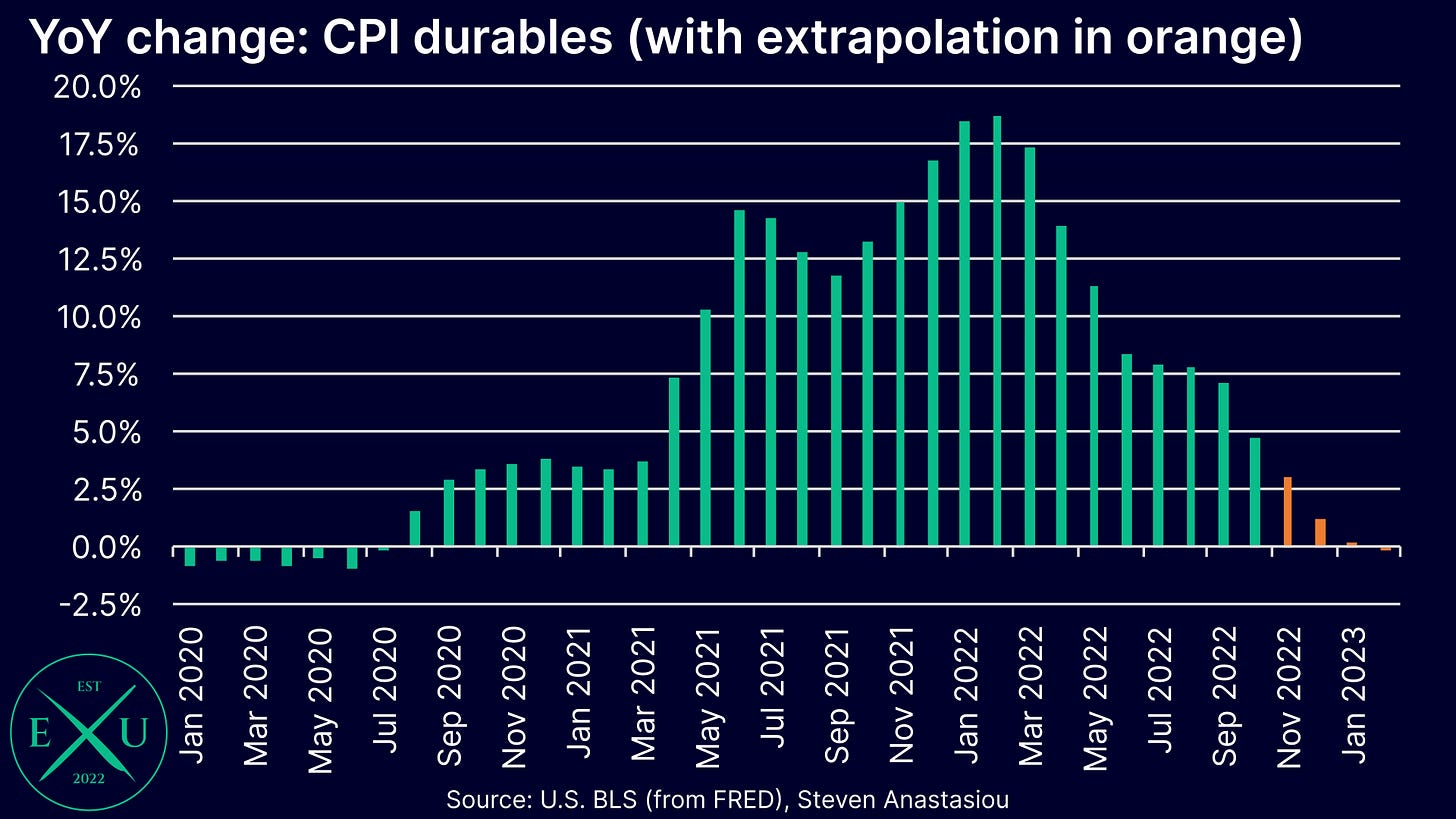
After leading inflation higher, durables are now leading inflation lower. Since peaking at a VERY fast YoY pace of 18.7% in February 2022, YoY price growth has slowed dramatically, falling to a YoY growth rate of 4.8% in October.
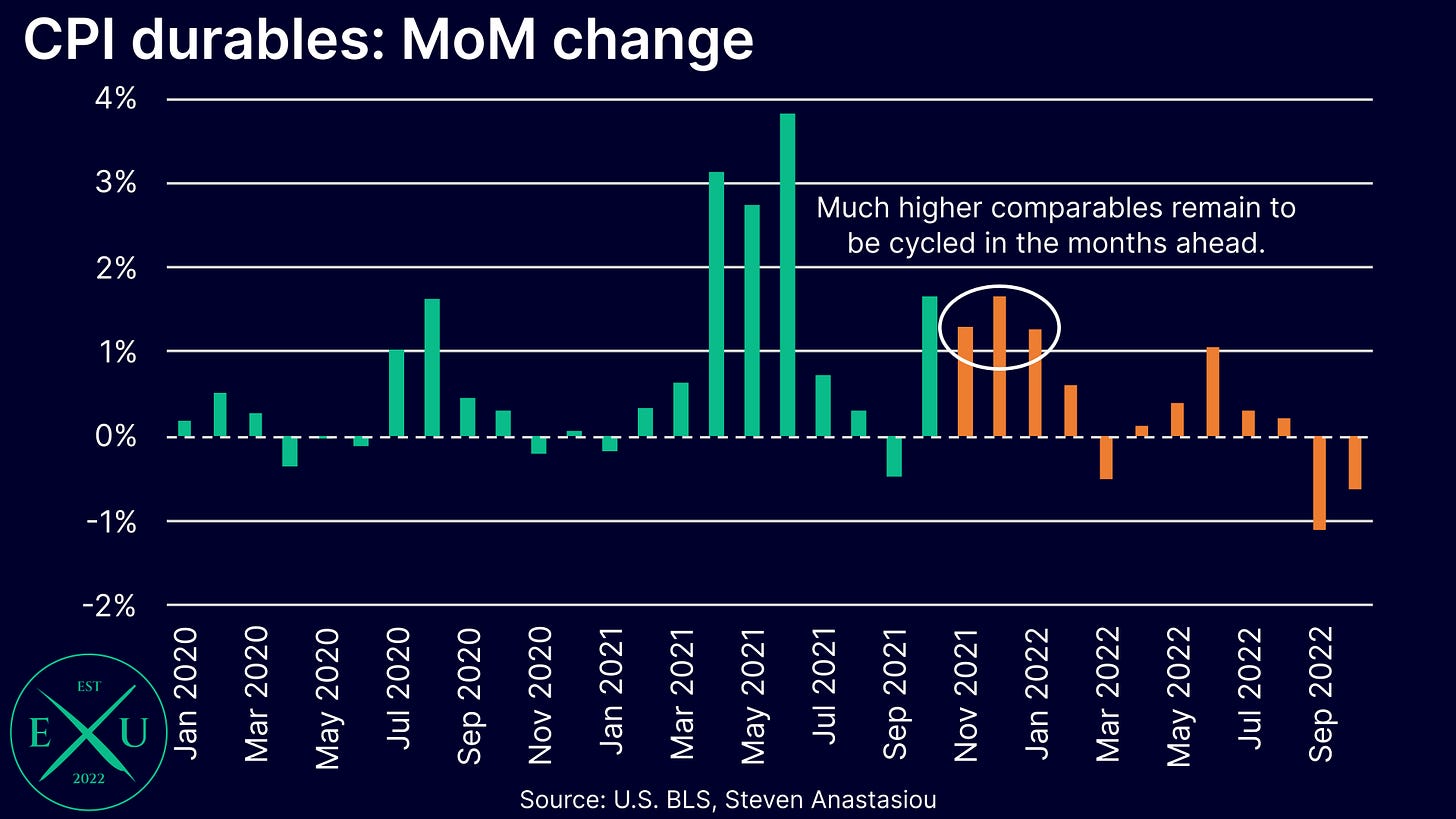
With high comparables to be cycled across November to January, the YoY rate is set to fall MUCH further over the months ahead.
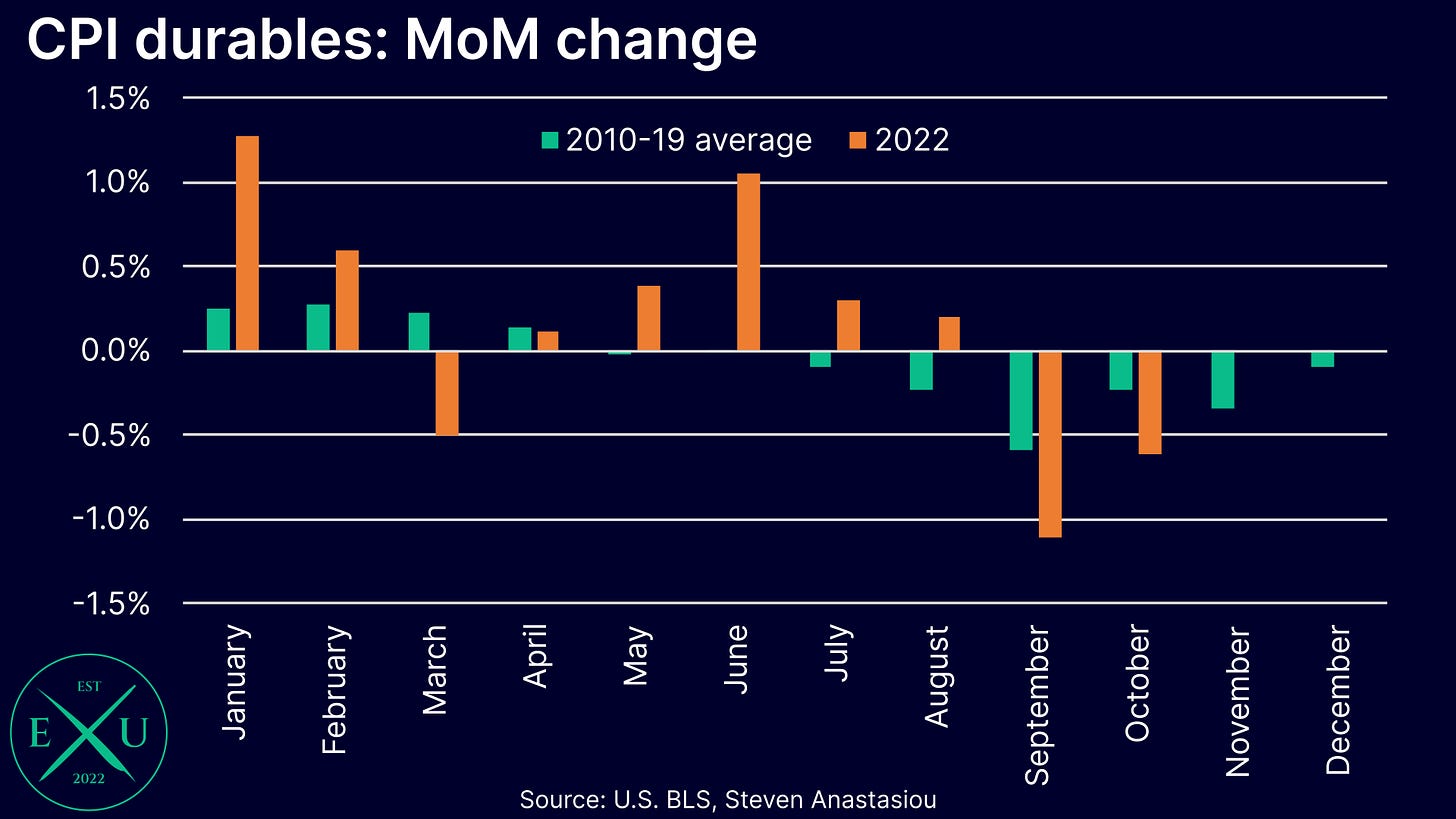
It is important to note that recent durables MoM price change momentum has shifted to the downside, as a slowing economy reduces demand for goods that individuals aggressively bought over the past two years. September saw the 2nd largest durables monthly price decline EVER recorded, whilst October’s price decline again materially outpaced its historical average fall.
Given that November is also a seasonally weak month for durables prices, another MoM durables price decline would appear likely.
A fall of 0.4% in November would take the YoY durables growth rate to 3%. While this would slightly outpace the average November price change from 2010-19 (0.34%), a larger decline than has been observed historically would be in-line with recent monthly price changes. If December - February see MoM price changes in-line with their historical averages (something that I view as a conservative base-case given falling M2 and recent trends), the YoY growth rate will fall closer to 1% in December, almost reach breakeven in January 2023, and turn YoY NEGATIVE in February.
3) Food at home prices should show further deceleration
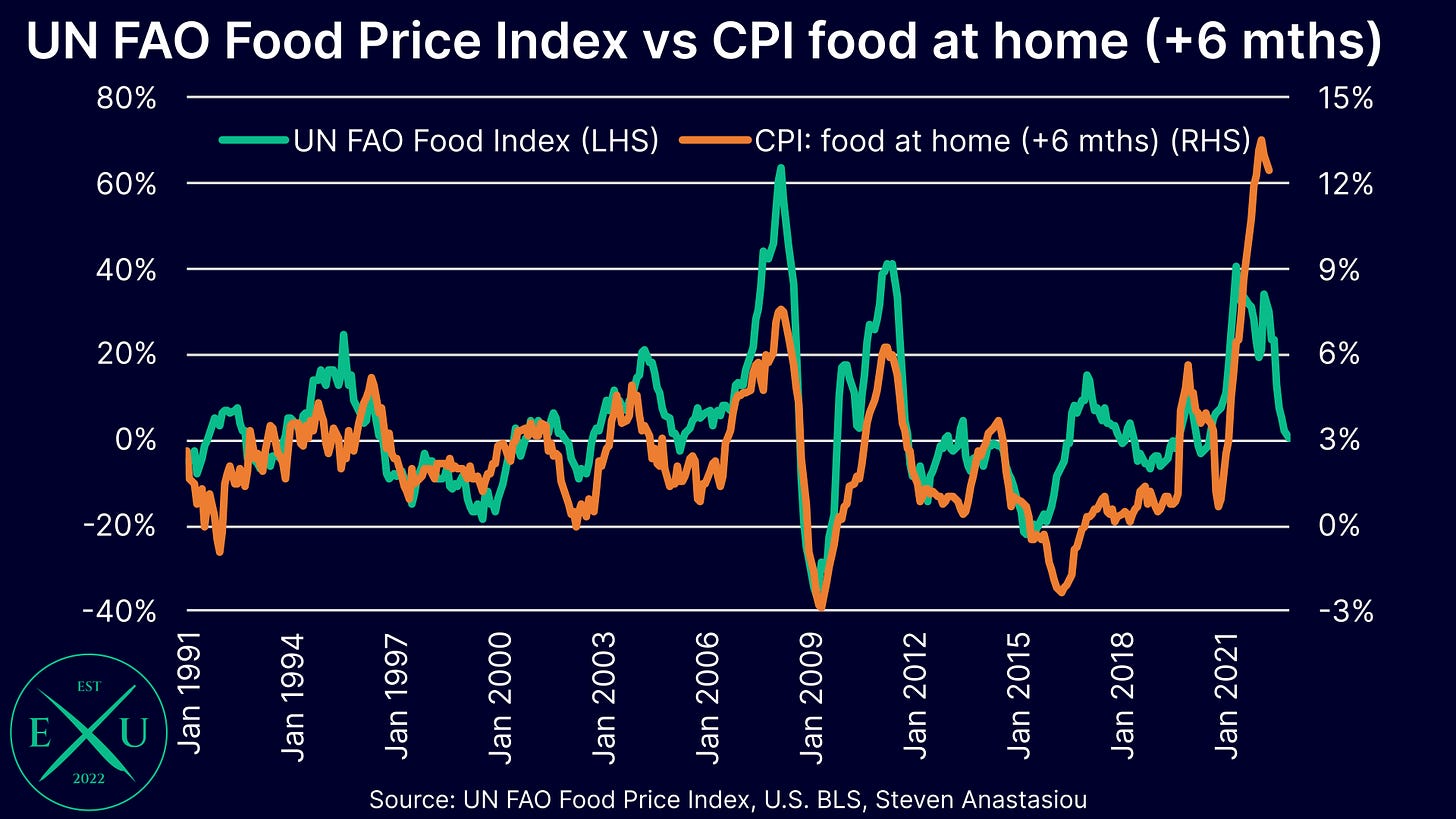
Whilst food prices have continued to record strong increases in the CPI over recent months, with YoY growth equal to 10.9%, lower prices for underlying food commodities (as measured by the UN FAO Food Price Index) suggests that this figure should begin to turn lower over the months ahead — particularly for food at home prices.
Whilst lower prices for food commodities will also reduce price pressures for food away from home, it is likely to be less concentrated given that prices here are also significantly influenced by the broader costs that are involved with running businesses like restaurants, including wages, rents and energy.
Given this, let’s dive deeper into the UN FAO Food Price Index and the CPI’s food at home index. The UN FAO Food Price Index tells us about the moves in food commodities across several key groups: meat, dairy, cereals, oils and sugar. The UN FAO Food Price Index, and the CPI’s food at home index, have historically shared a very strong correlation when the CPI’s food at home index is lagged by 6 months.
Given that the UN FAO Food Price index has now declined for 8 consecutive months, one would thus expect the CPI’s food at home prices to record materially lower growth rates over the months ahead.
Whilst the historical correlation would suggest CPI food price growth at a rate that is largely consistent with a 2% CPI in ~6 months time, it is important to note that whilst the directional changes appear to have held up since COVID, the strength of the relationship has significantly delinked amidst broader inflation pressures. With high comparables recorded as recently as last month, the return to 2% food at home prices is likely to take a significant length of time (roughly how long remains highly unclear at this stage). Right now, the important point is that food at home price growth should continue its recent MoM decelerations.
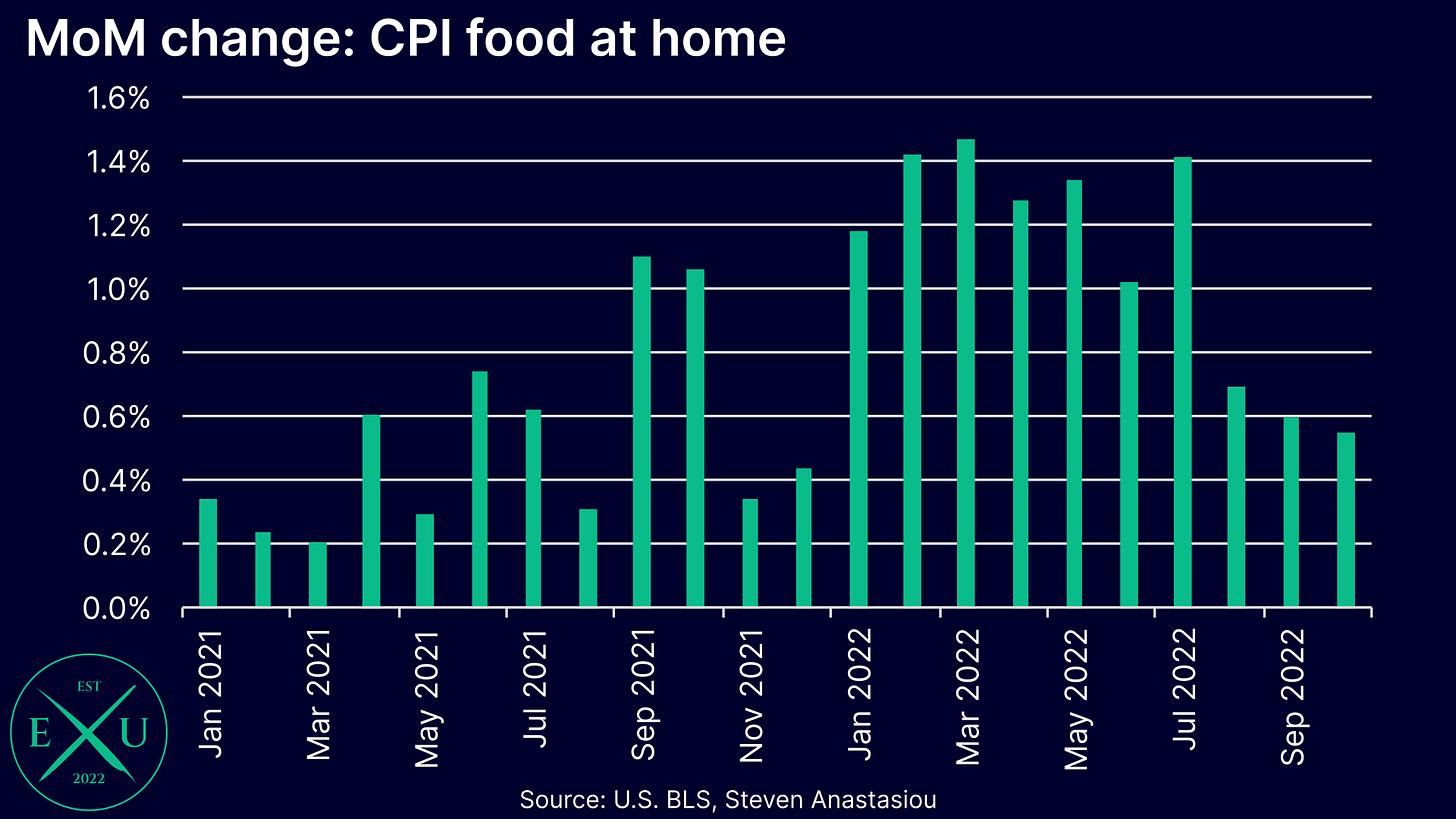
Looking more closely at those recent decelerations, food at home prices have recorded decelerating growth for the past three months, with MoM growth rates well below the levels seen from January to July. Whilst a significant decline in the YoY rate is unlikely to be seen until these higher comparables begin to by cycled in January 2023, with November historically being a seasonally weak month for food at home price changes (average of -0.3% from 2010-19), it will be important to see whether a significant MoM deceleration is recorded in November.
4) Lower gasoline prices should see a fall in CPI energy commodities
In addition to recent declines in durables prices and falling food commodity prices, gasoline prices have been recording significant declines since peaking in June, where prices have fallen in every subsequent month with the exception of October.
The average price of regular all formulations gasoline fell by 3.4% in November to $3.69 per gallon. This resulted in the YoY growth rate falling from 15.9% in October to 8.5% in November — the YoY growth rate was 60.9% in June. This MoM decline should largely correlate to the CPI’s energy commodities index.
5) While likely to remain elevated, MoM CPI rent measures may see some moderation
The high growth rate of shelter costs (which are primarily composed of rent related prices) has been a major topic of discussion in regards to US inflation given its lagging nature. This lag occurs on account of most of the CPI’s housing sample consisting of rents that are under fixed-lease agreements, the bulk of which are for 12 month terms. It can thus take a significant length of time for the CPI’s rental sample to reflect current market rents when the latter is experiencing rapid MoM changes. This also makes forecasting shelter price changes in the CPI difficult.
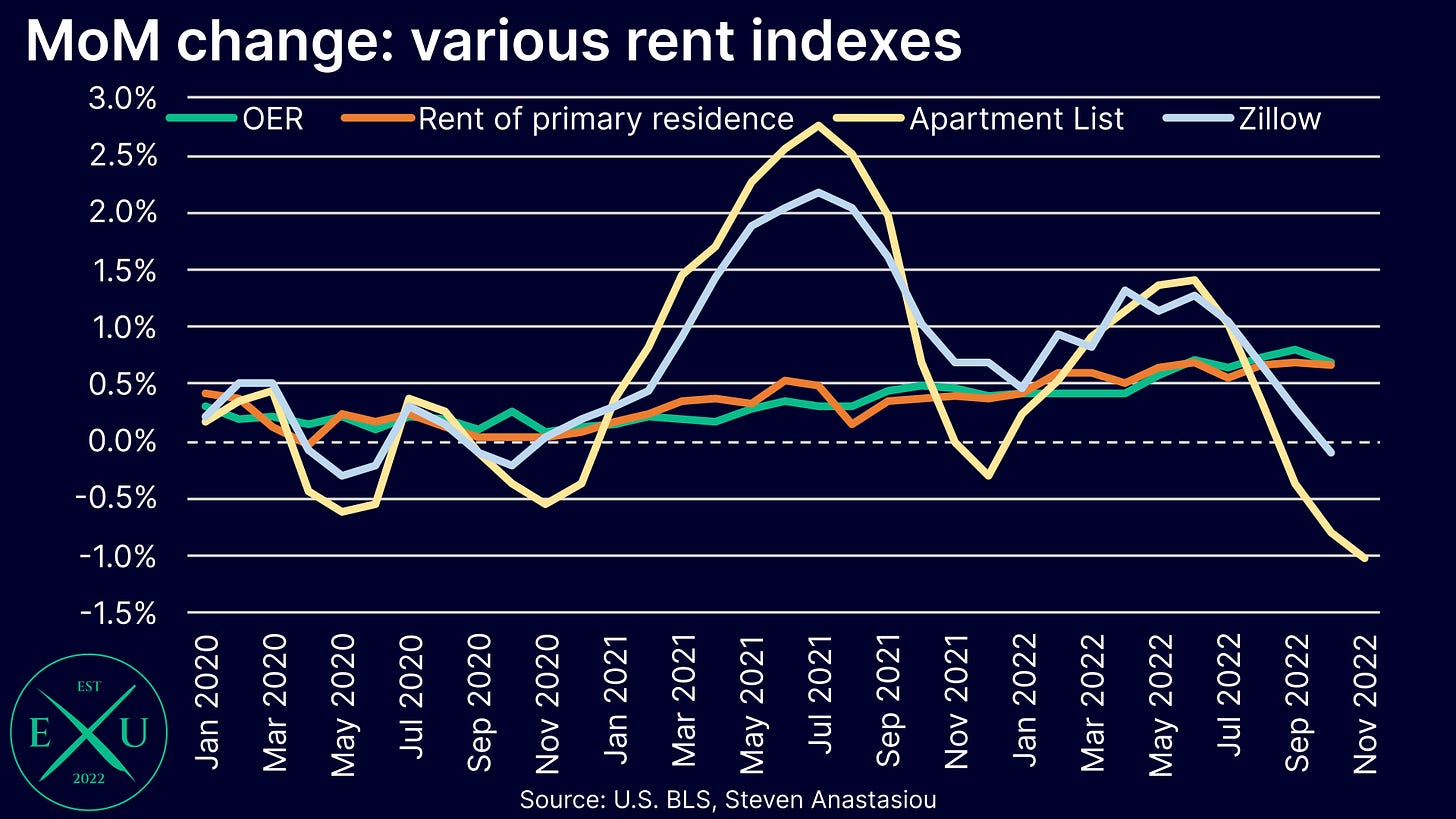
When trying to undertake such a forecast, the first key thing to recognise is that the market based measures have recently seen major MoM price deceleration, and some measures are now recording outright MoM declines.
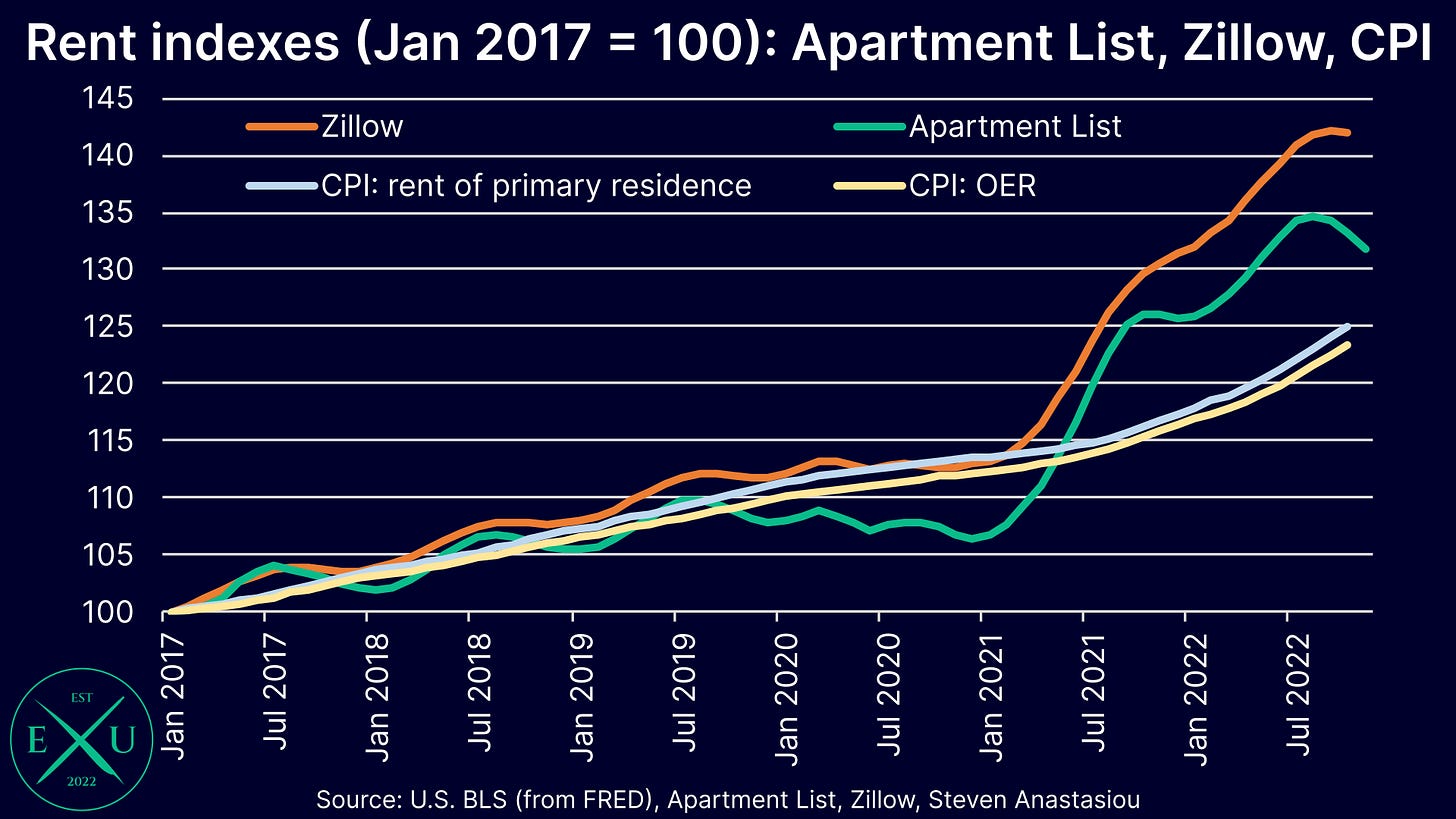
Given the CPI’s rent based measures having been recording strong growth, the gap between the CPI’s rental based measures, and actual market rents, is narrowing. On some measures, including Apartment List’s, which has updated data for November, the two indexes have begun to converge significantly. Other market based measures, such as Zillow’s, continue to show a larger gap.
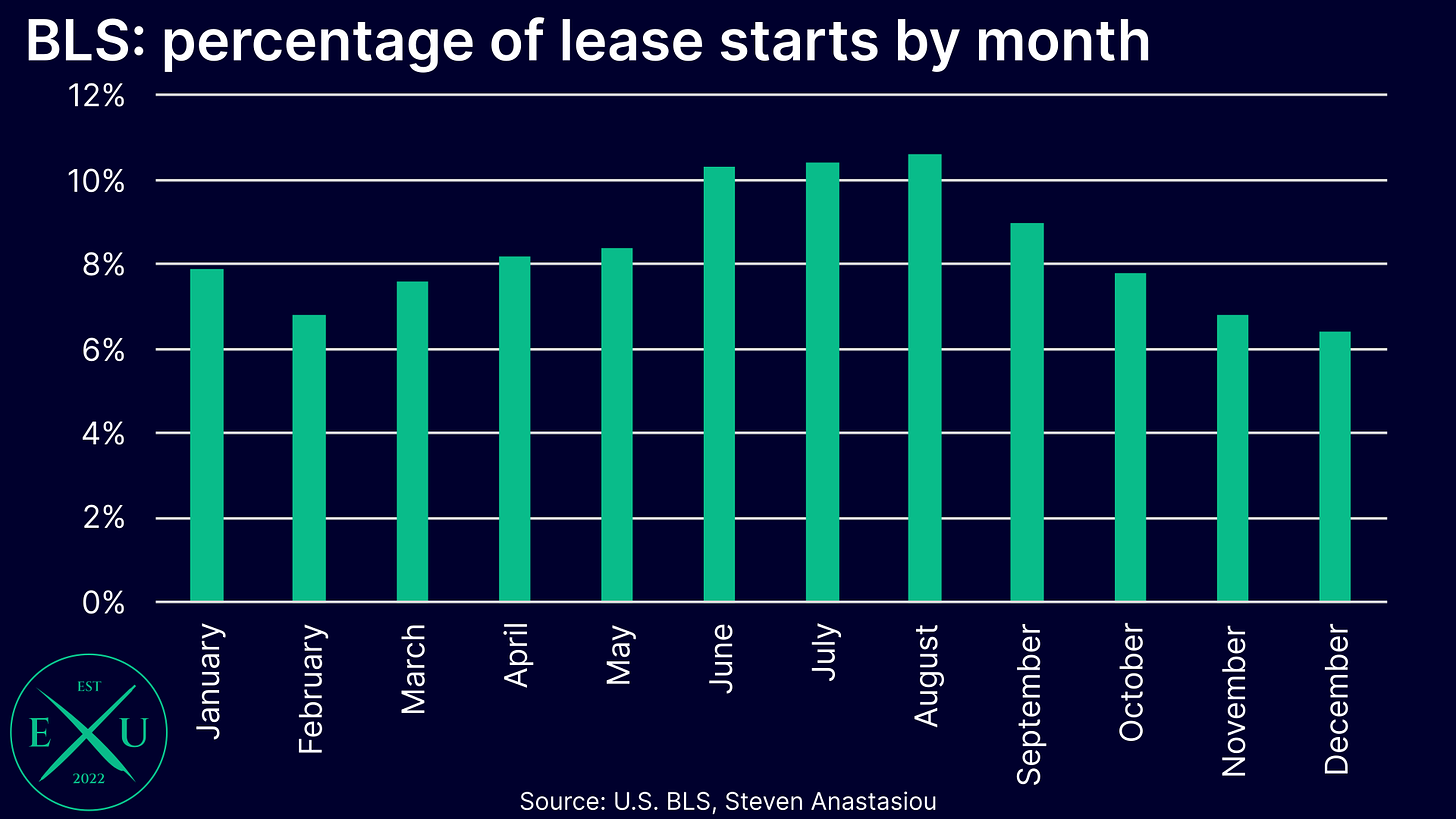
While monthly growth rates are likely to remain high for some time to come given the current divergence between the CPI’s rent based indexes and indexes which measure spot market rents, given that 1) the CPI’s rent indexes and market rents are converging, and 2) there are generally a smaller proportion of new leases started over the winter months, it would not be surprising to see a moderation in the MoM growth rate of the CPI’s rent based measures in November, and a further ongoing moderation over the months ahead.
6) Health insurance should continue its major reversal
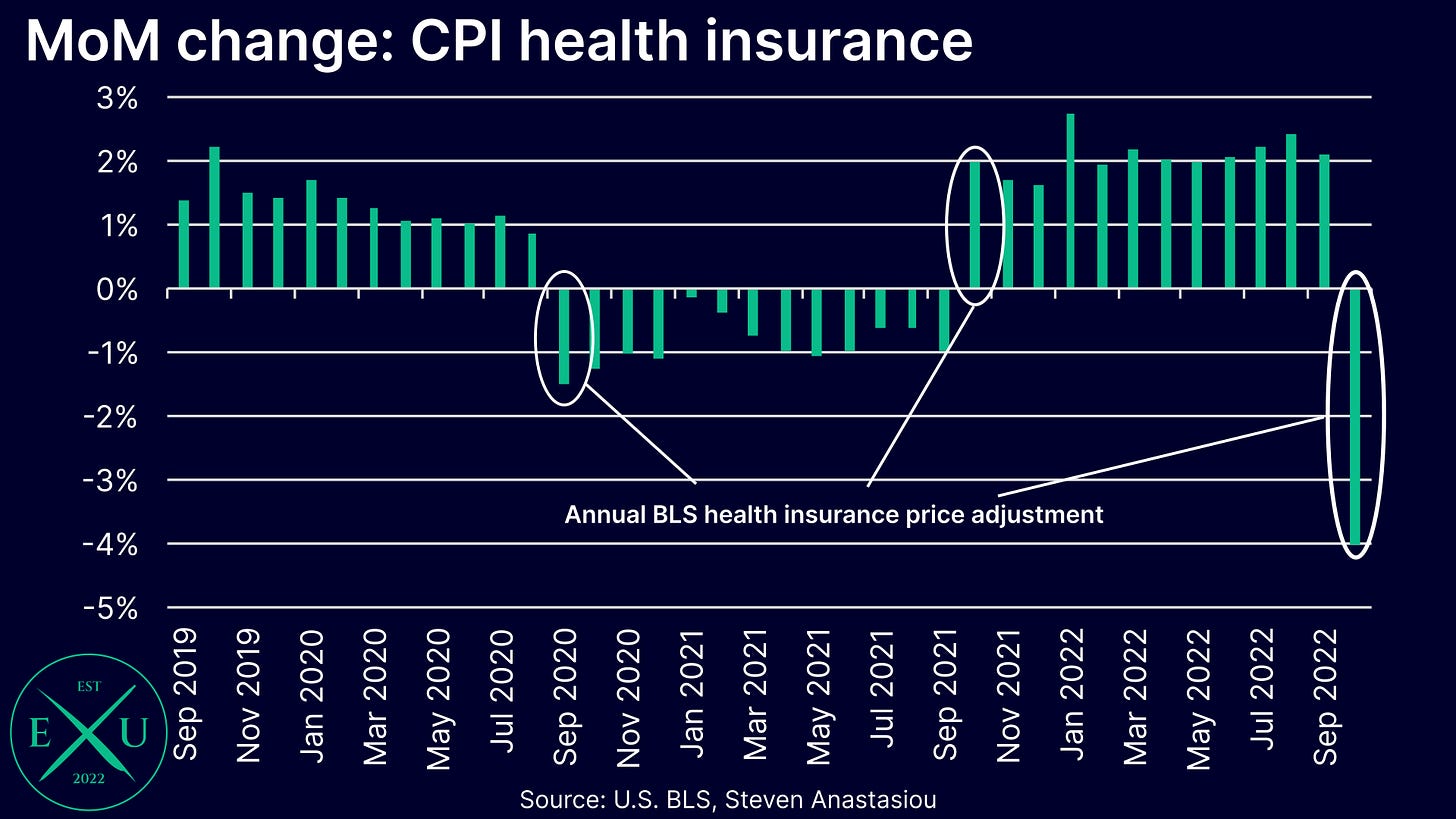
An important contributor to a lower CPI in October was the BLS’ annual revision of health insurance prices. After rising by 28.2% in the 12 months to September 2022 (an average MoM increase of 2.1%), the BLS’ annual health insurance revision in October resulted in a MoM DECLINE of 4.0%.
Given that health insurance prices are updated annually, and then spread out fairly evenly over the following 12 months, a large decline in health insurance prices versus the large increase in the year-ago period, should continue to provide significant downward pressure on the CPI through to September 2023.
The impact of the annual revision over previous years can be seen in the chart below.
7) Expecting MoM CPI growth below the consensus forecast
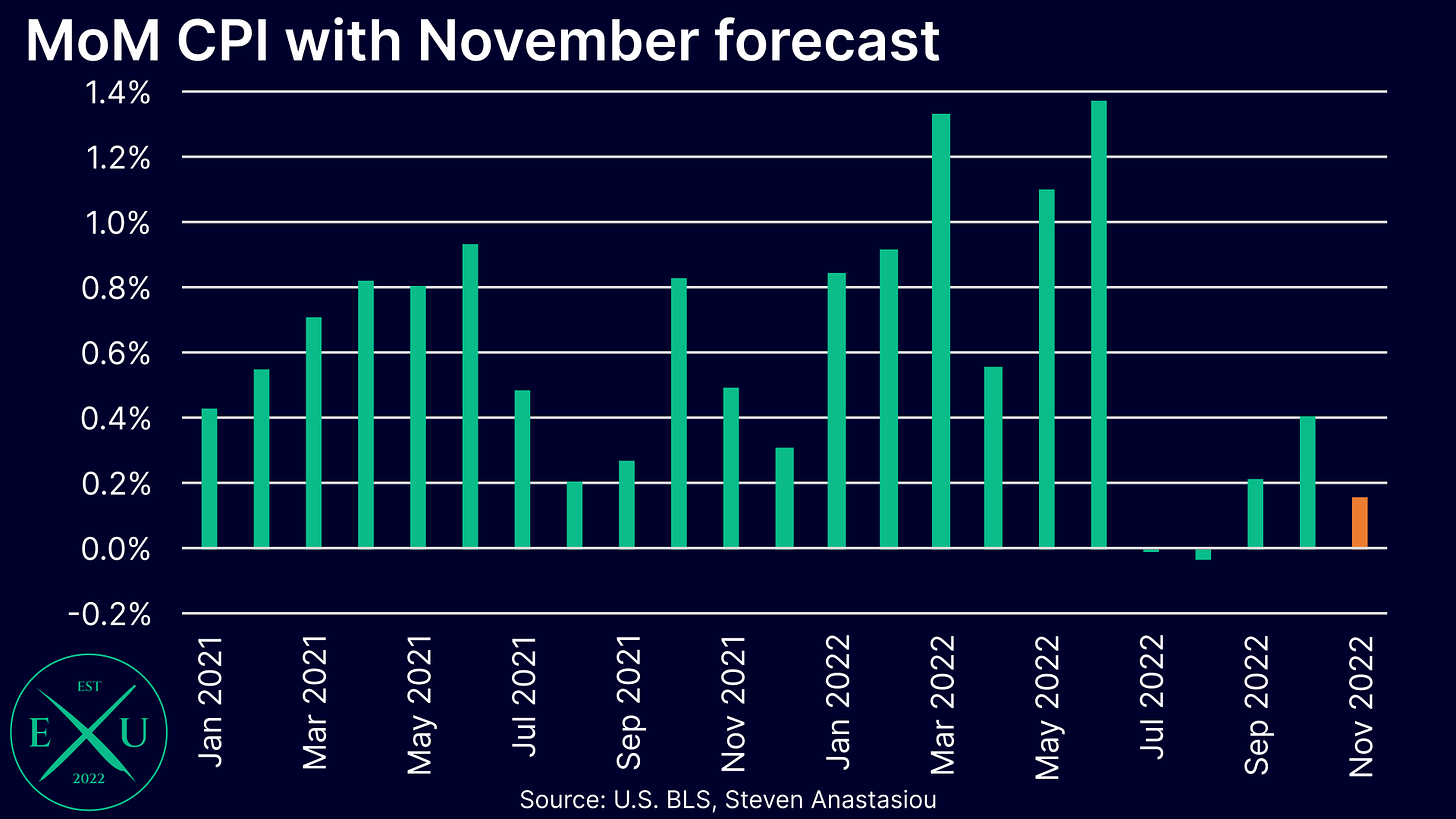
After factoring in each of these important insights, my inflation forecast is pointing to a MoM increase of 0.15% (non-seasonally adjusted). This would represent another month of price growth that is significantly below the high levels recorded earlier in the year, and which would provide further evidence of lower YoY inflation ahead.
For comparisons sake, DailyFX is currently reporting a MoM consensus forecast of 0.3%, whilst the Cleveland Fed’s Inflation Nowcast is at 0.47%.
8) Expecting further moderation in YoY CPI growth
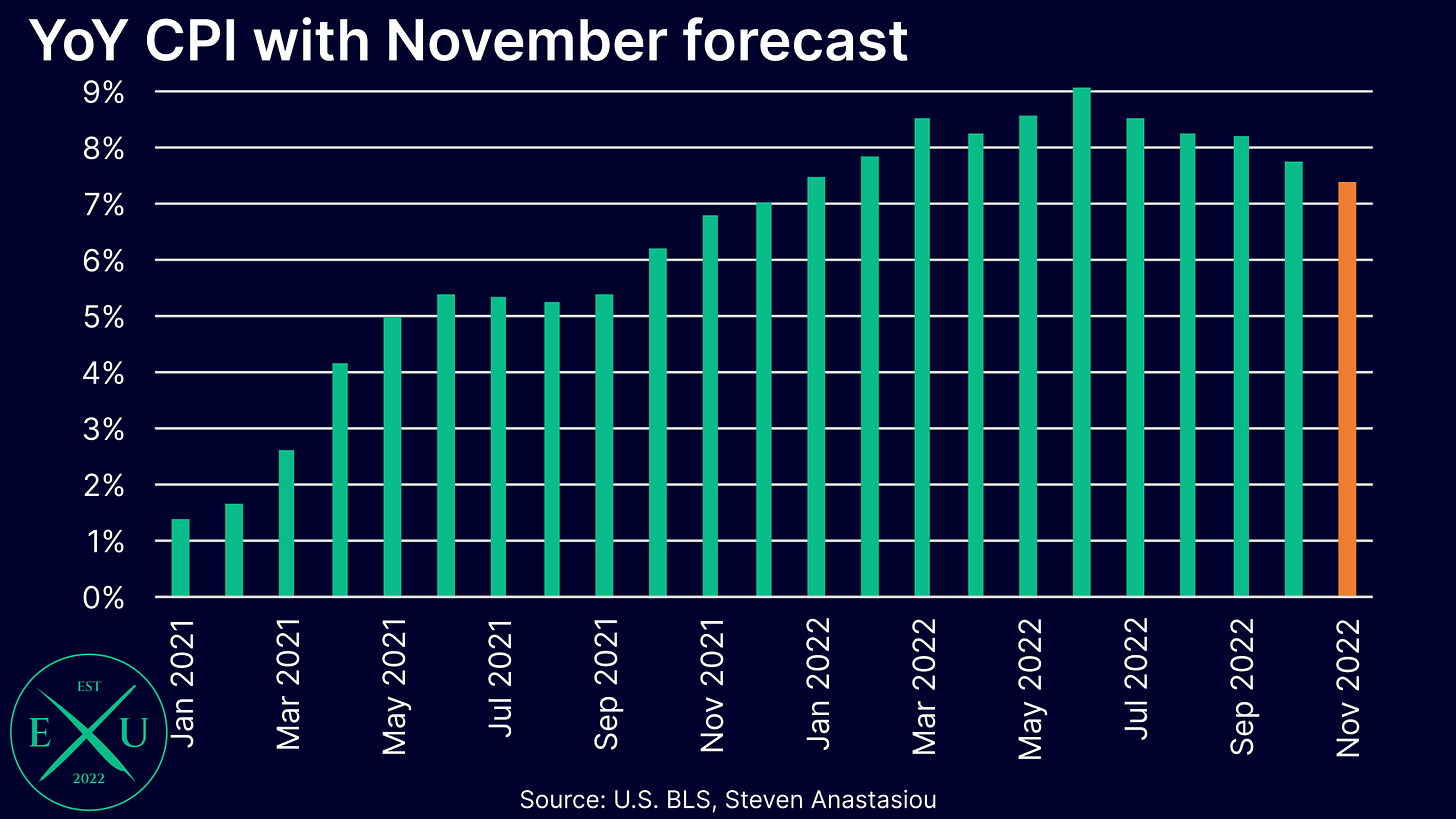
A MoM increase of 0.15% in November would result in the CPI’s YoY growth rate falling from 7.7% to 7.4%. This would mark the 5th straight month of declines in the CPI’s YoY growth rate.
Thank you for continuing to read and support my work — I hope you enjoyed this latest piece.
If you would like to help support my work, please subscribe, and help me spread the word by liking and sharing this article.



Fantastic analysis as always. Also really like the colour choices on your charts.