A roaring economy and a recession, simultaneously: the latest US jobs data is all over the shop
While the consensus appears to be that the latest US jobs data is extremely strong, a thorough analysis reveals major contradictions, with a suite of downright recessionary indicators also seen.
Executive summary
While most market commentators and economists appear to have taken the view that the latest US jobs data paints an extremely strong picture, a deeper look at the data also reveals a suite of indicators that point to outright recessionary conditions.
Key positive points to note, include:
Nonfarm payroll growth was revised far higher in December and remained strong in January (average MoM growth of 343k over the past two months);
Higher nonfarm payroll growth was boosted by private sector hiring, with 3-month moving average growth surging to its highest level since November 2022;
Higher private sector nonfarm payroll growth was supported by a significant increase in the breadth of manufacturing and private industry subcomponents reporting job growth; and
Both the unemployment rate (3.7%) and layoffs, remain historically low.
Key negative points to note, include:
Household employment growth has plunged to just 0.8% YoY (note that this excludes the impact of the January population adjustment, including the adjustment, means that growth fell to just 0.6%);
Given the difficulty that many businesses had in hiring workers during the prior economic upswing, employers appear to be more particularly scaling back their demand for labour via a reduction in hours (as opposed to layoffs). This is evidenced by:
Significant declines in full-time employment (to levels that have historically been indicative of a recession) on a 3- and 6-month moving average basis;
Hours worked plunging to levels last seen during the COVID recession and GFC;
A material increase in the U-6 unemployment rate from its cycle trough; and
Falling manufacturing overtime hours.
While average hourly earnings growth rose significantly MoM, once average weekly hours are taken into consideration, average weekly earnings actually fell in January, with YoY growth falling to its lowest level since May 2021.
In contrast to the drastic increase in private nonfarm payroll growth over the past two months, the private hiring rate (which is measured by a separate survey), remained at 3.9% in December. Outside of the COVID recession, this equals the lowest rate that has been seen since August 2014; and
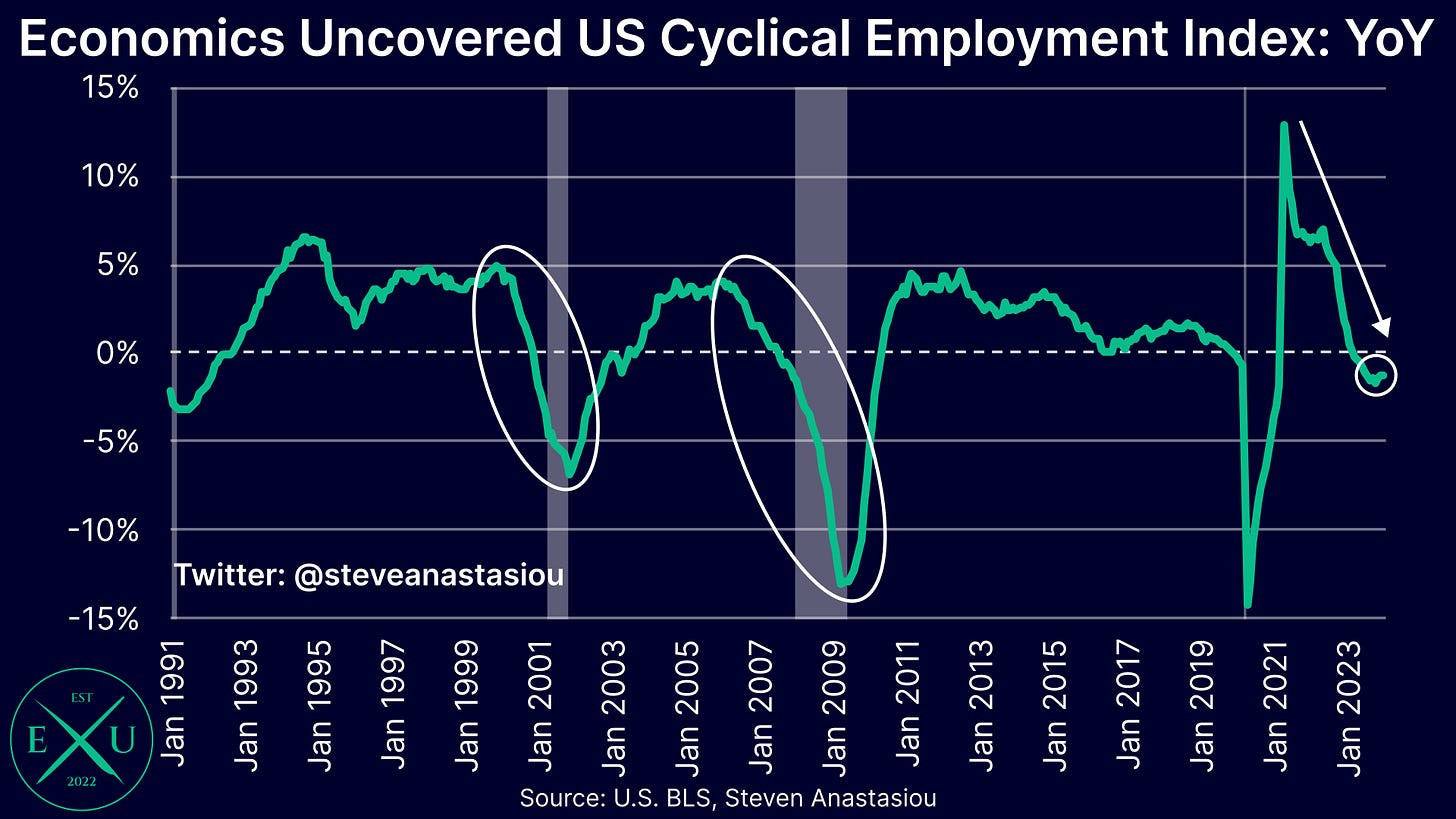
Cyclical employment growth remains YoY negative (although it did turn positive on a 3-month annualised basis).
Taken in totality, a thorough analysis of the latest US employment data reveals that the current state of the labour market is anything but clear, with the US employment market likely to now be at a critical juncture, with a significant weakening or strengthening in the labour market, likely to become much clearer over the next few months — either jobs growth continues to strengthen and the weakening in hours related metrics reverses, or the major weakening in hours related metrics leads to a further reduction in hiring and an increase in layoffs.
An important consideration is that further significant net T-bill issuance is set to be delivered over the next two months. This is likely to provide further material economic stimulus, helping to offset the Fed’s significant tightening. This may act to strengthen the US employment market and the broader economy, over the months ahead. For more detail on this important economic driver, please see my recent research piece on the latest US Treasury refunding announcement.
The latest jobs report reveals a suite of data that paints a picture of a booming employment market
After seeing a consistent downtrend in job growth across 2023, major revisions show that nonfarm payroll growth surged higher in December, and rose higher still in January, with monthly nonfarm payroll growth averaging 343k over the past two months.
This took 3-month moving average growth to 289k, the highest level seen since March.
While 6-month moving average growth rose to 248k (the highest level since June), it remains largely in-line with its recent range.
While private payroll growth slowed significantly in 2H23 (with overall nonfarm payroll growth supported by strong hiring in the public sector), the abrupt increase in job growth over the past two months has been driven by the private sector, where 3-month moving average growth increased to 249k in January, the highest rate of growth seen since November 2022.
While 6-month moving average growth rose to its highest level since June, it remains around levels seen across 2H23.
Importantly, the increase in private sector job growth was driven by a broadening array of manufacturing and private sector industries.
The breadth of industries reporting job growth in the manufacturing sector in December rose to its highest level since October 2022, and the number of private sector industries reporting job growth rose to its highest level since January 2023.
The major strengthening in nonfarm payroll growth over the past two months is supported by an unemployment rate that remained at an historically low 3.7% in January.
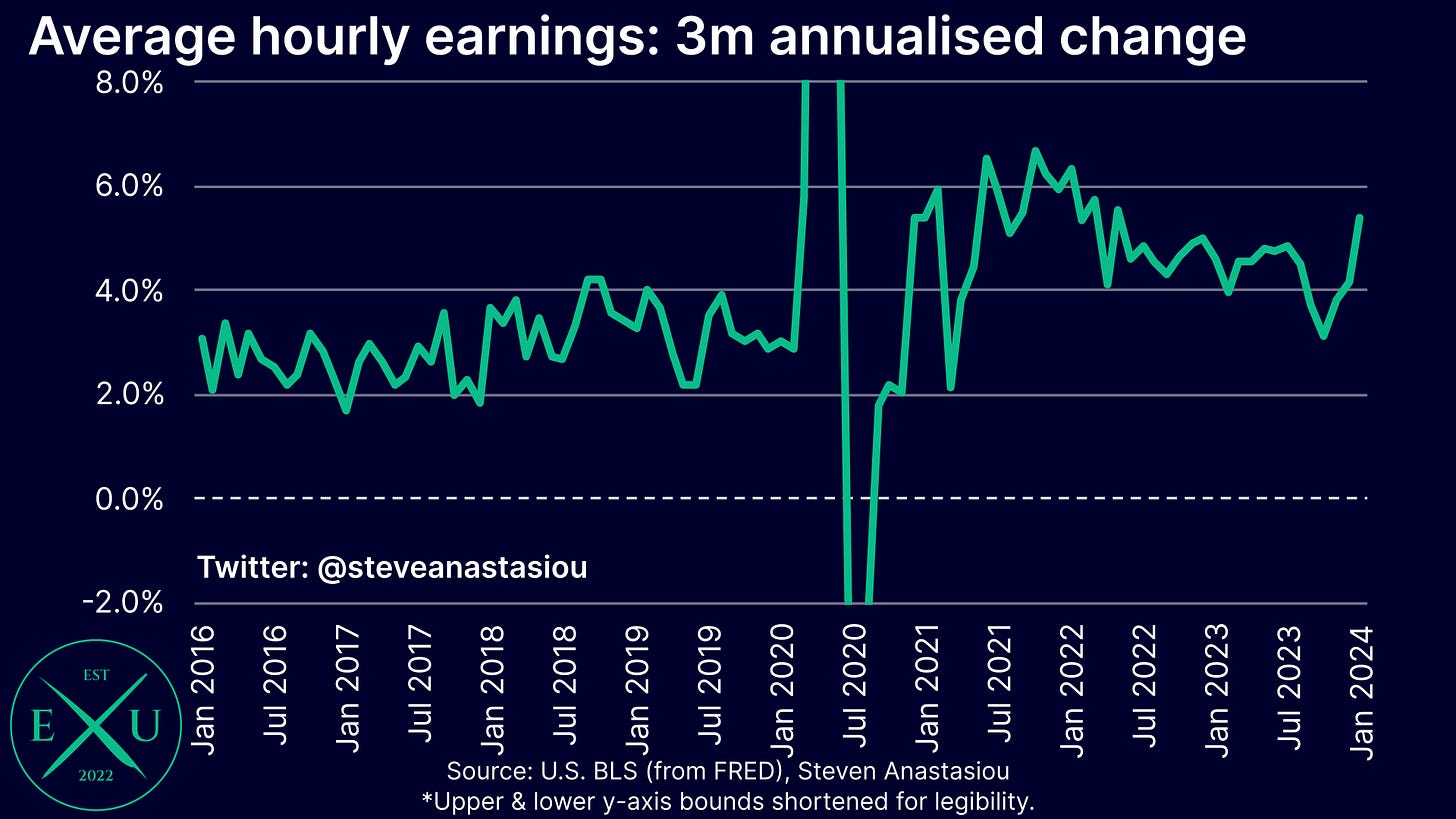
Average hourly earnings growth also accelerated in January, rising by 0.6%, marking the fastest rate of growth since March 2022. This saw the YoY growth rate rise back up to 4.5%, while 3-month annualised growth has surged to 5.4%, the fastest rate of increase since May 2022. Though note that a sharp drop in hours worked may have somewhat distorted average hourly earnings growth in January, with average weekly earnings, which is discussed later, painting a very different picture.
Rounding out the data pointing to a very strong jobs market, are layoff indicators.
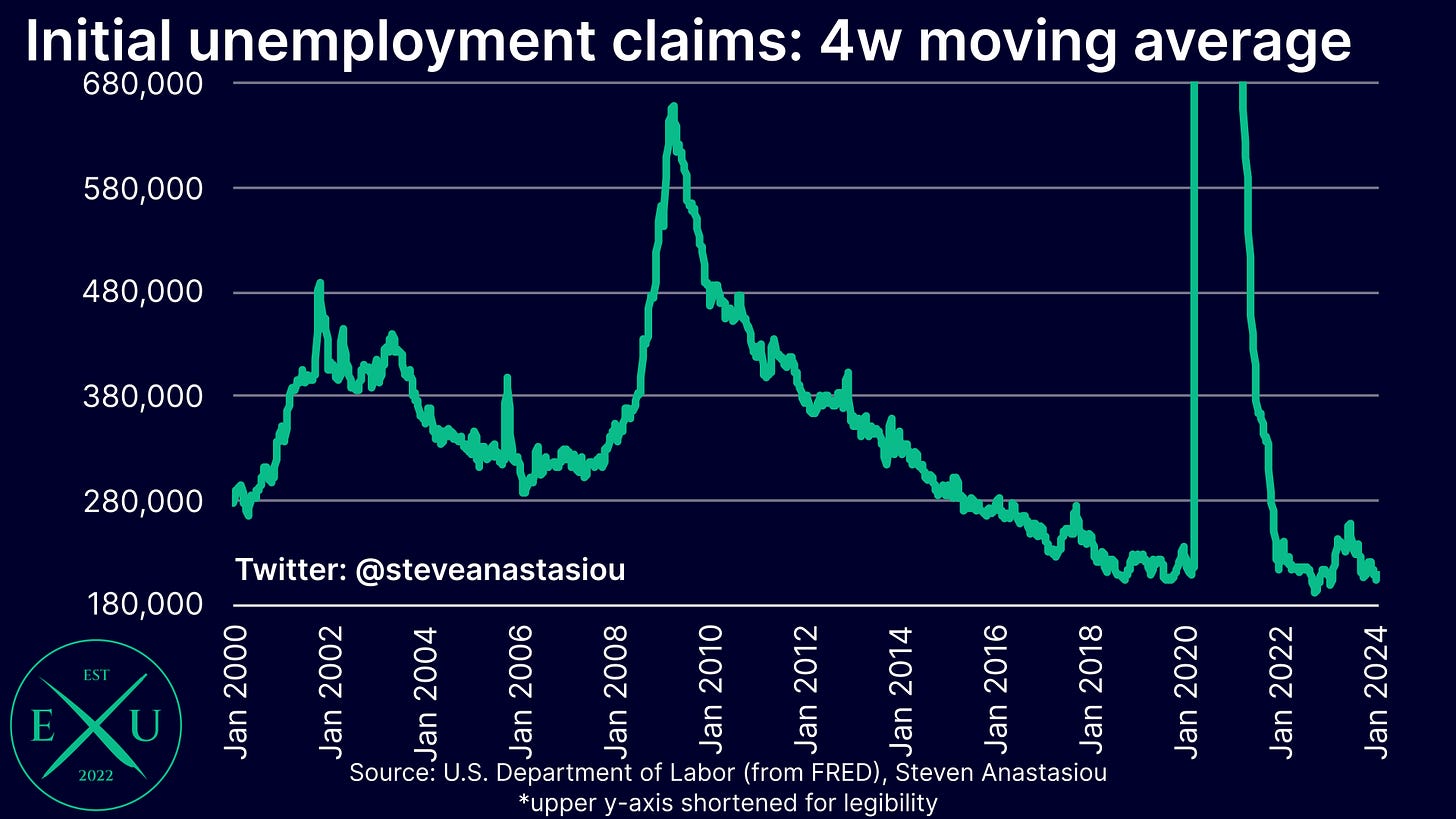
The 4-week moving average of initial claims came in at 208k, which is not that far away from the lowest levels ever recorded for this data series (the lowest ever recorded 4-week moving average of initial claims is 179k).
Meanwhile, the rate of private sector layoffs recorded by the Job Openings and Labor Turnover Survey (JOLTS) remained at 1.1% in December, also near the lowest level on record for this survey.
Putting all of this data together, it’s clear that the US labour market is BOOMING, right? Well, unfortunately, the picture isn’t quite so clear cut.
For just as January’s jobs report provided a whole suite of data that points to a roaring US economy, it also provided a suite of data that paints an outright recessionary picture. Yes, recessionary.
At the same time, the latest jobs data provides a suite of indicators that show conditions are downright recessionary
Let’s start firstly with household survey employment.
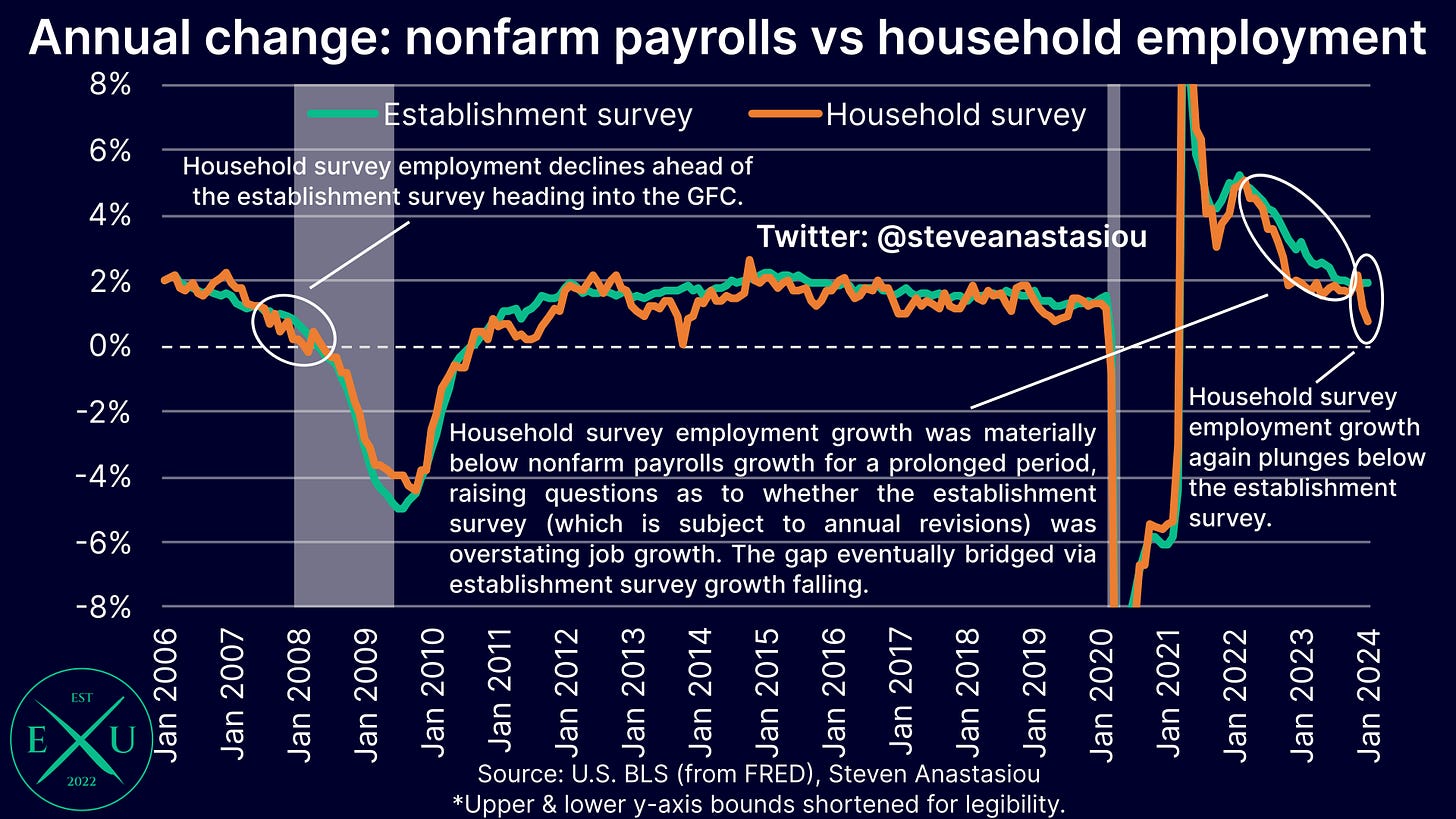
In contrast to the relatively solid annual growth rate of 1.9% that was recorded by the establishment survey of nonfarm payrolls in January, annual growth in household survey employment plunged for a second consecutive month, falling to just 0.6% — this is down from average annual growth of 1.7% in 2023.
Now, you may be thinking that this is due to the latest household survey population adjustment (which occurs every year in the January employment report). While it did have a negative impact, even if this adjustment is excluded, YoY growth still plunged to just 0.8% in January.
Yet again, the household survey is thus showing a major divergence to the establishment survey — when this occurred during much of 2022-23, it was the establishment survey falling towards the growth rate recorded by the household survey, that bridged the gap between the two surveys.
Comparing the absolute change between the household and establishment surveys over the past 3 and 6 months, clearly highlights the major discrepancy that has taken place between the two job surveys.
Breaking the household survey down further, reveals even weaker trends.
After plunging by 1.5m jobs in December, there was no bounce back in full-time job growth in January, with full-time jobs falling by another 63k.
While the ability for the household survey to show a bounce back in January was impacted by the significant negative revision on account of the annual population adjustment (-270k MoM for total household employment), recent trends in full-time employment are nevertheless exceptionally weak.
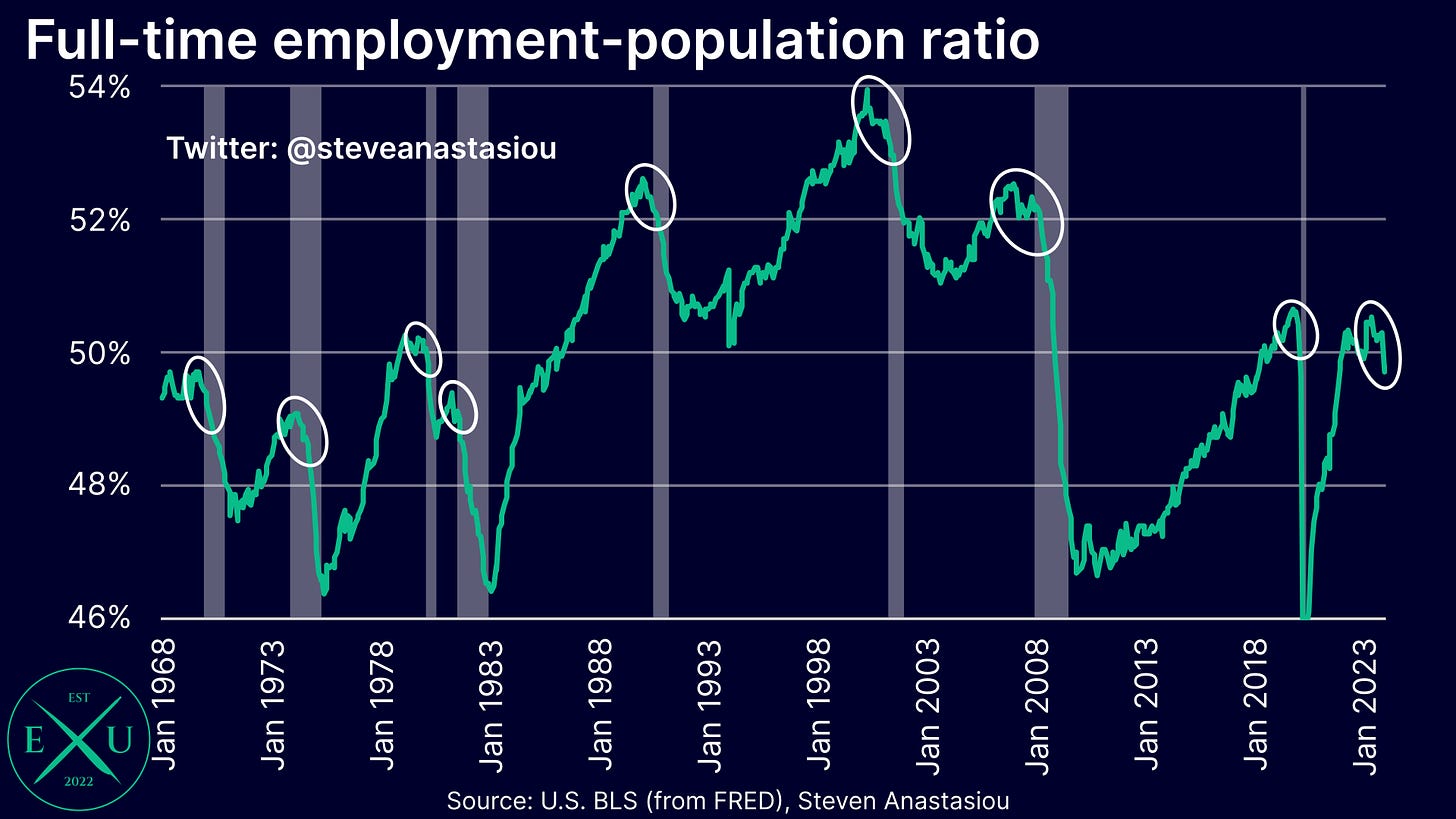
3-month annualised growth fell to -4.0% — only once has growth been this weak without a recession occurring, since 1968.
6-month annualised growth remained materially negative at -1.6% — again, growth has rarely been this negative without a recession occurring.
This has seen the percentage of those in full-time employment drop below 50% of the population — note that a sharp downward pivot from the cycle peak has been a reliable recession indicator dating back to 1968.
On the flipside, there has been a sharp increase in the percentage of the population employed part-time — something that is also often seen during recessions.
This suggests that as opposed to laying off staff, companies are choosing to instead hold onto workers by reducing their hours — given the prior struggles that many businesses had in securing their desired staffing levels during the prior stimulatory driven economic boom, this is likely to make layoffs an even more lagging indicator during the current cycle.
The phenomenon of businesses choosing to scale back their labour demand via a reduction in hours, as opposed to layoffs, is also being seen via the U6 unemployment rate, which captures individuals who are employed part-time for economic reasons (i.e. those who want a full-time job but aren’t able to get one), rising to 7.2% in January.
While this rate remains historically low, it is materially above the cycle trough of 6.5% that was recorded in December 2022.
Further emphasising that weakness in the employment market is showing up through cuts to hours as opposed to layoffs, is that average weekly hours plunged in January, falling to their lowest level since the COVID recession. When was the last time that average weekly hours recorded a value of 34.1 before the COVID recession? During the aftermath of the GFC.
While some are suggesting that the weather led to lower average weekly hours, this data is seasonally adjusted.
Given the significant decline in average weekly hours, this puts a significant dampener on the increase seen in average hourly earnings. Indeed, average weekly earnings actually fell in January.
While average hourly earnings thus saw growth rise above 5% on a 3-month annualised basis, average weekly earnings growth remained below 3%.
This saw annual growth in average weekly earnings drop below 3%, to the lowest level since May 2021.
Pushing back against the rebound seen in payroll manufacturing employment, is that average weekly overtime hours of production and nonsupervisory employees also fell, falling to 3.4 hours. As one may expect, significant declines in manufacturing overtime have historically been associated with recessions.
While the layoff rate remains relatively low, the hiring rate has fallen significantly since late 2021, falling from 5.1% in November, to 3.9% in December. Outside of the COVID recession, this equals the lowest hiring rate that’s been seen since August 2014 — note that at this point in time, the unemployment rate was 6.1%.
While seeing very modest growth in the past two months, the Economics Uncovered Cyclical Employment Index remains YoY negative. Historically, this has been a leading indicator of the employment market and the wider economy.
Though given the slight MoM growth that has been seen during the past two months, 3-month annualised growth turned modestly positive in January (0.2%).
What’s the real state of the US jobs market?
While most market commentators and economic analysts appear to have taken the view that the latest US jobs data was extremely strong, in my view, the current state of the US labour market is anything but clear.
If one is seeking to paint a strong picture of the US economy, there’s a myriad of data points that one can list to show that the US jobs market remains strong and has strengthened over the past two months.
If one is seeking to paint a weak picture of the US economy, including that it is perhaps even already in a recession, there’s also a myriad of employment market data that one can point to, to support such claims.
Instead of analysing the data with a subjective lens, I attempt to provide a thorough and objective analysis.
For some time now, this has led me to state that the US employment market continues to gradually weaken, but remains relatively robust. Though with signs of additional weakness in December, I then noted that a more material weakening in the US jobs market was now being seen.
With the latest jobs data showing a resurgence in private nonfarm payroll growth (including major upward revisions to December’s nonfarm payroll growth), but at the same time providing strengthened signs of hours related weakness, I don’t believe that it can now be categorically said that the US jobs market is either strengthening, or weakening materially — the latest data is simply too all over the shop.
Ultimately, the US employment market now appears to be at a critical juncture, with a significant weakening or strengthening, likely to become much clearer over the next few months — either job growth continues to strengthen and the weakening in household survey employment and hours related metrics reverses, or the major weakening in hours related metrics eventually leads to a further reduction in hiring, and an increase in layoffs.
One important point to note, is that the huge net T-bill issuance and associated drain in the Fed’s RRP facility, is providing a major stimulatory offset to the Fed’s tightening — this can be seen via the stabilisation in bank deposits and the M2 money supply since May, and the material MoM increase in M2 in December. While this stimulatory offset is set to somewhat reverse in 2Q24, this does not come before major net T-bill issuance is due to be delivered in February and March (~$300-$350bn). The major stimulatory impulse already delivered via enormous net T-bill issuance, plus that which is upcoming, may act to strengthen the US employment market and the broader economy, over the months ahead. To understand these dynamics in full, please see my recent research piece on the latest US Treasury quarterly refunding announcement.
Now much more so than usual, it’s important to dive into the details to try and ascertain which direction the jobs market is headed — I intend to keep you up-to-date on all that you need to know, right here, at Economics Uncovered.
Incase you missed it …
Over the past week I have published two other important research reports.
Firstly, I published my Quarterly US Inflation Update, a 34-page report which includes updates to my medium-term US CPI forecasts, and an analysis and extrapolation of the latest PCE inflation data.
Quarterly US Inflation Update
Secondly, I published a piece on the latest US Treasury refunding announcement. The report provides an in-depth explanation of how net T-bill issuance interacts with the Fed’s RRP facility to impact the economy, and then delves into the market impact of changes in coupon issuance. In addition to analysing the announced funding recommendations for Q2, the report also provides estimates for net T-bill issuance across the remainder of 2024.
Thank you for reading my latest research piece — I hope that it provided you with significant value.
Should you have any questions, please feel free to leave them in the comments below.
In order to help support my independent economics research, please consider liking and sharing this post and spreading the word about Economics Uncovered — your support is greatly appreciated!
If you haven’t already subscribed to Economics Uncovered, subscribe below so that you don’t miss an update.










Thank you for this very balanced evaluation.
YOU: "reveals major contradictions, ..." Well. There are usually contradictions in economics. ME: silverman.substack.com