February US CPI review: YoY CPI meets the consensus forecast, but rate hike expectations rise
Inflation comes in-line with consensus expectations, but another hot MoM number sees market expectations for Fed rate hikes rise.
The US CPI report for February met consensus forecasts, and was largely in-line with my forecast.
Headline CPI came in at 6.0% YoY (vs my forecast of 6.0%, and a consensus forecast of 6.0%), while core CPI came in at 5.5% (vs my forecast of 5.4%, and a consensus forecast of 5.5%).
YoY CPI ex-shelter of 5.0% was in-line with my forecast, while core CPI ex-shelter came in at 3.7%, slightly above my forecast of 3.6%.
Across all four of these metrics, the YoY rate of growth decelerated versus the prior month.
A look behind the headline numbers
In terms of some of the specific items, my CPI forecast was correct to assume a somewhat more conservative used car price forecast than what was suggested by a simple two-month lag of the Manheim Used Vehicle Value Index, but the price change came in slightly less negative still, at -1.4%, vs my -1.6% forecast and the -1.9% that the Manheim Index recorded two months prior.
As opposed to a further deceleration, CPI food at home prices actually recorded a reacceleration in MoM price growth versus their historical monthly average in February. This marked the first month of acceleration versus its historical 2010-19 monthly average, since July 2022.
Nevertheless, one month isn’t a trend, and it’s not unusual for MoM movements to bounce around. A bigger picture view continues to highlight a disinflationary trend.
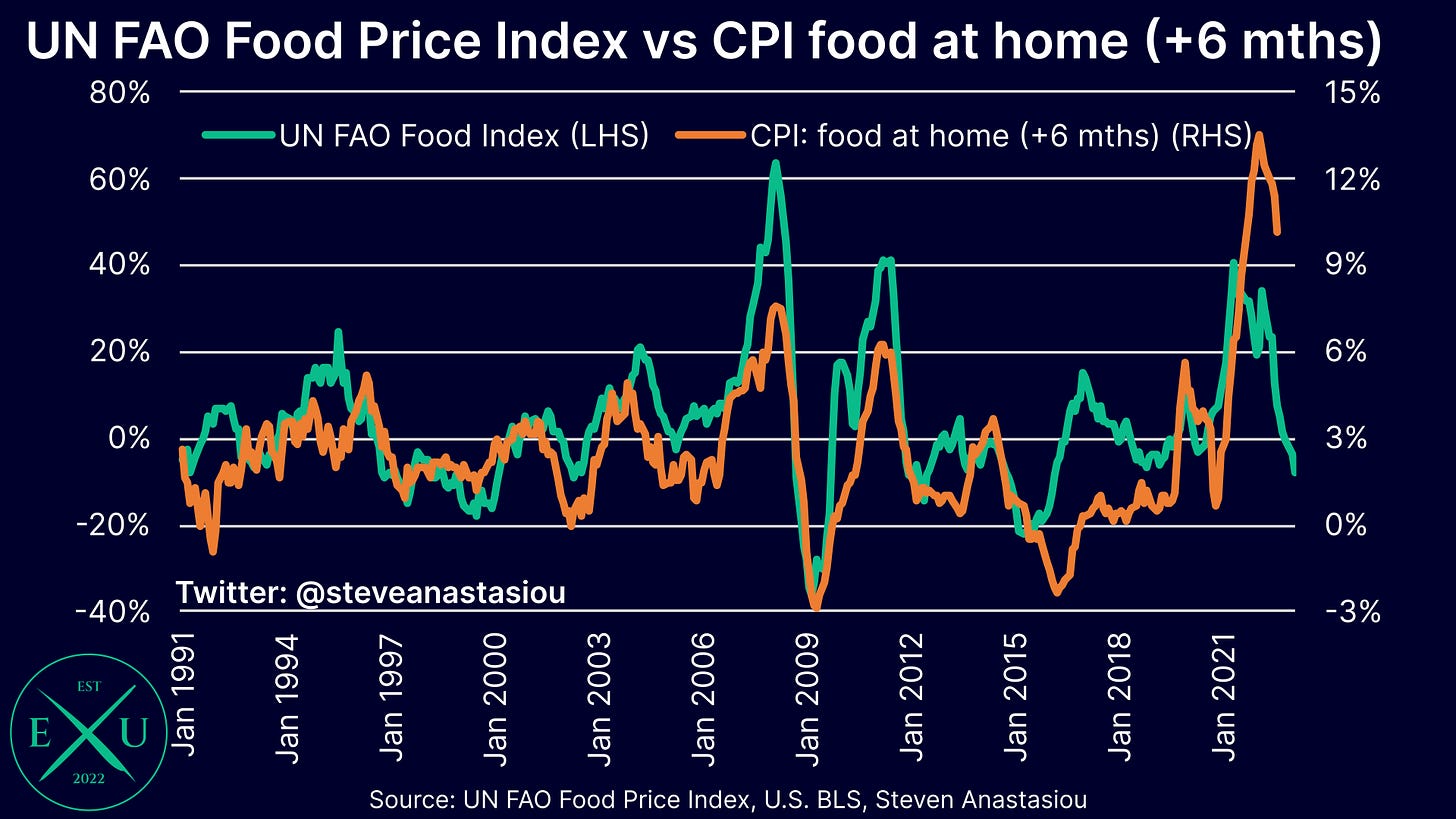
As higher prior year comparables are cycled, and with the leading UN FAO Food Price Index pointing to further YoY moderation, I continue to expect that CPI food at home prices will see significant YoY disinflation over the year ahead.
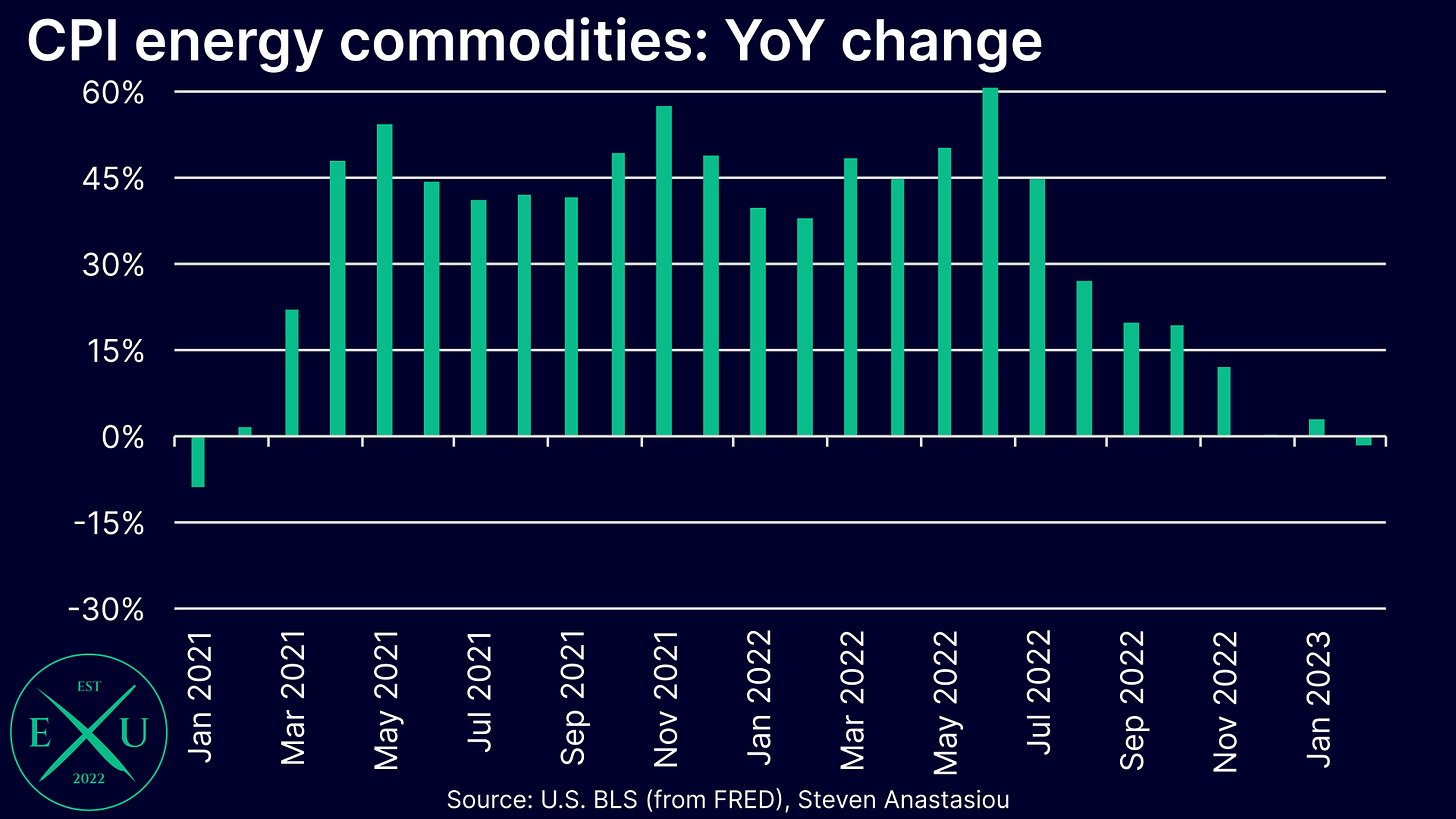
As expected, the CPI’s energy commodities index turned YoY negative in February.
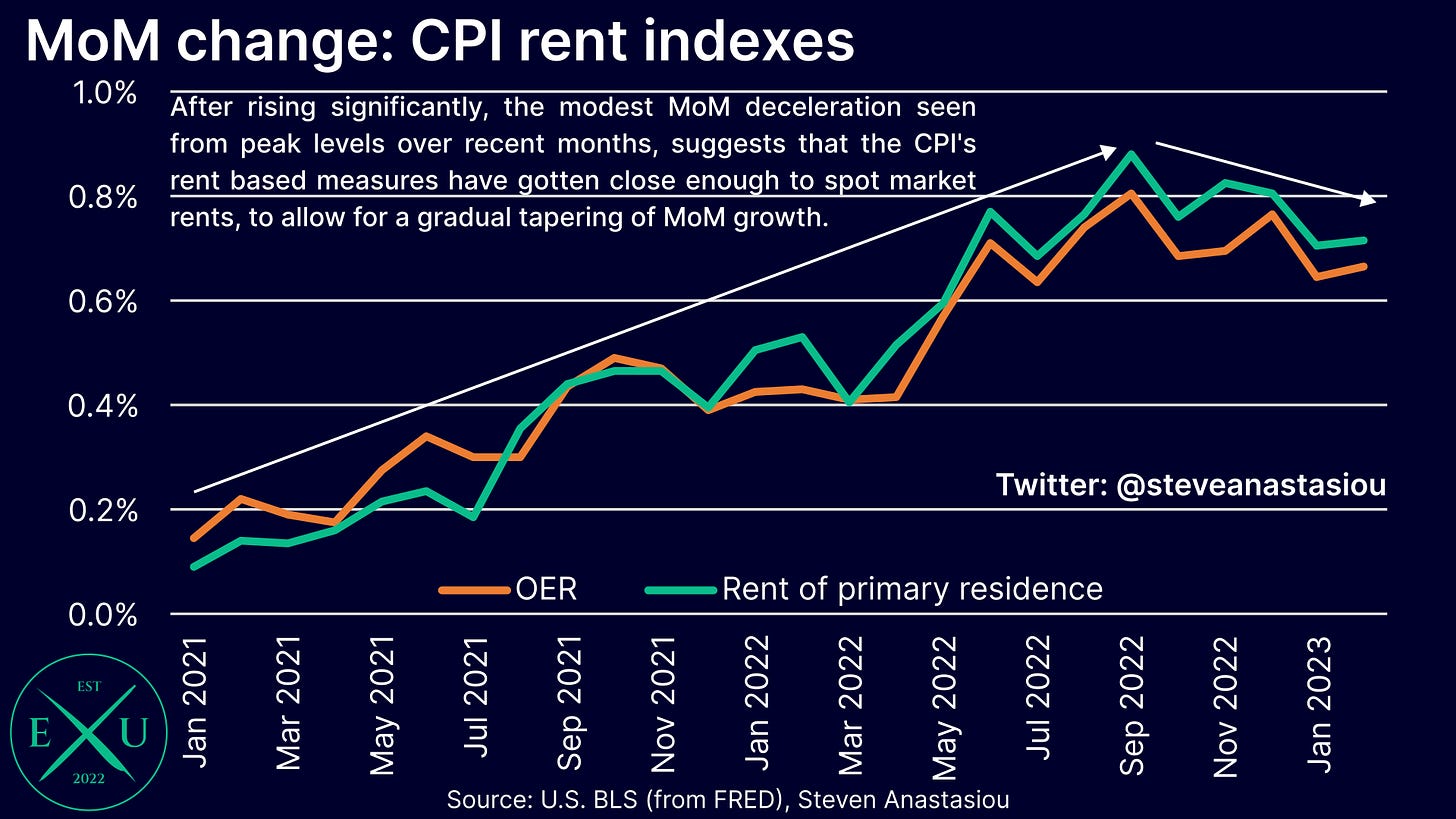
After showing some signs of deceleration in January, the key shelter components of owners’ equivalent rent and rent of primary residence saw a slightly larger MoM increase in February. Given that these items are not only heavily lagged versus spot market rents, but are smoothed, this outcome didn’t materially differ from my forecast, whereby I assume a slow, gradual tapering of MoM growth over time. Though standard MoM volatility (which can be seen in the jagged movements in the chart below) will mean that in practice, this gradual tapering is likely to be somewhat bumpy.
After highlighting in my CPI preview that inflation had spread to internet services prices in 4Q22 (an item that had historically seen little inflation), my expectation for another month of hot growth in February was realised.
Relatively hot MoM data and core services prices, sees the market raise its rate hike expectations
As noted at the beginning of this report, in aggregate, the actual CPI data was largely in-line with my forecast and consensus estimates.
Despite my estimate being largely in-line with the consensus forecast, given that it would entail another round of relatively hot MoM data, I noted in my CPI preview that this risked further unnerving markets.
Why? Markets had significantly reduced their expectations for future Fed tightening on account of recent bank collapses. Another month of hotter MoM data risked markets getting concerned about the outlook for inflation, and whether the Fed would employ significantly more tightening.
In terms of the actual data, we can see that the MoM rate of headline inflation in February was again higher than its historical average, but less so than in January.
For the core CPI, MoM growth accelerated in February, and was again significantly above its historical average MoM movement.
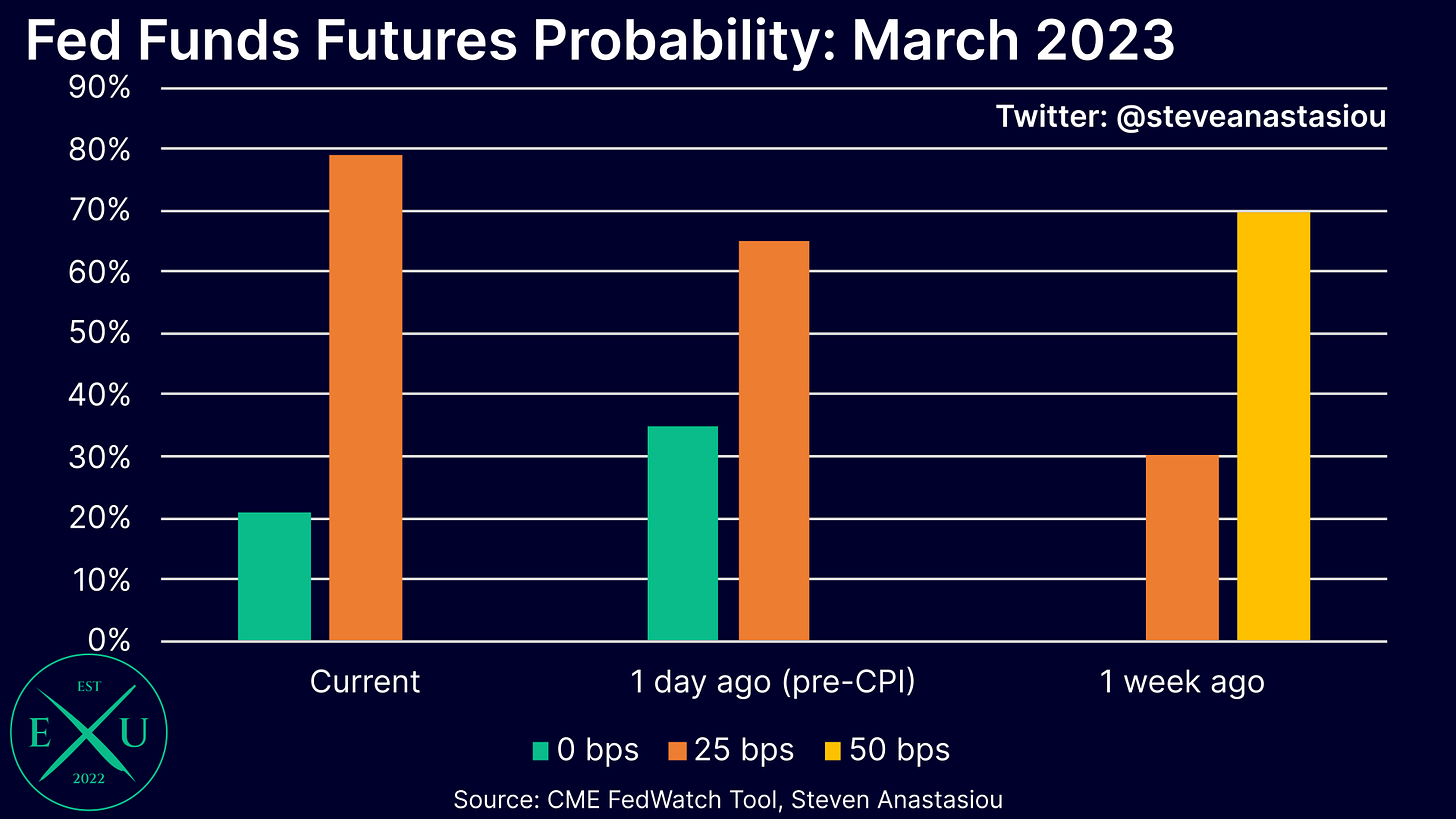
While US stock indices rose on Tuesday, the market did increase its expectations for Fed hikes on the back of the latest inflation data.
At the time of writing, the odds of a 25 basis point rate hike in March, have increased to 81%, up from 65% a day earlier. This comes after markets had earlier aggressively increased their rate hike expectations on the back of data released in January, anticipating a 70% chance of a 50 basis point move just one week ago.
The repricing of the Fed’s tightening outlook has also led to changes in bond prices. After yields plunged on the back of bank failures, yields have reversed some of the decline following the latest CPI report. Shown below, is the change in the 1-year Treasury yield.
While stock markets thus saw a relief rally as regional bank share prices rebounded from steep declines, the increased volatility in bond markets, in part reflecting increased market uncertainty as to the Fed’s future direction, risks further market fallout in the event that the Fed surprises market participants at its upcoming meeting, with relatively more hawkish guidance than what the market is currently pricing.
In addition to the relatively hot overall MoM CPI data, one reason that the Fed may deliver a hawkish surprise, is on account of its “supercore” services inflation focus, being core services prices ex-shelter. This category remained elevated in February.
If you exclude health insurance, which is lumpy, technical and measured indirectly in the CPI, the core services ex-shelter picture would look even more concerning to the Fed.
With Powell highlighting his focus on the core services ex-shelter component of the CPI/PCE, ongoing high growth in this measure would appear to be at odds with the significant scaling back of tightening expectations that the market has recently implemented. Of course, it remains to be seen how the Fed’s approach may or may not change in light of the recent developments in the banking sector.
Why I continue to believe that more tightening would be a mistake
In terms of my view, as highlighted in my CPI preview, I continue to believe that additional tightening would be a mistake.
One reason I gave for this, was the significant impact that lagging shelter costs are having on the CPI, and which given the movement in spot market rents, we know will turn lower over time. As I had forecast, both CPI and core CPI ex-shelter saw another significant deceleration in the YoY growth rate in February. Given that this provides a better picture of the underlying inflation movement, we can see that the level of disinflation to date, has been major.
I disagree significantly with the Fed’s approach to focusing on services prices, and believe that a wider view of price growth is the better approach. On that basis, CPI inflation has disinflated significantly.
An understanding of the importance of the M2 money supply, and the manner in which price cycles operate, further highlights why the Fed’s heavy focus on services prices is a bad approach.
The primary driver of inflation is growth in the money supply. The post-COVID surge in the M2 money supply (which saw the largest annual increase in M2 since WWII), is why the US has seen high inflation.
The reason for this is simple. An increase in the money supply, increases the amount of money that exists in relation to a given good or service, which results in prices being bid up.
Though given that it takes time for changes in the money supply to flow throughout the economy, there is a lag between an increase in the money supply and price changes.
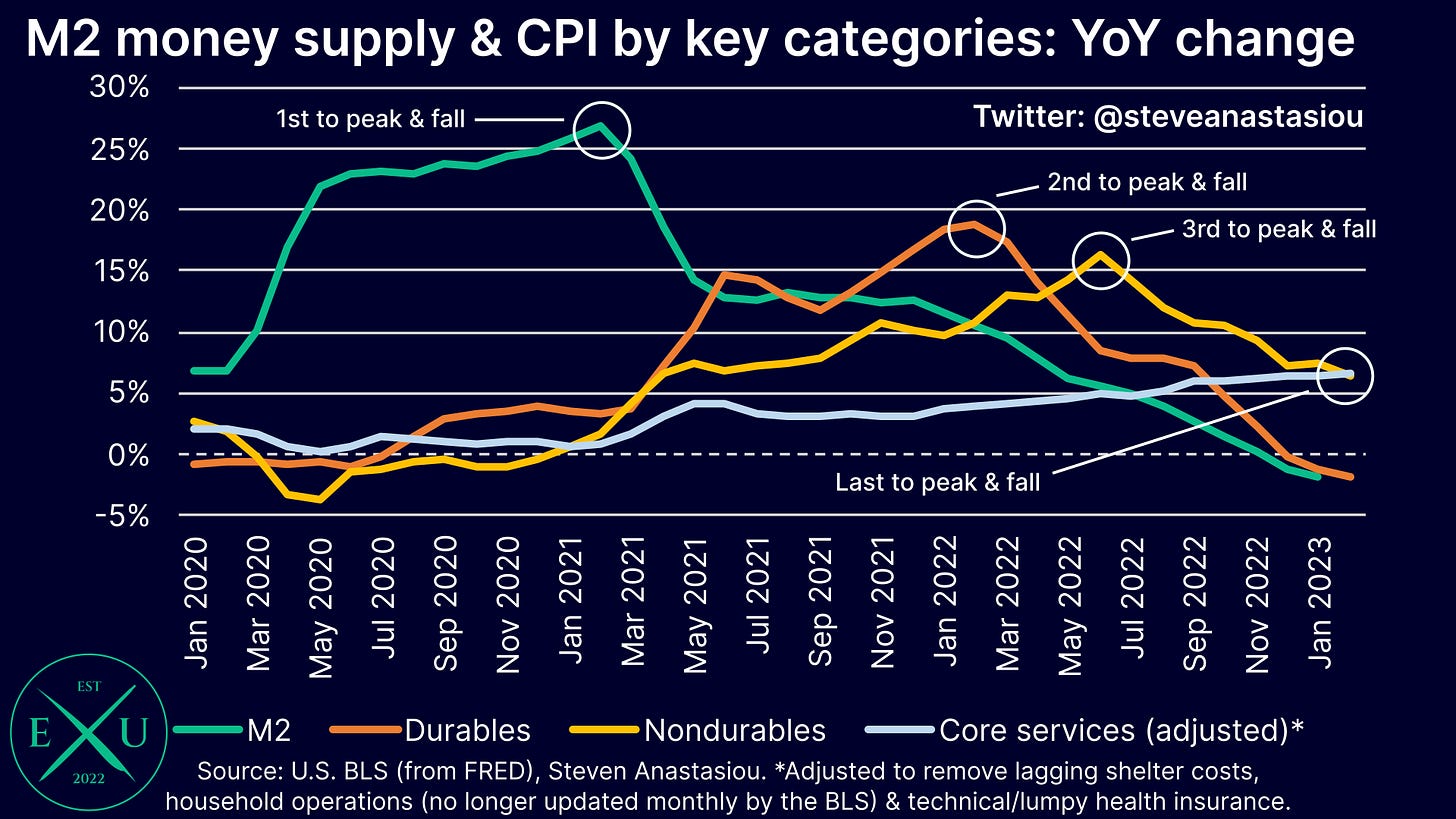
In terms of how the price cycle has played out during the current high inflation cycle, I wrote the following in my February CPI preview:
With COVID and associated restrictions keeping people at home while the government was handing out stimulus checks, the first area to see a significant increase in demand was durable goods, as people spent up on items like electronics and home appliances.
As movement increased, economic activity normalised, and inventories needed to be replenished, nondurables like gasoline, then saw their prices rise.
Services prices are typically the most lagging. The impact of COVID, which delayed an increase in demand for services from an expanding money supply, further reinforced the lag. While they were the last area to see price growth, services prices have been, and continue to, rise.
As a result, the increase in the money supply has now largely flowed through all areas of the economy.
Though the key thing to note is that with the M2 money supply now recording YoY declines, not only has the price growth from the prior expansion of the M2 money supply largely filtered through the economy, but the disinflationary phase, has now been underway for many months, and continues.
Durable goods prices have turned YoY negative and nondurables prices have disinflated significantly. With gasoline prices likely to turn YoY negative, and food at home prices likely to keep decelerating, nondurables should disinflate further over the months ahead.
The main driver of MoM price growth is thus LAGGING services prices, which as opposed to indicating that higher inflation is on the way, are simply accounting for the PRIOR change in the money supply, durables, and nondurables prices.
As opposed to more tightening being needed to fight inflation, a declining money supply says that lower inflation will occur over time — all that is required, is patience.
If we look at the latest data, we can see that on a YoY basis, durables prices continued to remain negative in February. Meanwhile, nondurables prices did decelerate further. LAGGING services prices remain the key component that is yet to decelerate, but tightening based on a LAGGING indicator is nonsensical. Instead, the focus should be on LEADING indicators. The most important of which, is the M2 money supply.
While we don’t know how the Fed will adapt its policy stance in light of recent bank failures and a reduction in the aggressive tightening expectations that the market had priced in following January’s data releases, given that services prices could continue to rise at a brisk rate for many months to come, if the Fed continues to heavily focus its attention on core services prices, it could also continue to raise rates for many months to come.
With M2 already falling, this risks additional MAJOR overtightening and greatly enhances the odds of a deflationary bust occurring down the line. On this point, one needs to remember that an inflationary, credit driven monetary system, encourages leverage. In order to support continued artificial growth, the money supply needs to grow and drive inflation, while interest rates need to fall over time so as to reduce interest rate burdens. Given that this recipe has been followed for decades, the amount of leverage that now exists within the system is significant.
By flipping the script, the Fed is encouraging deleveraging and a reversal of the artificial inflationary driven growth that has accumulated over decades. This isn’t the first time in history that the Fed has aggressively tightened, leading to a decline in the M2 money supply. We can thus look back at history, to see how the economy handled a declining M2 money supply.
History gives a clear answer as to what happens when an inflationary, debt driven system, meets a falling money supply: depressions and panics (see the Long Depression (1873-79), The Panic of 1893, the Panic of 1896, the Panic of 1907, the Depression of 1920-21, and the Great Depression (1929-39)).
By ignoring the lessons of history, the US economy faces a very dangerous period ahead.
Thank you for reading!
Thank you for continuing to read and support my work — I hope you enjoyed this latest piece.
In order to help support my independent economics research, which aims to democratise access to institutional grade insights & analysis (as opposed to it being the exclusive domain of hedge funds & asset managers), please like and share this latest research piece.
If you haven’t already subscribed to Economics Uncovered, subscribe below so that you don’t miss an update.


