February CPI preview: expecting additional YoY deceleration, but the MoM number risks further unnerving markets
While bank failures continue to garner the lion’s share of headlines, the next US CPI report is around the corner.
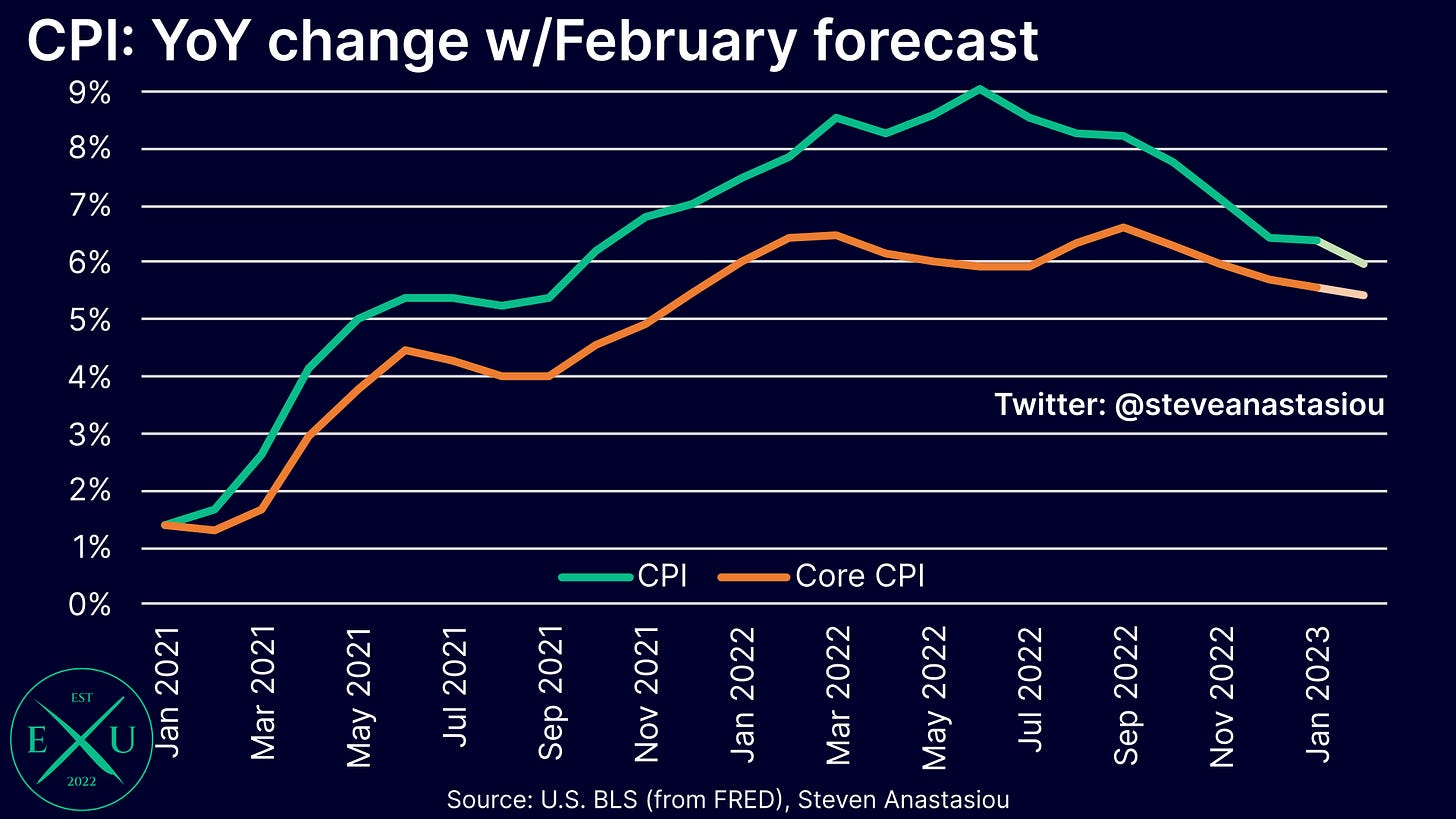
For the seventh straight month, I expect the headline CPI to record further deceleration in its YoY growth rate, falling to 6.0% (from 6.4% in January). This is in-line with the consensus forecast, which is also at 6.0%.
Moving to the core CPI, I also expect its YoY rate to fall, hitting 5.4% (from 5.6% in January). This would make the fifth consecutive monthly moderation in its YoY growth rate, and is slightly below the consensus forecast of 5.5%.
While moderating YoY CPI growth rates will generate some positive headlines, the potential for another month of somewhat elevated MoM growth, risks another market overreaction to inflation concerns — which is likely to be particularly problematic given recent US bank failures, and the subsequent move by market participants to slash their expectations for future Fed tightening.
Let’s dig into the details.
Wholesale used car prices were up, but retail prices lag: expecting a modest MoM fall in durables prices
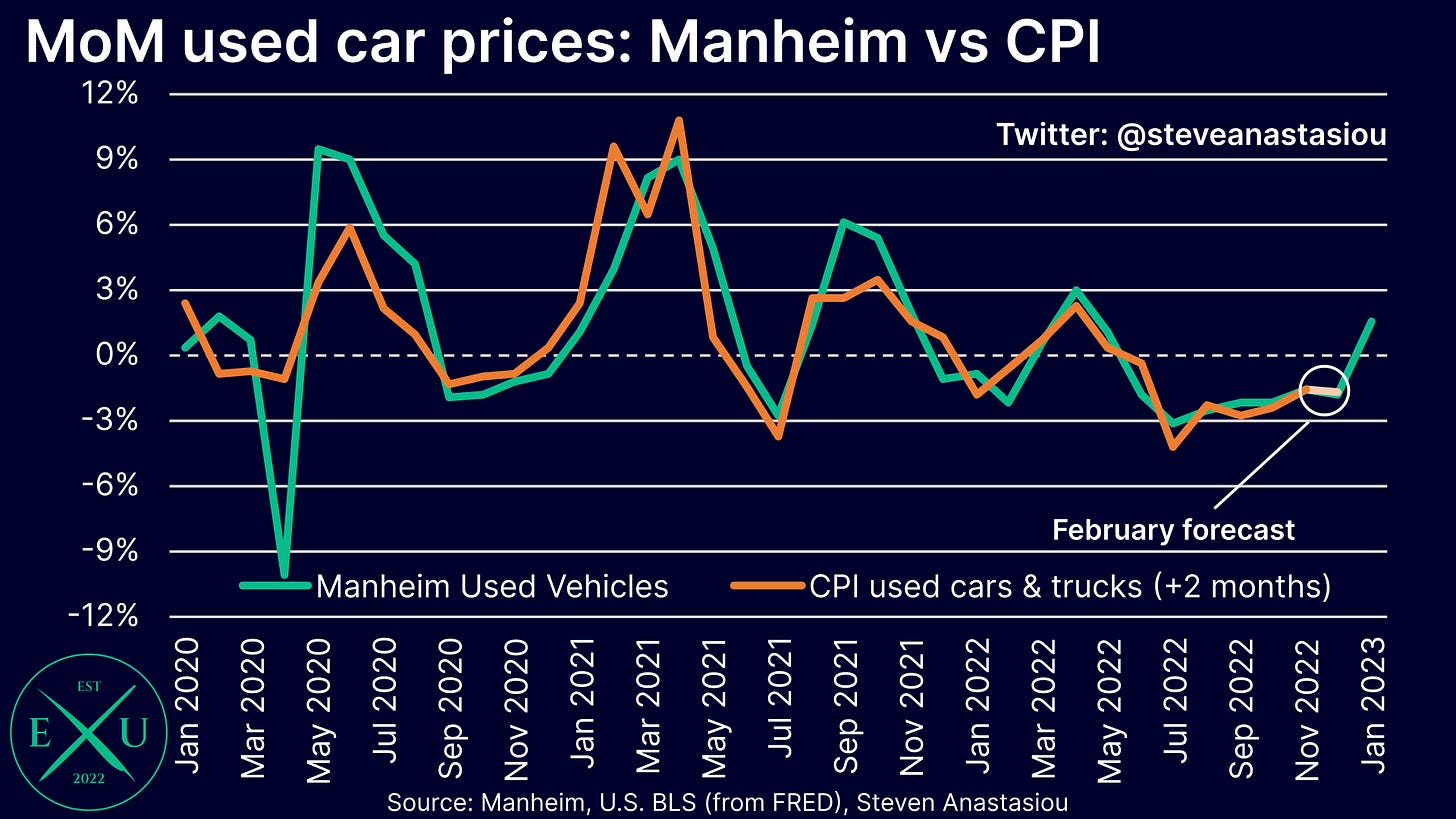
While many have noted the increase in the Manheim Used Vehicle Value Index, it’s important to remember that the Manheim Index tracks wholesale used vehicle prices. The CPI instead measures retail used car prices, which typically lag the Manheim Index by two months.
In order to avoid seasonal adjustment distortions between the Manheim and BLS measurements, I focus on the non-seasonally adjusted data. On that basis, the Manheim Index only began to rise in January. Given the typical two month lag, higher CPI used car prices thus wouldn’t be expected to be seen until March. Meanwhile, January’s CPI used car price change was bang in-line with the change in the Manheim Index from November (two months prior).
While there is a two month lag before the bulk of the wholesale impact is reflected in the CPI, given the higher prices that the Manheim Index has recorded in recent months, I am adopting a moderately more conservative forecast, with a slightly smaller decline in the CPI used car price index for February, versus what a 2-month lag of the Manheim Index would suggest (-1.6% vs -1.9% for the Manheim Index in December). I anticipate that this decline will drive a modest MoM decline in CPI durables prices in February (-0.1%).
UN FAO Food Price Index declines for 11th consecutive month: expect further moderation in CPI food at home prices
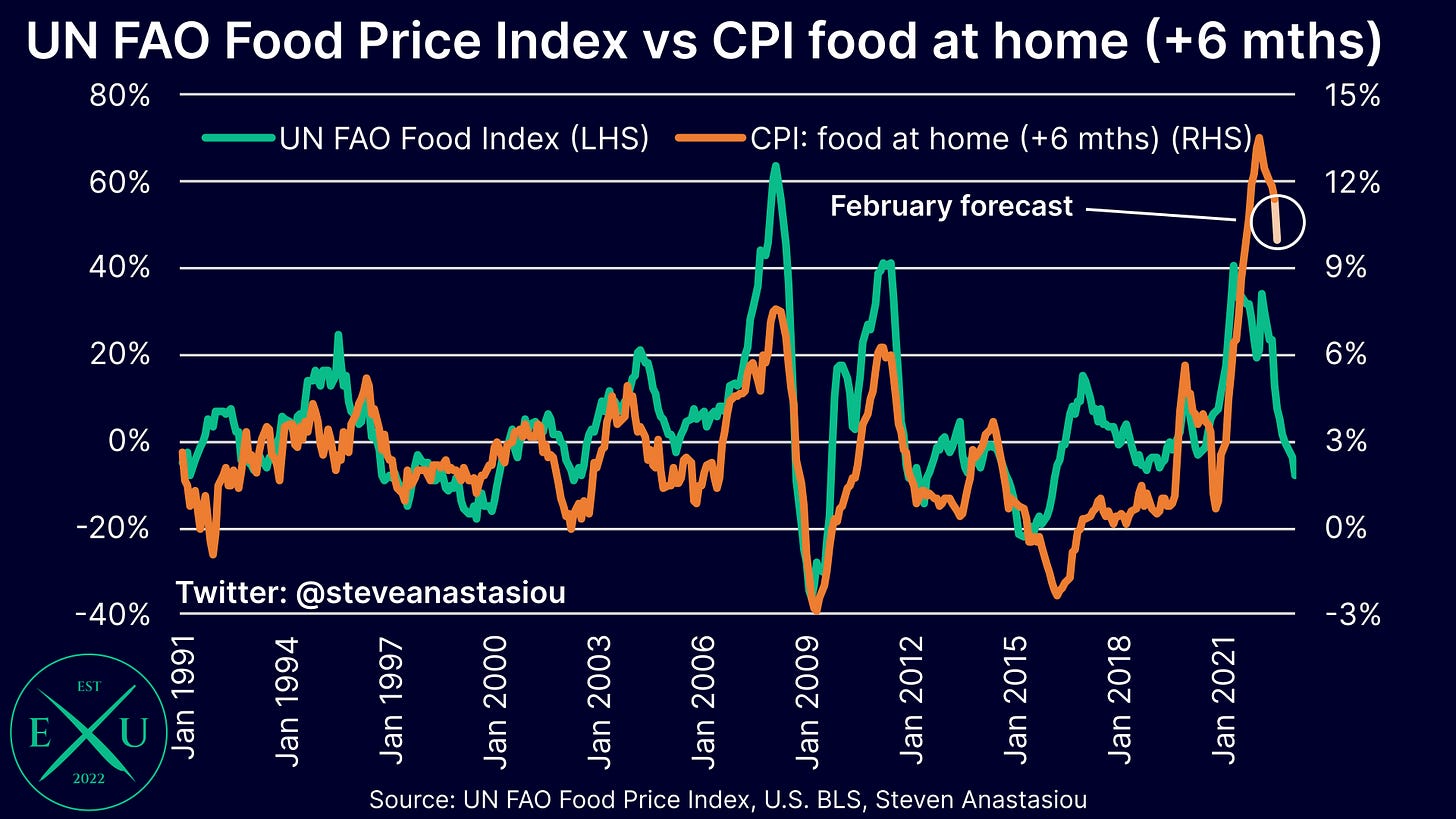
In what has become a familiar point in my CPI previews, the UN FAO Food Price Index recorded another MoM decline in February — its 11th consecutive. This has taken its YoY movement to -8.1%.
Remember, the UN FAO Food Price Index, and the CPI’s food at home index, share a strong directional correlation on a 6-month lagged basis. Given such a correlation, it’s not surprising that the YoY rate of CPI food at home price growth, peaked back in August 2022 (on this occasion, 5 months after the UN FAO Food Price Index saw a YoY peak).
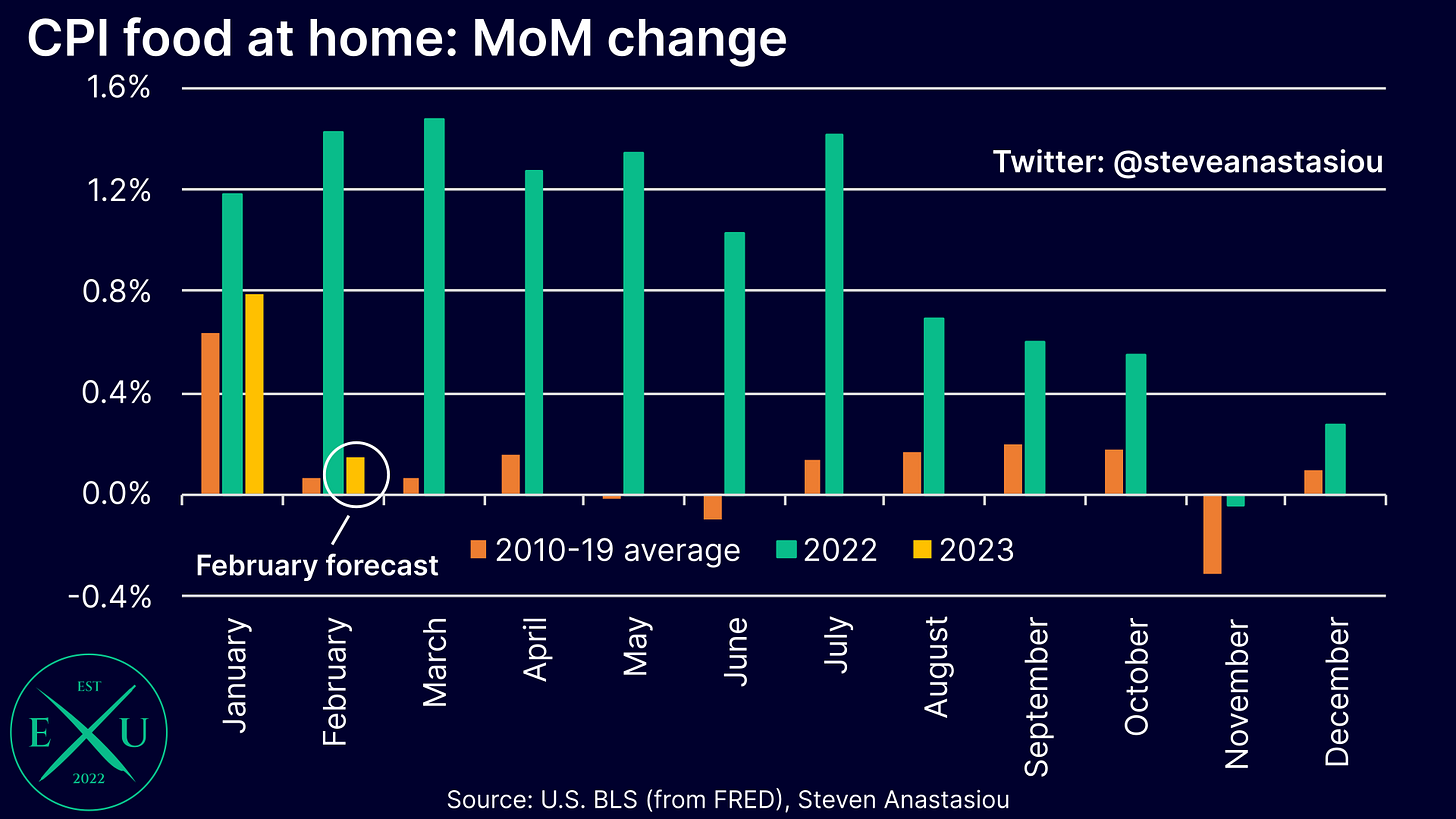
While still high, I expect another moderation in YoY CPI food at home price growth in February, taking it below 10% for the first time since February 2022.
With some additional forecast moderation in February, I anticipate that MoM CPI food at home price changes will have largely reverted to their historical level, paving the way for a material deceleration in the YoY growth rate over the year ahead.
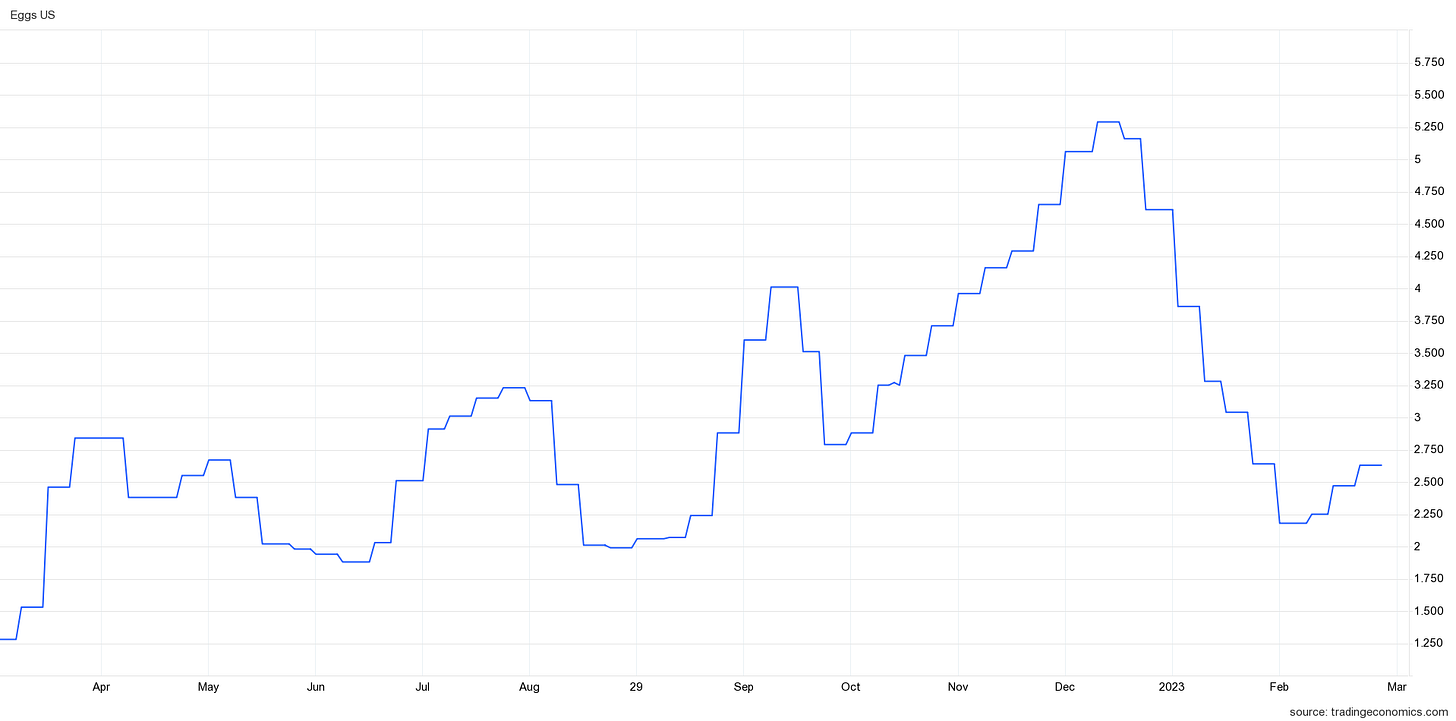
While eggs have garnered lots of headlines for how steeply their retail prices have risen (up 70.1% YoY in the CPI), one factor that may assist in further moderating MoM CPI food at home prices, is the large reduction that has been seen in wholesale egg prices in 2023.
Given that much of the decline in wholesale egg prices occurred throughout January, it’s possible that it won’t more fully flow through to retail prices until March, nevertheless, it’s something to note.
Gasoline prices rise modestly in February, but expected to turn YoY negative
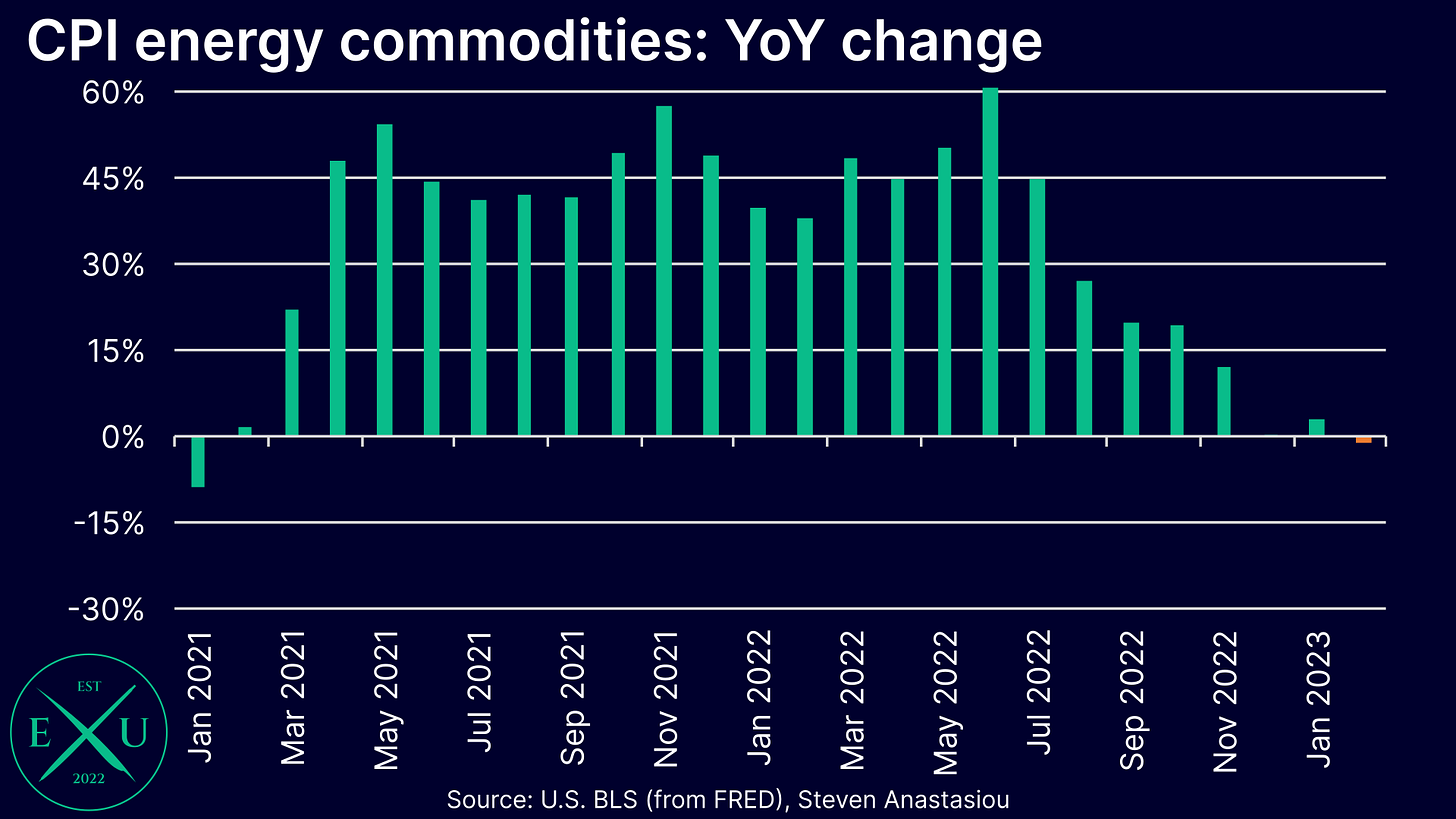
According to EIA data, weekly average retail US gasoline prices (to which the CPI energy commodities component tracks to a significant degree), saw a modest increase in February, rising 1.5%.
While this marks the second consecutive monthly increase in gasoline prices, a rise of 1.5% in the CPI energy commodities index for February, would result in its YoY rate turning negative. This is a drastic turnaround from the very high YoY growth that was recorded from March 2021 to November 2022.
Rent based measures (finally) show some signs of deceleration
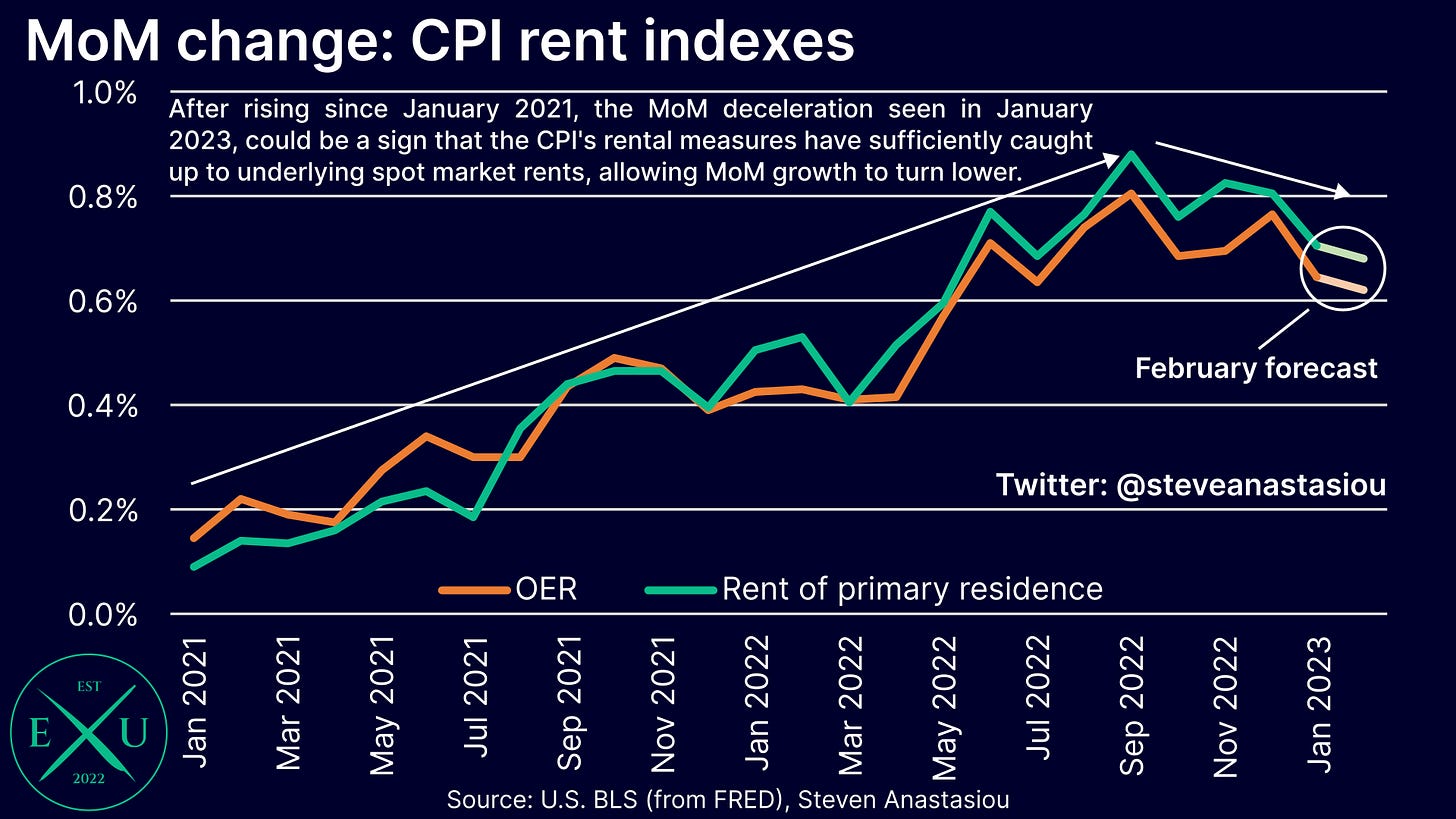
After seeing a relatively persistent upward movement over the past two years, the CPI’s lagging rent based measurements finally showed some signs of MoM price growth deceleration in January.
Both the owners’ equivalent rent (OER) and rent of primary residence (RPR) indexes recorded MoM growth noticeably below their peak levels. After having stabilised at high MoM growth rates, they are thus now showing signs of turning lower.
Given that we know that spot market rents have decelerated significantly, it has always been a matter of time before the CPI’s lagging rent based measurements began to record slower growth.
Though it’s important to remember that for the same reason that the CPI’s rent based measurement lags spot market rents, it’s also a smoothed indicator. This occurs on account of only a small proportion of the CPI’s rent sample being subject to a new rental agreement in any given month, with the rest of the sample consisting of continuing rents under lease agreements.
Given the signs of a downshift in spot market rents, I anticipate an ongoing reduction in both OER and RPR, but given their smoothed nature, I expect the deceleration to be a modest, gradual move over time.
Inflation spreads to internet prices
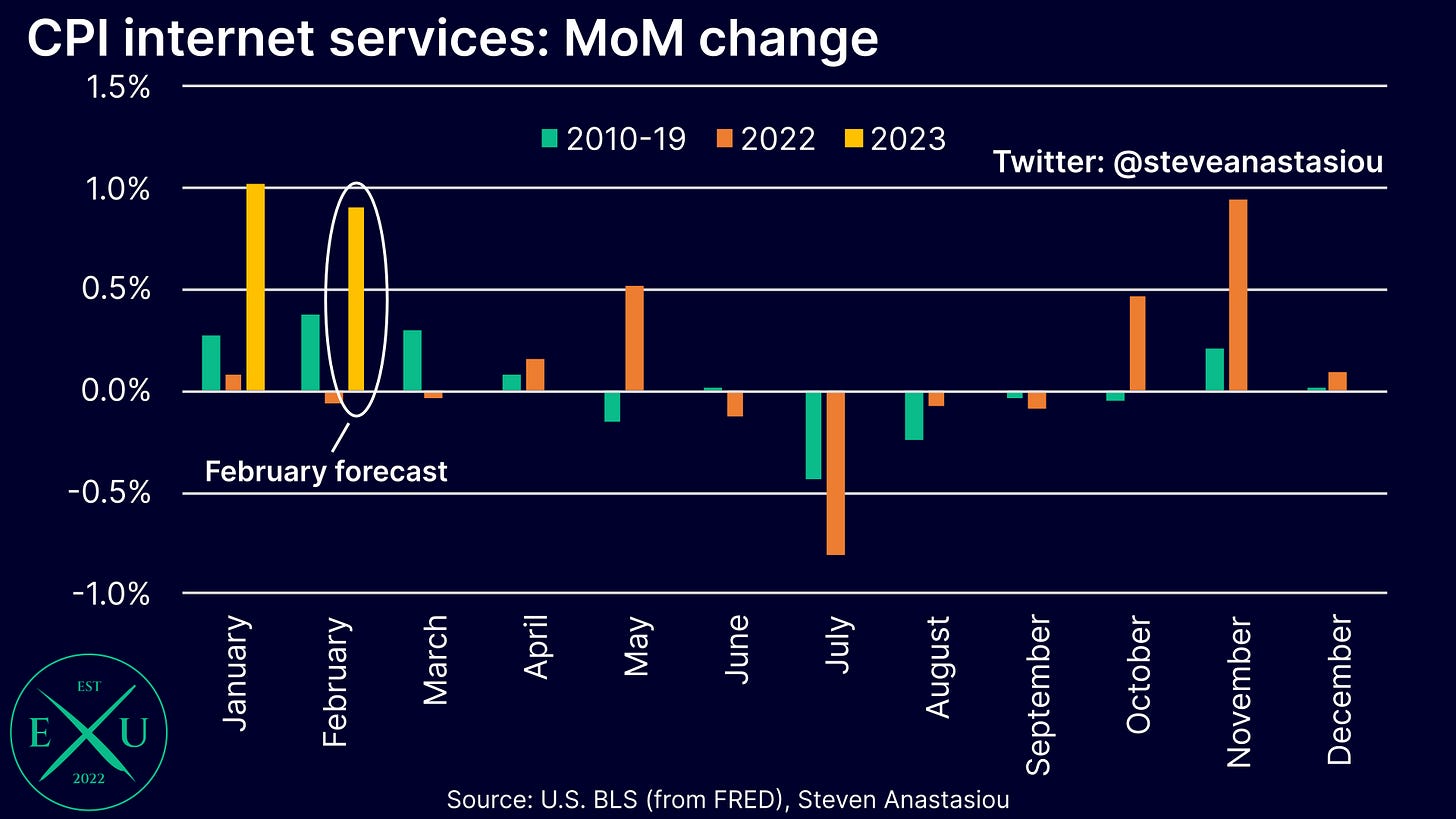
After seeing an average calendar year change of just 0.3% across 2010-19, and recording moderate calendar year growth of just 1.1% in 2022, inflation has now spread to internet services.
Beginning in October 2022, MoM price growth has regularly been WELL above its historical monthly average from 2010-2019. Given this recent trend, I forecast another hotter month in February. Though given the historical trend in internet price changes and declines in the M2 money supply, I expect MoM growth to normalise over time — though exactly when this occurs, is unclear.
Lower YoY, but hotter MoM growth, could deliver a significant blow to a vulnerable market
Putting it all together, and on a YoY basis, my headline CPI forecast comes in at 6.0%, down from 6.4% in January. My core CPI forecast comes in at 5.4%, down from 5.6% in January.
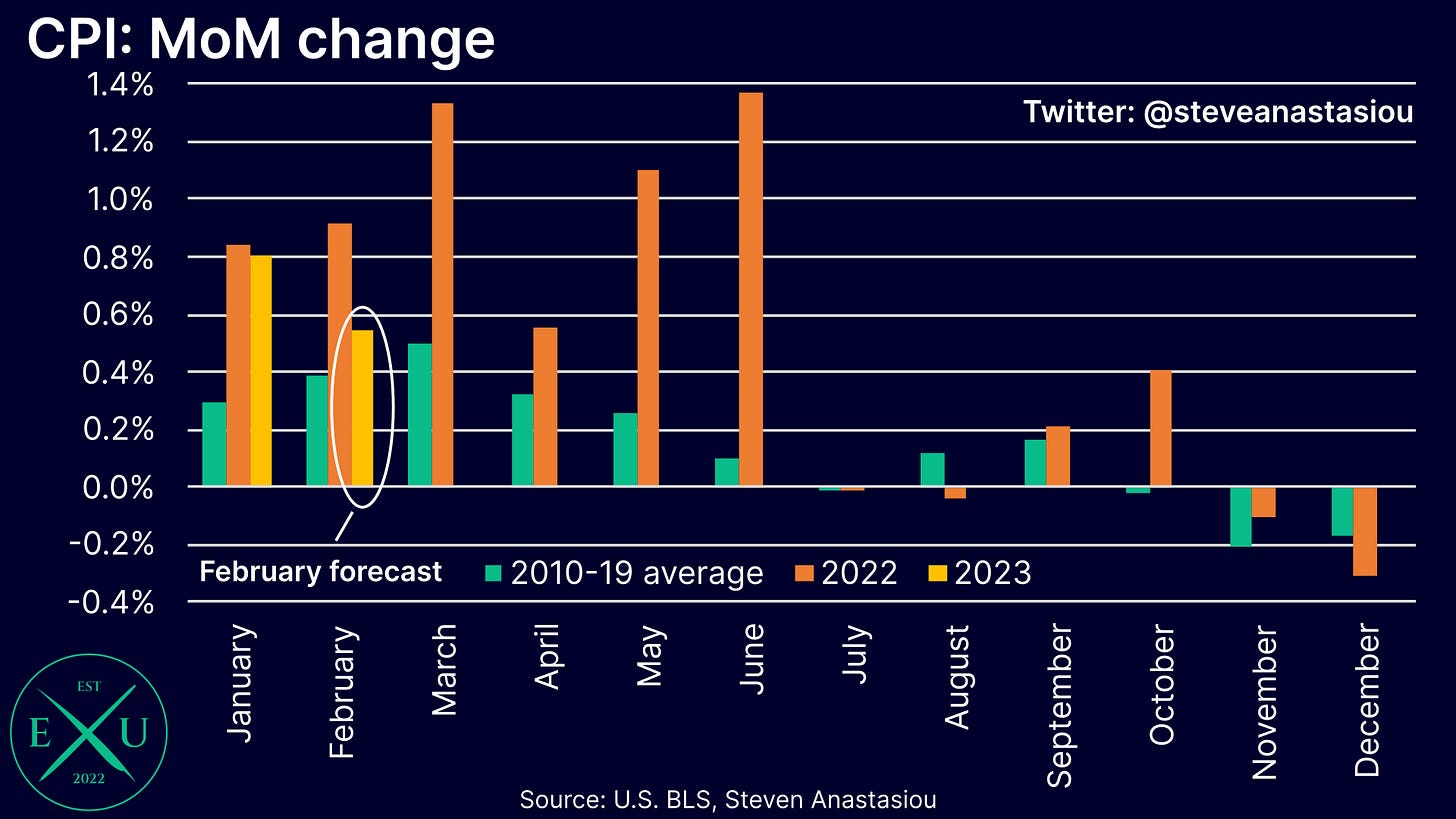
On a MoM basis, I forecast non-seasonally adjusted headline CPI growth of 0.5%. While less so than in January, this would represent another month of growth that is above its historical MoM average.
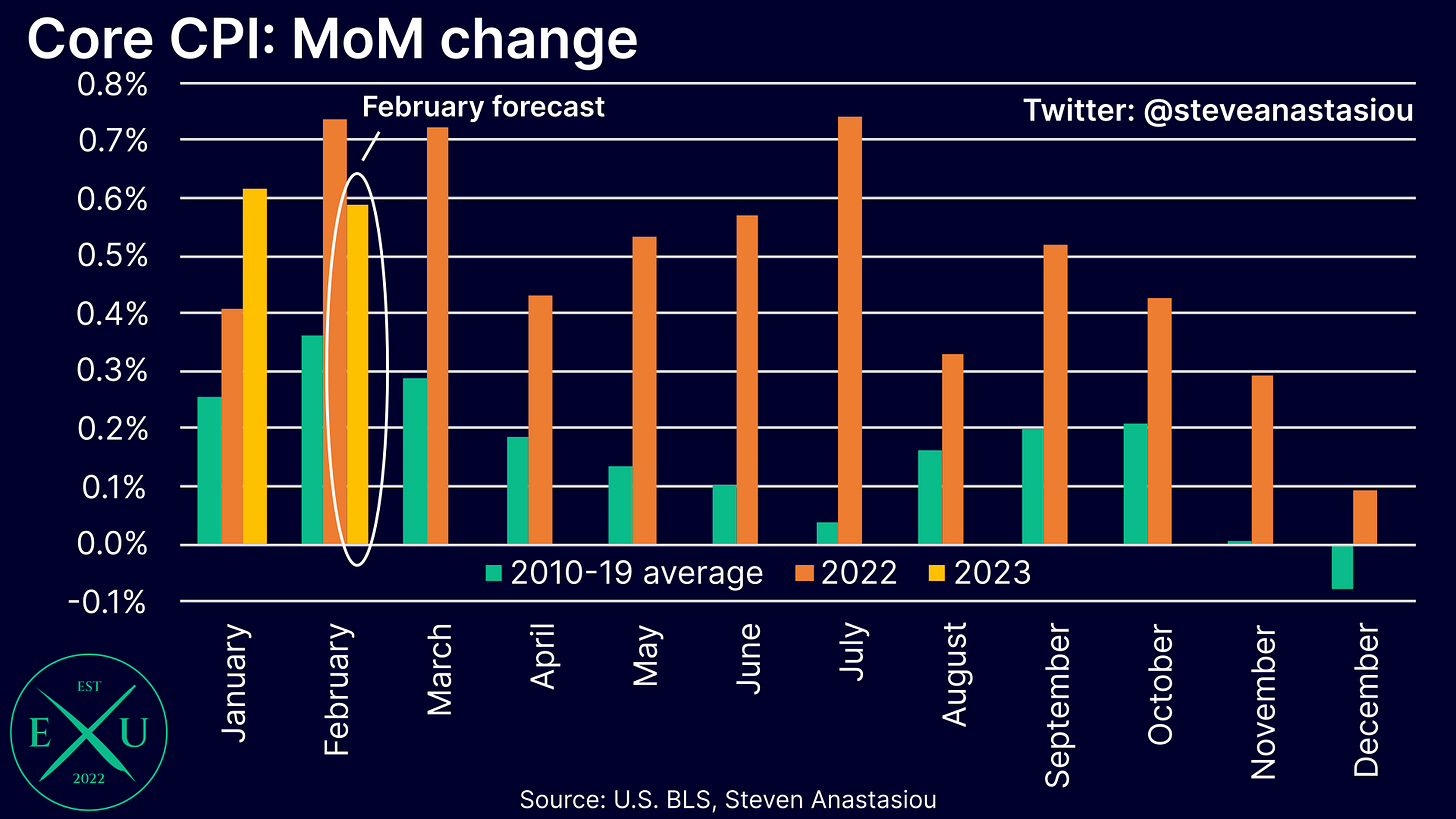
For the core CPI, I expect MoM growth of 0.6%, which would represent another month of growth that remains well above its historical average.
While lower YoY CPI growth would generate some positive headlines, another month of relatively high MoM CPI growth has the potential to deliver a big blow to markets, which may increasingly fret over the outlook for inflation and Fed policy, particularly given that market expectations for future Fed tightening have been significantly reduced in light of recent bank failures.
Though as I will now explain, the potential for growing concern about the outlook for inflation on the back of another hotter MoM CPI print, would be a mistake.
CPI ex-shelter shows a much bigger disinflationary story
One reason it would be a mistake, is that the CPI is heavily distorted by the lagging nature of OER and RPR, which represent a very large component of the CPI (and an even larger component of the core CPI).
Given their heavily lagging nature (which we know is currently resulting in the significant OVERSTATEMENT of the CPI), in order to get a clearer understanding of the underlying inflation outlook, we should also analyse the CPI on an ex-shelter basis.
Once this adjustment has been made, we can see that the disinflationary picture becomes abundantly more clear.
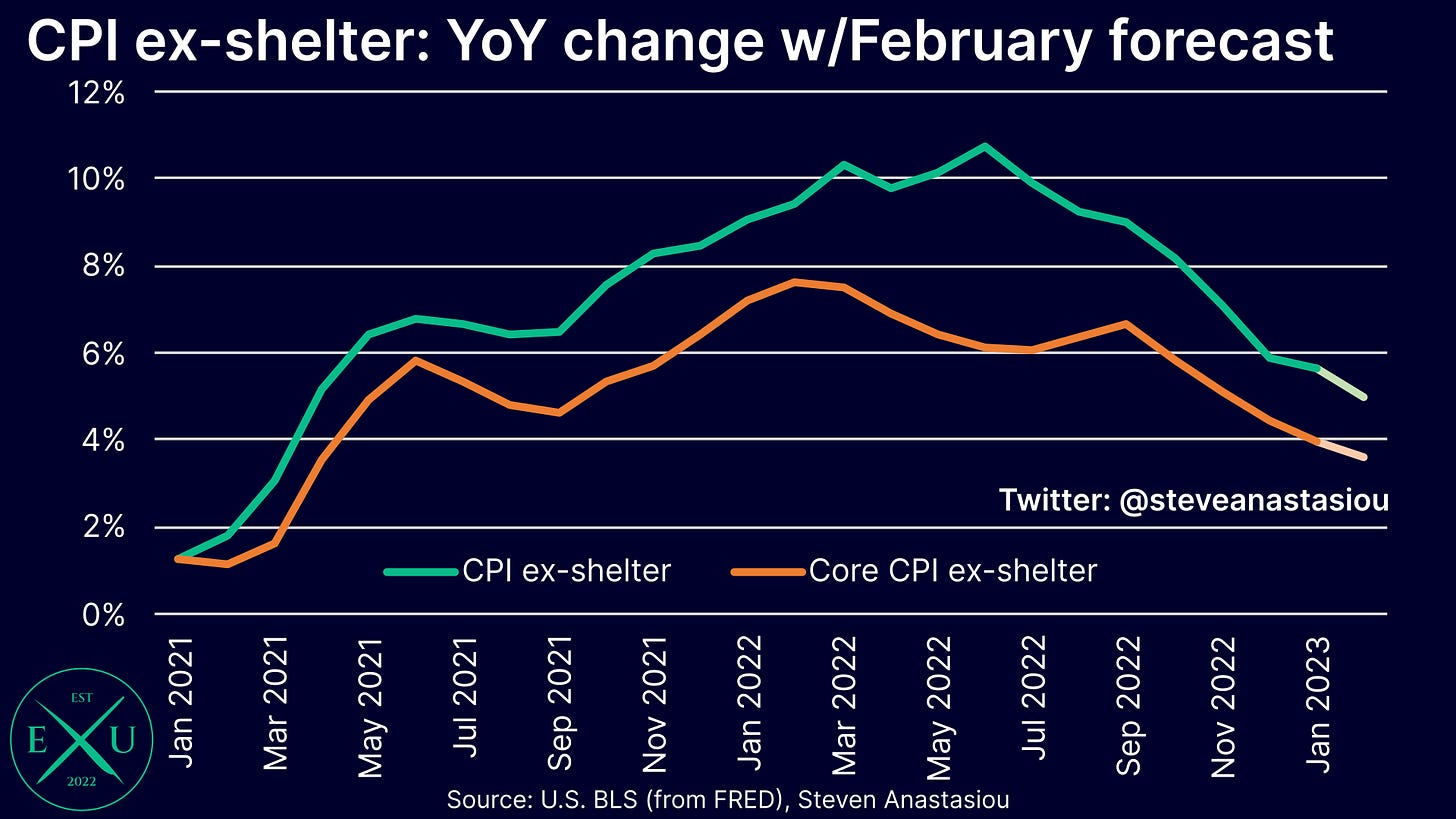
In February, I expect the YoY growth rate of CPI ex-shelter to fall to 5.0%, from 5.7% in January, and a peak of 10.8% in June 2022. This would represent the lowest YoY growth rate since March 2021. Meanwhile, I forecast core CPI ex-shelter to fall to 3.6%, down from 4.0% in January, and its lowest reading since April 2021.
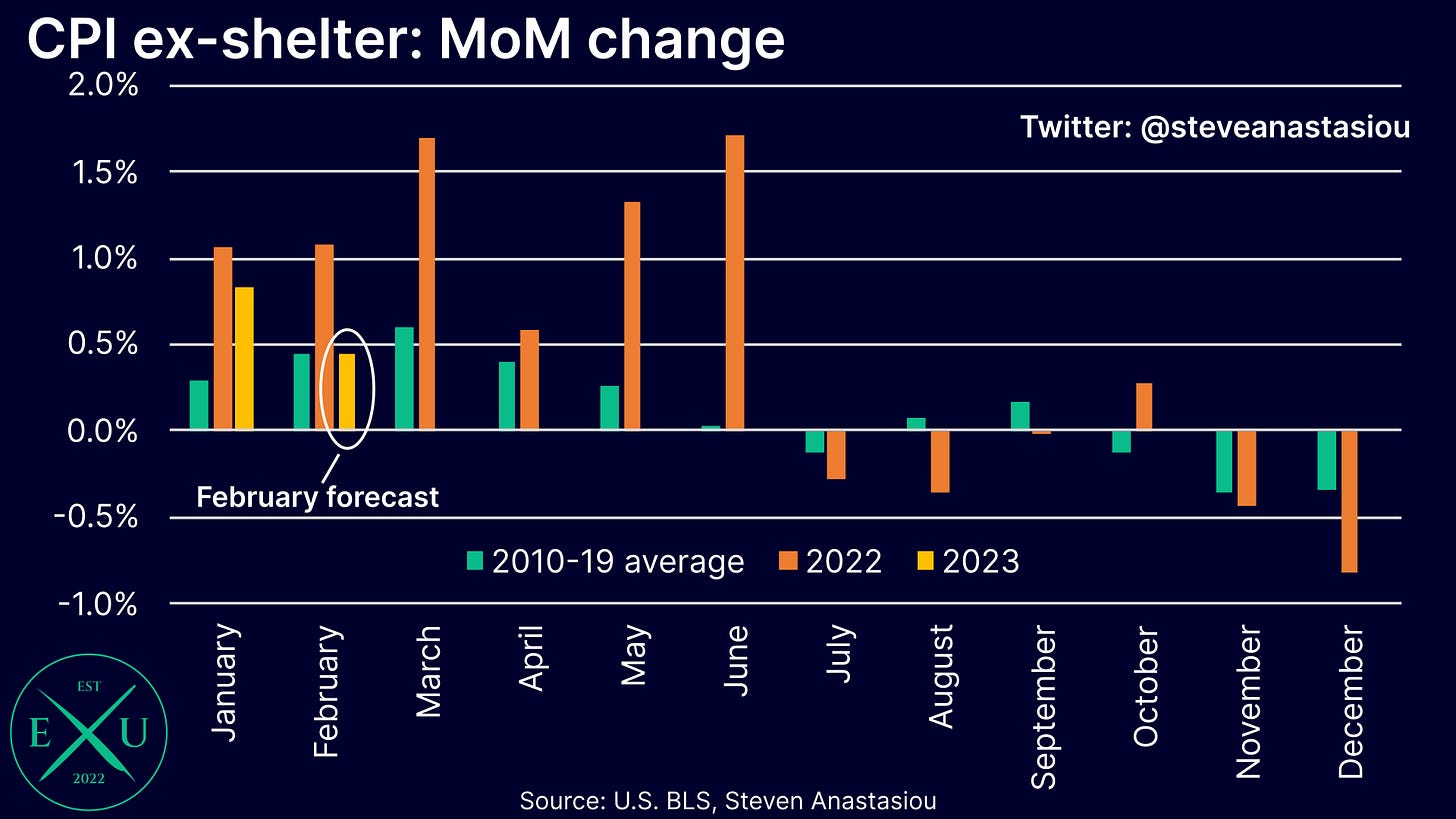
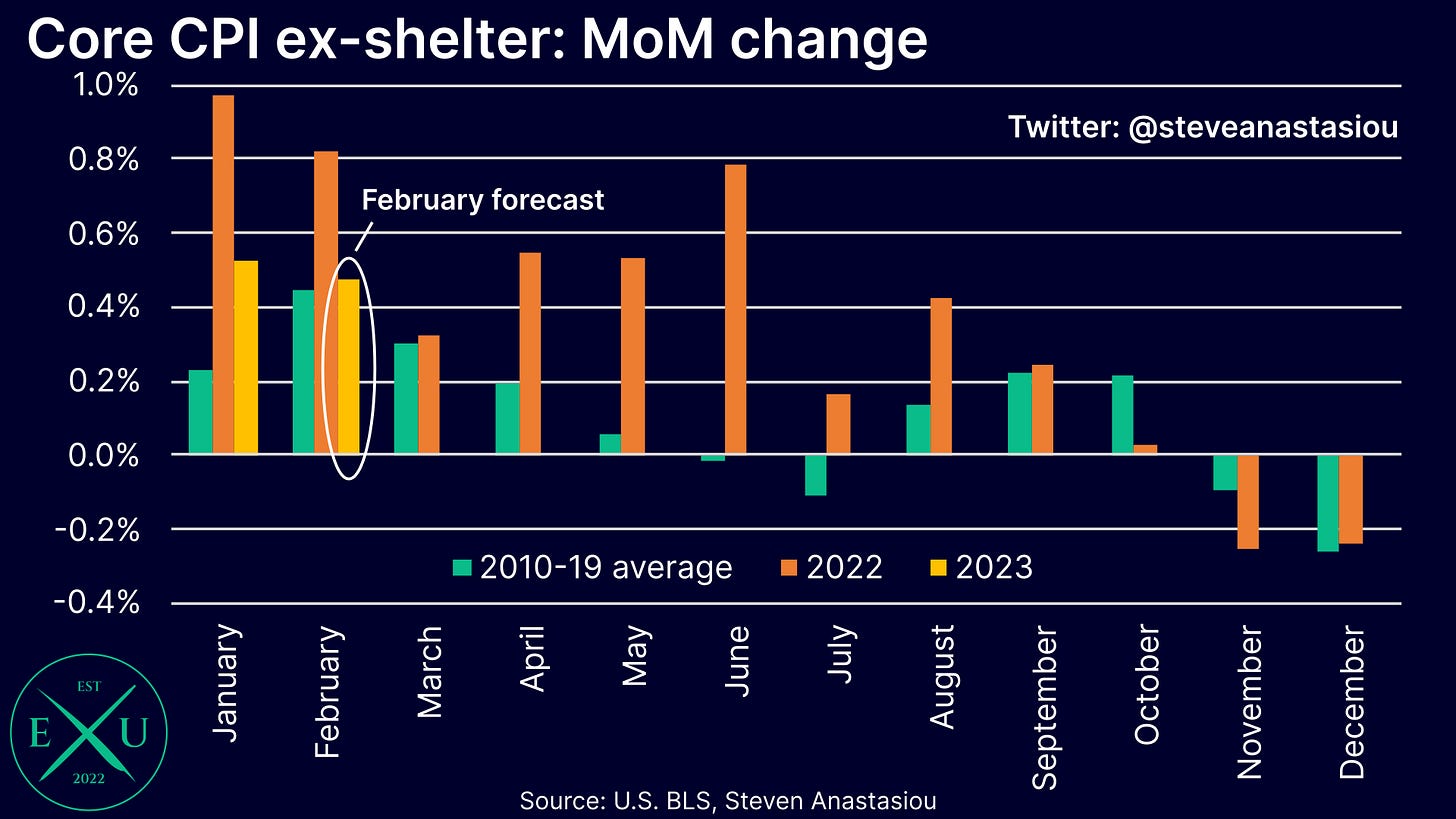
In terms of the MoM growth rates, after a hotter January, I expect MoM CPI ex-shelter growth to return to its historical norm in February.
The story is virtually the same for the core CPI ex-shelter.
Understanding M2 & the price cycle, shows that more tightening would be a big mistake
In addition to indications that the CPI on an ex-shelter basis will return to its historical average MoM growth rate in February, understanding how inflation evolves, shows that more tightening would be a big mistake.
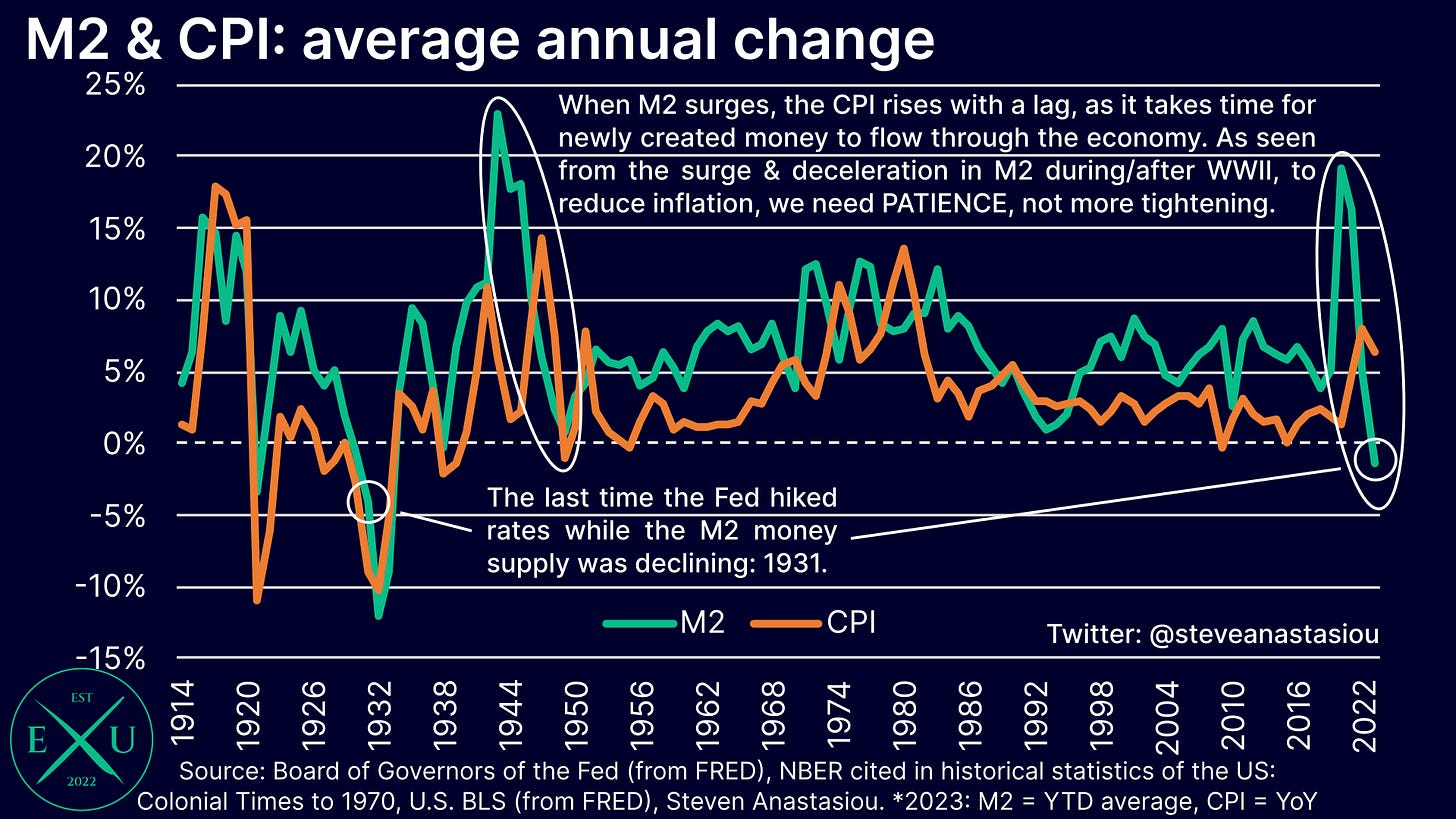
The primary driver of inflation is growth in the money supply. Its post-COVID surge (which was the highest increase in M2 since WWII), is why the US saw high inflation.
The reason for this is simple, the more money that exists, the more units of money that can be used to bid up the price of a given good or service. Though given that it takes time for changes in the money supply to flow throughout the economy, there is a lag between an increase in the money supply and price changes.
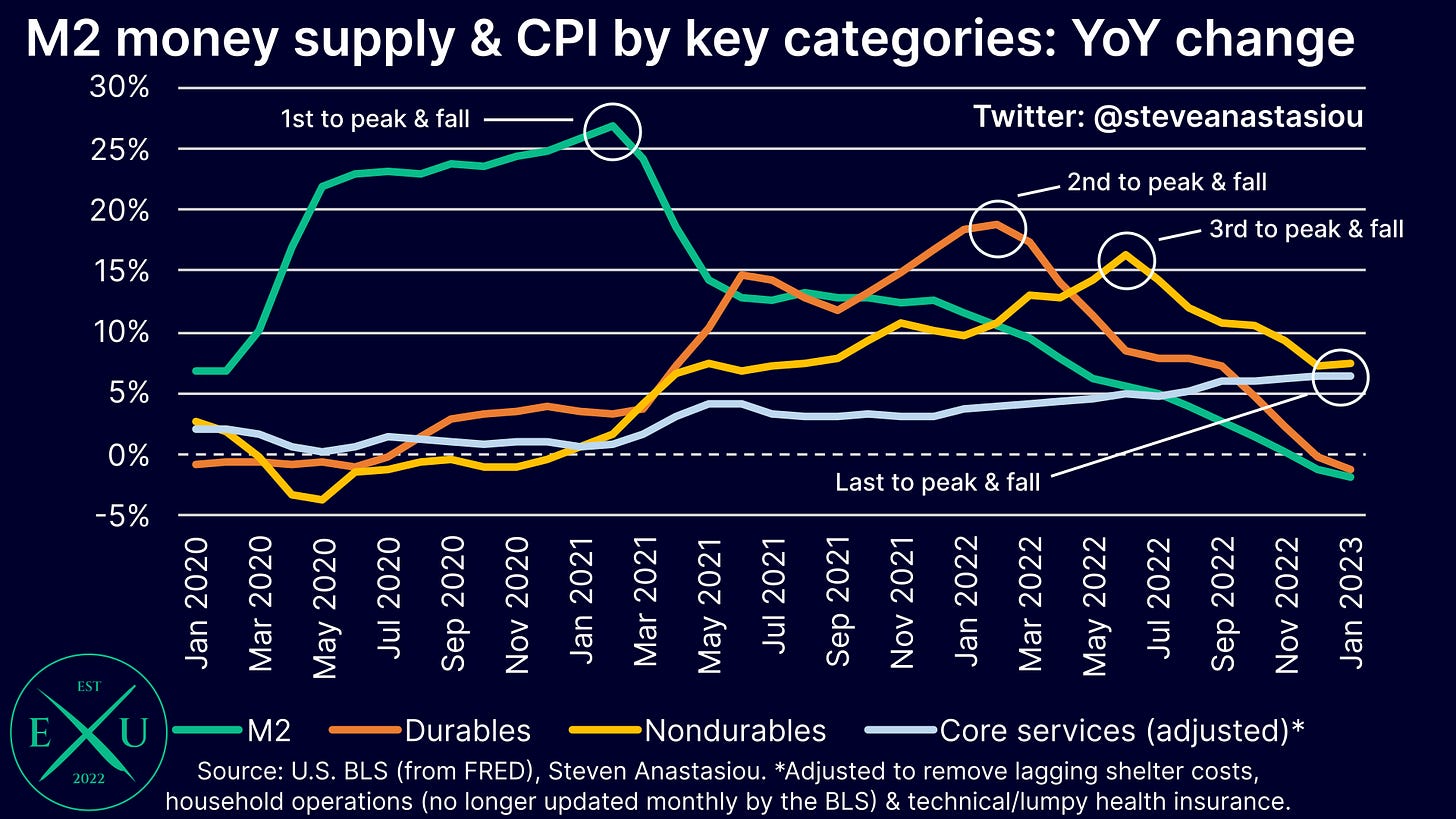
With COVID and associated restrictions keeping people at home while the government was handing out stimulus checks, the first area to see a significant increase in demand was durable goods, as people spent up on items like electronics and home appliances.
As movement increased, economic activity normalised, and inventories needed to be replenished, nondurables like gasoline, then saw their prices rise.
Services prices are typically the most lagging. The impact of COVID, which delayed an increase in demand for services from an expanding money supply, further reinforced the lag. While they were the last area to see price growth, services prices have been, and continue to, rise.
As a result, the increase in the money supply has now largely flowed through all areas of the economy.
Though the key thing to note is that with the M2 money supply now recording YoY declines, not only has the price growth from the prior expansion of the M2 money supply largely filtered through the economy, but the disinflationary phase, has now been underway for many months, and continues.
Durable goods prices have turned YoY negative and nondurables prices have disinflated significantly. With gasoline prices likely to turn YoY negative, and food at home prices likely to keep decelerating, nondurables should disinflate further over the months ahead.
The main driver of MoM price growth is thus LAGGING services prices, which as opposed to indicating that higher inflation is on the way, are simply accounting for the PRIOR change in the money supply, durables, and nondurables prices.
As opposed to more tightening being needed to fight inflation, a declining money supply says that lower inflation will occur over time — all that is required, is patience.
Continuing to tighten, instead risks exacerbating a future recession. Not since the Great Depression has the Fed increased interest rates while the M2 money supply is declining. Ignoring the lessons of history, means that the US economy faces a dangerous period ahead.

Thank you for reading!
Thank you for continuing to read and support my work — I hope you enjoyed this latest piece.
In order to help support my independent economics research, which aims to democratise access to institutional grade insights & analysis (as opposed to it being the exclusive domain of hedge funds & asset managers), please like and share this latest research piece.
If you haven’t already subscribed to Economics Uncovered, subscribe below so that you don’t miss an update.


