Does January's spike in OER signal bad news for the Fed's 2% inflation goal?
Given its huge CPI weighting, OER is critical to the inflation outlook - this update explains everything that you need to know about its January spike and its likely medium-term direction.
What is OER and how does it differ from RPR?
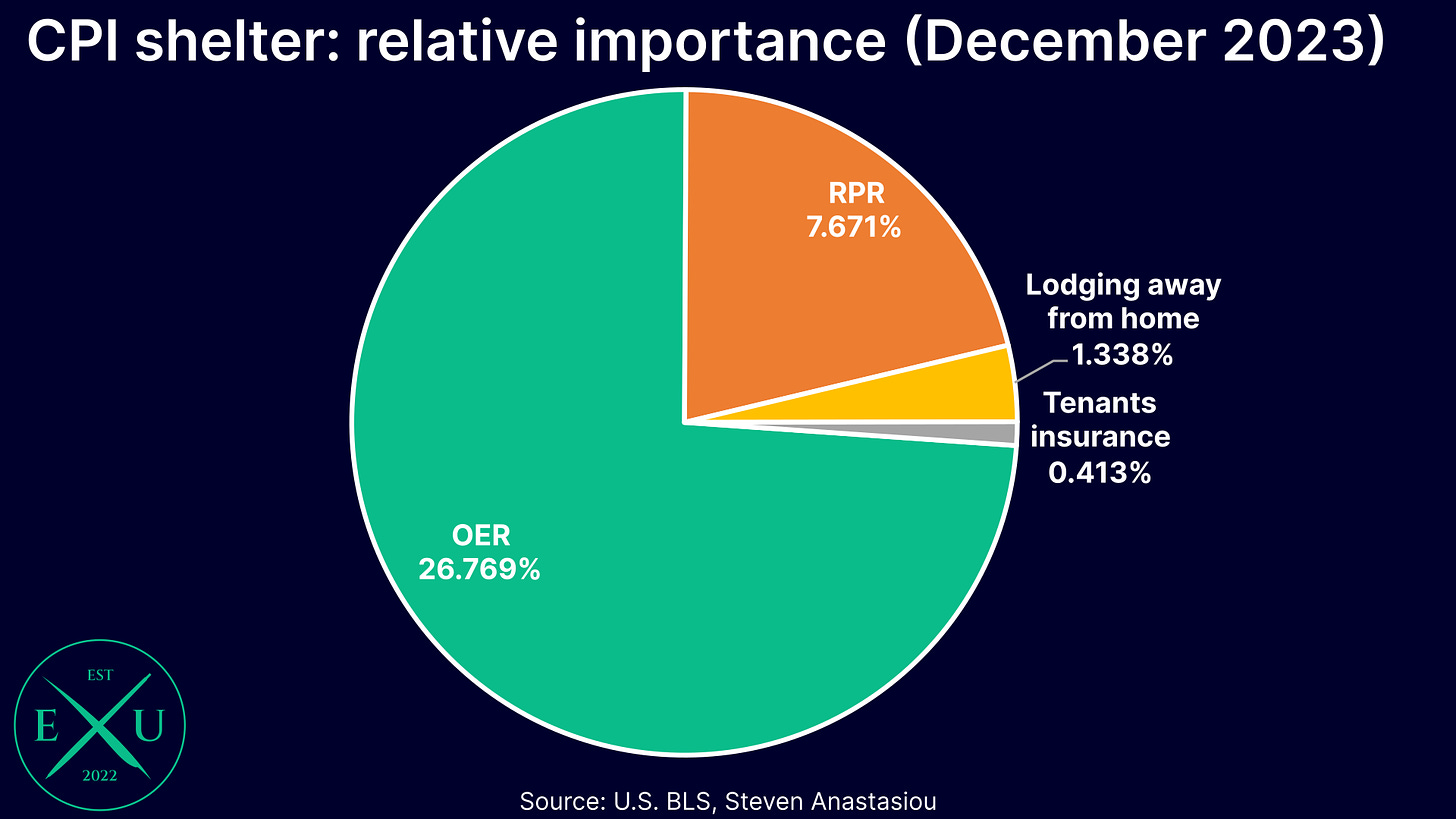
Owners’ equivalent rent (OER) represents the bulk of the CPI’s shelter index and in January’s CPI report, was weighted at an enormous 26.8% of the entire CPI.
Together with rent of primary residence (RPR), which was equal to 7.7% of the CPI in January, these two items comprise the bulk of the CPI’s shelter index, which was weighted at 36.2% of the CPI in January.
A common misconception is that OER reflects the cost of purchasing a home. Instead, OER aims to measure the implicit rent that owner occupants would have to pay if they were renting their homes, excluding any furnishings or utilities. Owned housing units themselves are not priced in the CPI.
Conceptually, both OER and RPR are thus largely measuring the same thing — the key difference being that OER measures “pure rent”, while RPR measures “economic rent”, which incorporates the value of any utilities included within a rental agreement.
While largely measuring the same thing (the rental value), given the inclusion/exclusion of utilities, as well as differences in the underlying housing unit sample and differences in unit-level weights, OER and RPR do see variances in MoM growth between each other.
What happened to OER in January?
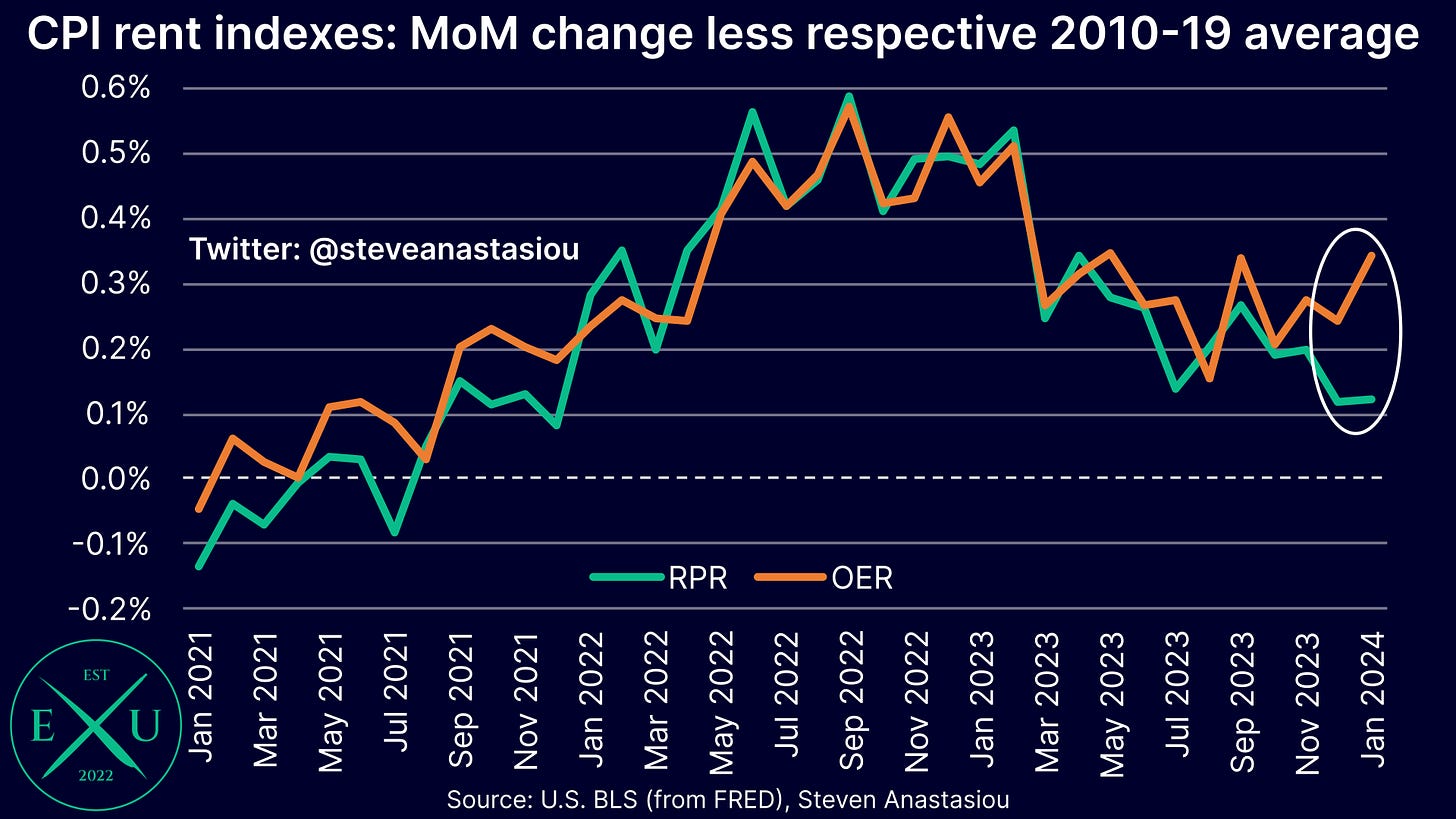
While subject to some differences, given that OER and RPR are largely measuring the same thing, it’s no surprise to see that the two indexes tend to record similar MoM growth over most time periods.
Though in January, this was not the case, with OER spiking higher and RPR recording a second consecutive month of relatively more modest MoM growth versus levels seen over the past year.
How often does OER see material divergences to RPR?
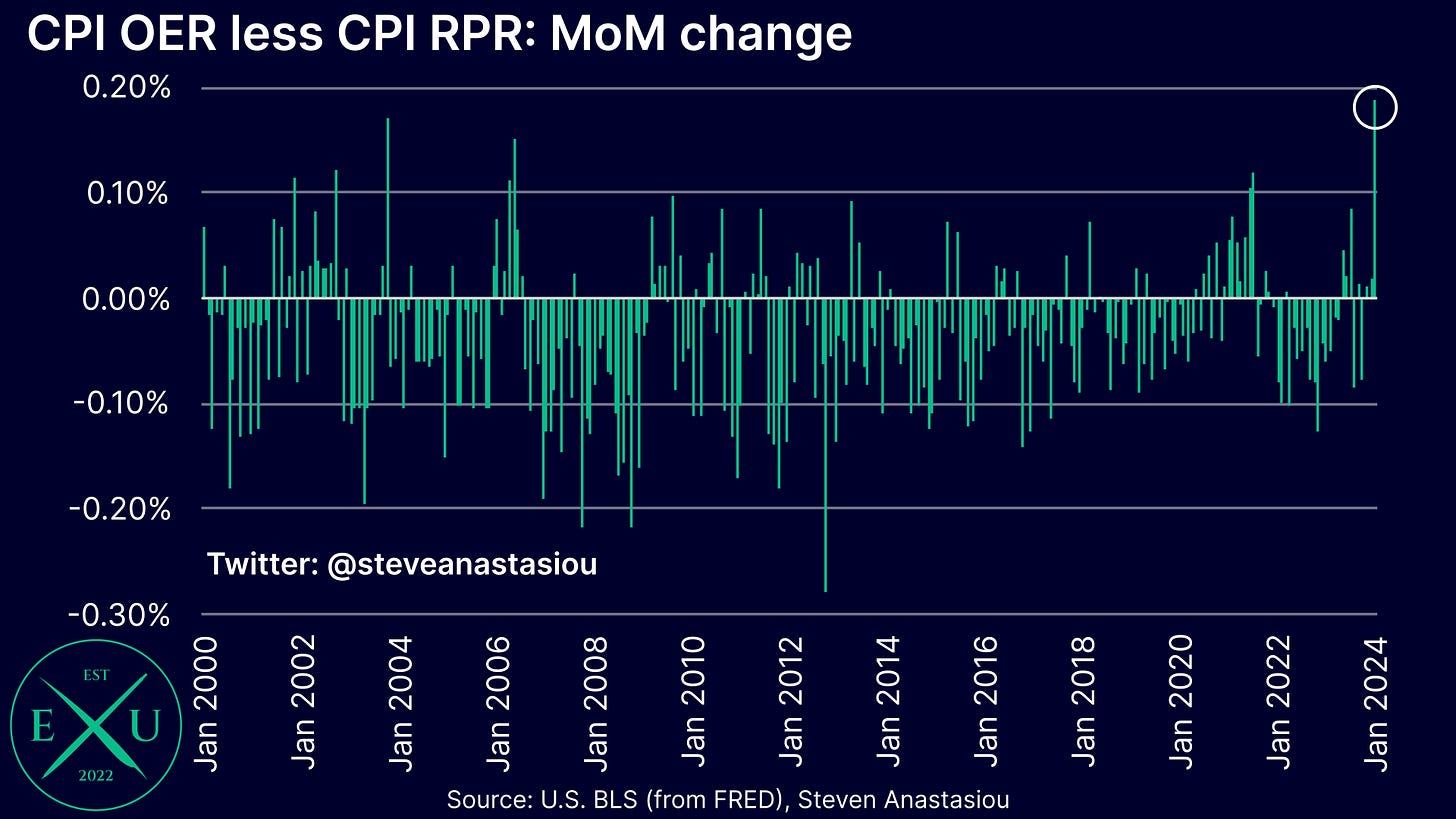
While OER and RPR do see somewhat regular material MoM deviations, they usually occur on account of OER coming in significantly lower than the change in RPR — this is reflected in the lower average YoY growth rate of OER (3.0%) vs RPR (3.5%), since 2000.
The size by which OER came in above RPR in January was the largest positive gap seen since September 1995 — while historical MoM divergences have tended to revert back to historical norms fairly quickly, a divergence of this magnitude warrants additional investigation.


