Economics Uncovered Chart Pack: August 2023
The latest monthly Economics Uncovered Chart Pack is out now: with 86 charts in total, this chart pack provides a comprehensive view of inflation, the money supply, GDP & the jobs market.
With 86 charts in total, this chart pack represents a comprehensive overview of key topics, including:
the global money supply & inflation;
the US banking sector;
US GDP; and
US employment.
Included in the chart pack are three proprietary indicators:
1) Economics Uncovered Global M1 Proxy (YoY change)
With most central banks around the globe aggressively tightening monetary policy, it’s no surprise to see that the Economics Uncovered Global M1 Proxy remains in deeply negative territory. This is likely to result in a sharp reduction in inflation in many nations around the globe over the medium-term — it also means that there’s likely to be significant downward pressure on nominal economic activity over the medium-term.
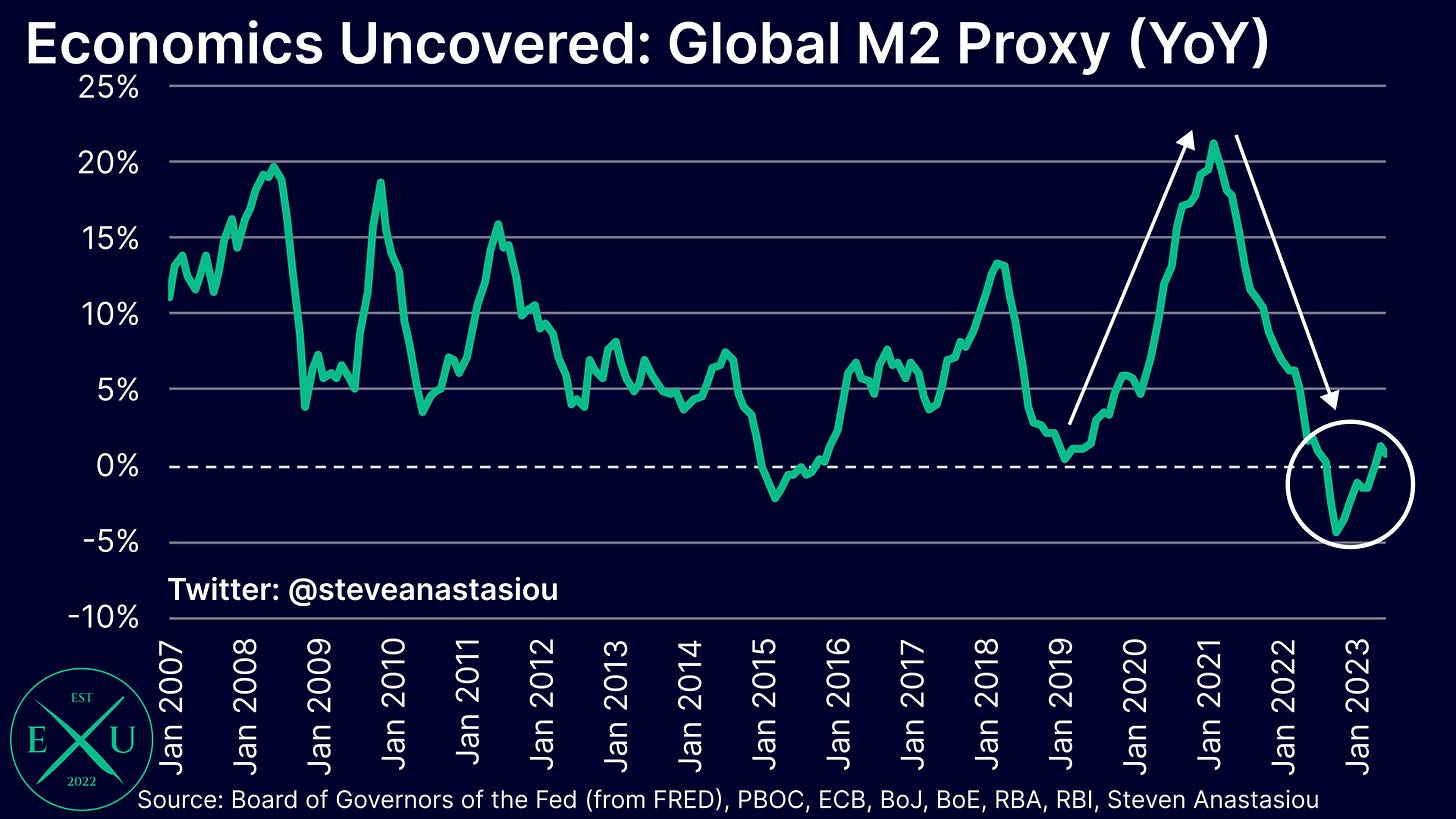
2) Economics Uncovered Global M2 Proxy (YoY change)
While the Economics Uncovered Global M1 Proxy remains in deeply negative territory, the Economics Uncovered Global M2 Proxy has recently returned to YoY growth. A key reason for this divergence, is that the broader definition of M2 means that it captures a wider array of more interest rate sensitive categories, which individuals have increased their allocation to as interest rates have risen.
Despite returning to positive territory, the very modest annual growth in the Economics Uncovered Global M2 Proxy again points to much lower inflation over the medium-term for many nations around the globe.
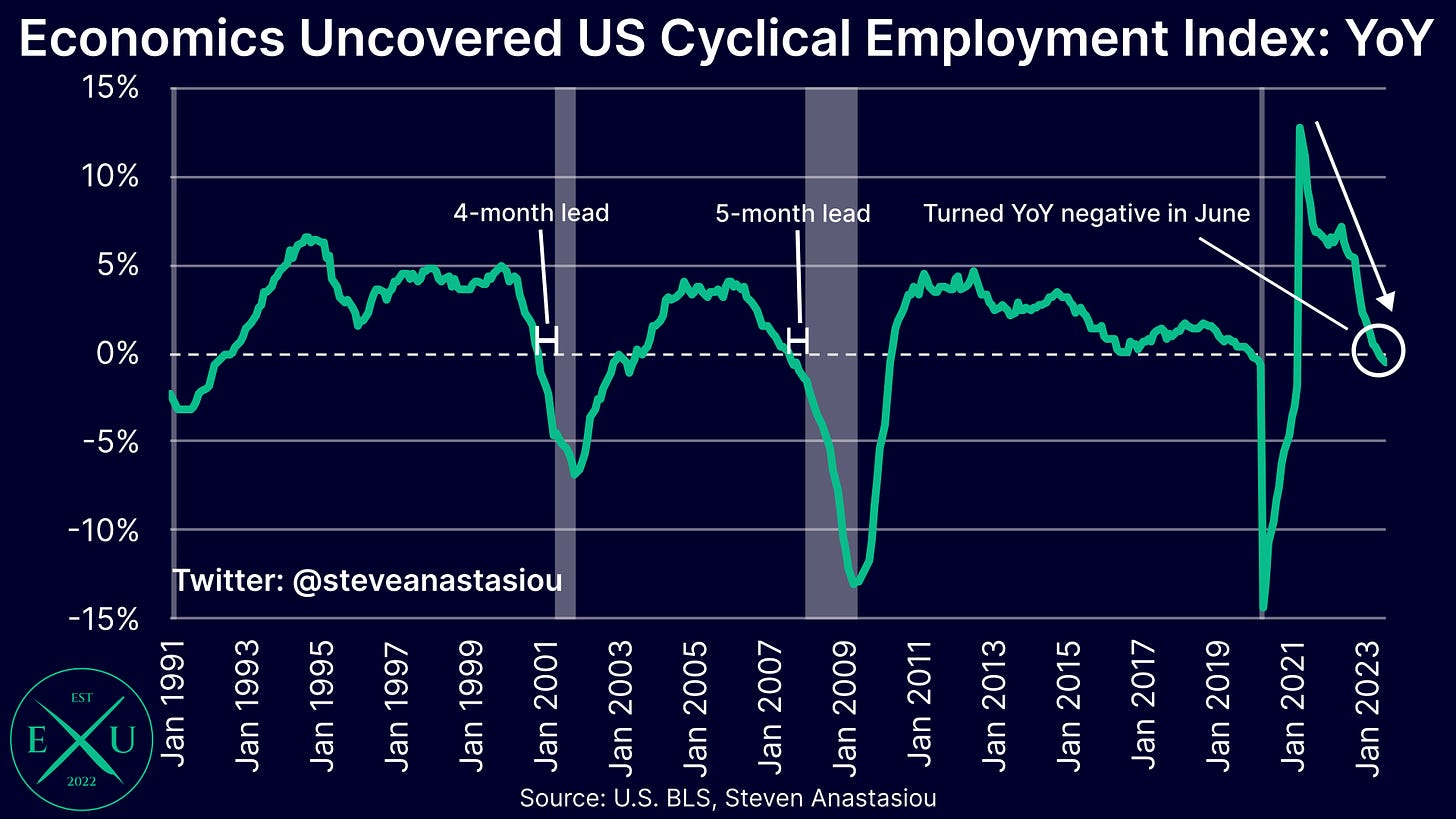
3) Economics Uncovered US Cyclical Employment
While the annual change in overall US nonfarm payrolls doesn’t usually turn negative until a recession has already been well underway, there are certain areas of the employment market that provide a leading indicator of economic activity.
The Economics Uncovered US Cyclical Employment indicator groups several of these key categories together - it turned YoY negative in June.
This metric turned YoY negative four and five months ahead of the 2001 and 2008 recessions, respectively.
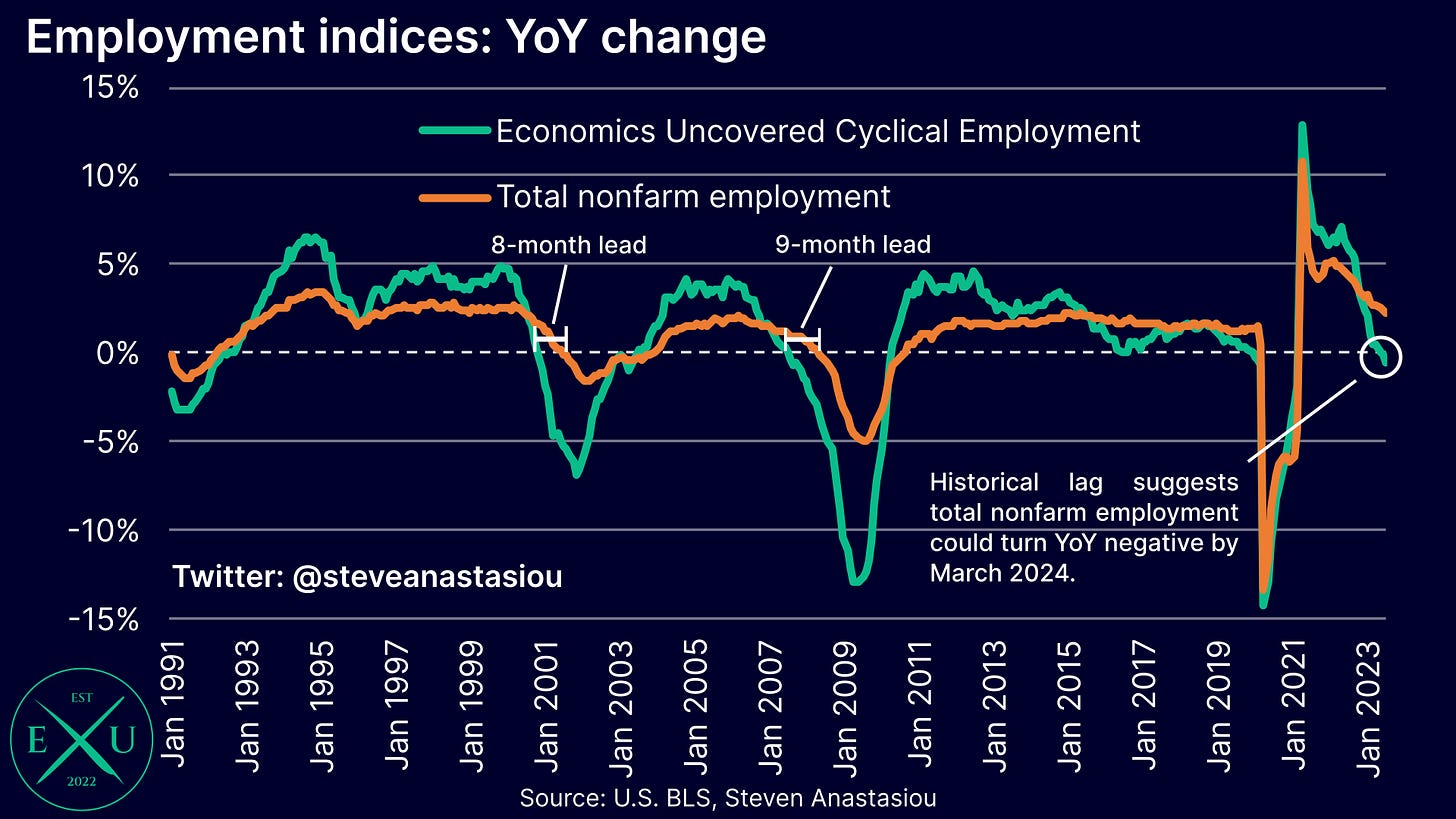
The Economics Uncovered Cyclical Employment Index turned YoY negative 8 and 9 months ahead of overall nonfarm payrolls, in 2001 and 2009 respectively.
The link to the full chart pack is below:
Thank you for reading my latest research piece — I hope it provided you with significant value.
Should you have any questions, please feel free to leave them in the comments below!
In order to help support my independent economics research (remember, everything you see — the forecasts, the charts, the analysis, the in-depth explanations of economic history — is all completed independently by me, for you), please consider liking and sharing this post and spreading the word about Economics Uncovered.
Your support is greatly appreciated and goes a long way to helping make Economics Uncovered a sustainable long-term venture that will be able to continue to provide you with valuable economic insights for years to come.
If you haven’t already subscribed to Economics Uncovered, subscribe below so that you don’t miss an update.


