US CPI Review: October 2023 & Flash November Forecast
Helped by falling car prices, CPI disinflation continued in October. While positive signs were seen in some services prices, MoM core services price growth remained above its historical average.
In October, headline CPI inflation fell from 3.7% to 3.2% YoY. This was below both my forecast (3.3%) and the consensus forecast (3.3%).
Core CPI inflation fell from 4.1% to 4.0% YoY, again, this was below both my forecast (4.2%) and the consensus forecast (4.1%).
Monthly headline and core CPI growth falls below its historical average
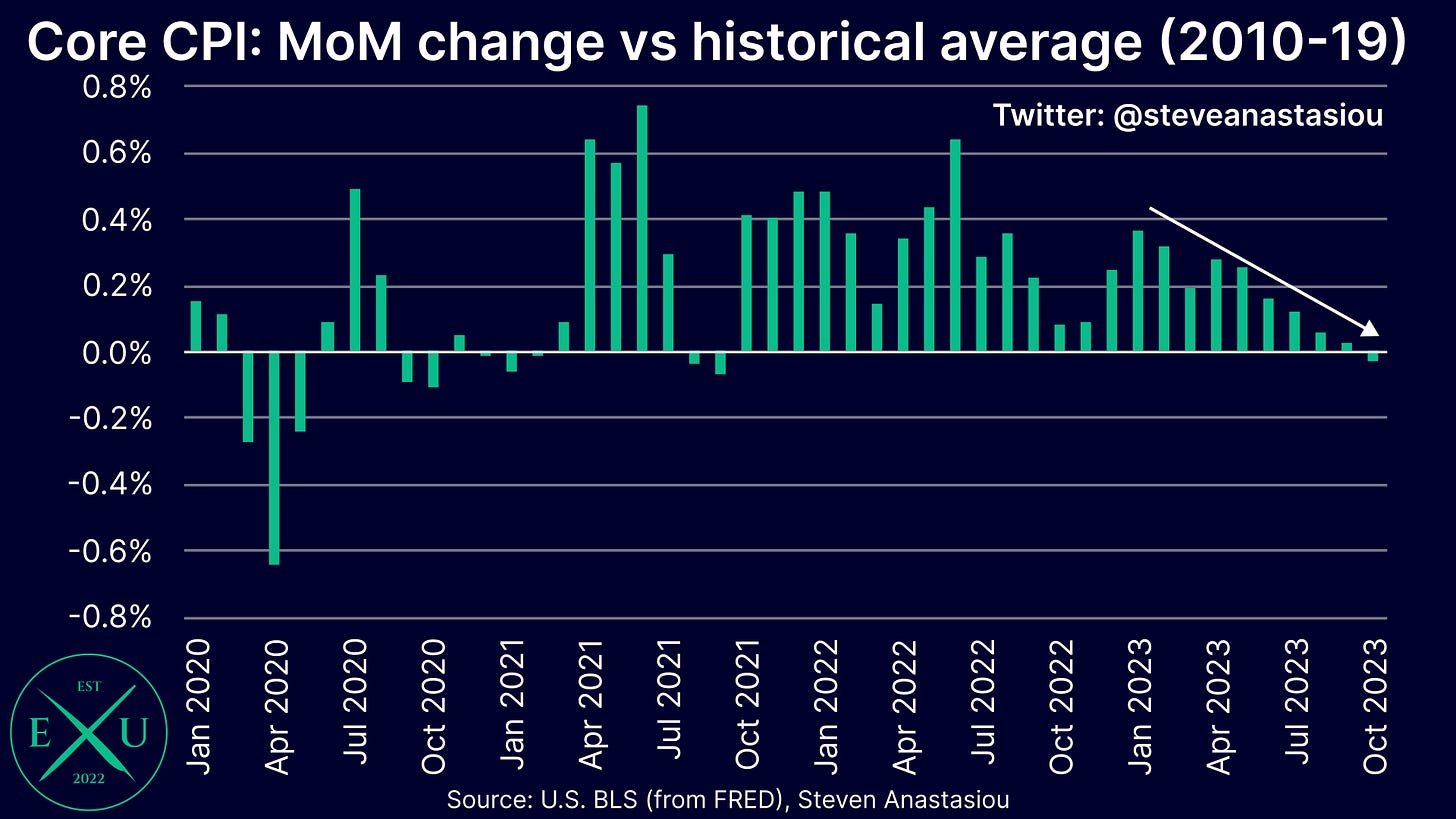
In addition to further falls in YoY growth, both the headline CPI and the core CPI recorded MoM growth that was below the respective 2010-19 average for October.
Monthly headline CPI growth was -0.04%, which was 0.02% below the 2010-19 average for October.
Monthly core CPI growth was 0.18%, which was 0.03% below the 2010-19 average for October.
This was the first time that core CPI growth was below its historical monthly average since September 2021, marking a significant milestone in the current disinflationary cycle.
Spot market rent adjusted inflation remains <2% YoY
On a spot market rent adjusted basis, annual headline and core CPI growth remains below 2% YoY.
Headline CPI growth was 1.4% YoY in October (vs 1.7% in September), while core CPI growth was 1.6% YoY (vs 1.6% in September).
Note that this reflects the new method of adjusting for spot market rents, which includes a simple average of both Apartment List and Zillow spot market rental data (versus just Apartment List previously), as discussed in greater detail in my latest medium-term US CPI forecast update.
Durables prices continue to fall as both new and used car prices decline
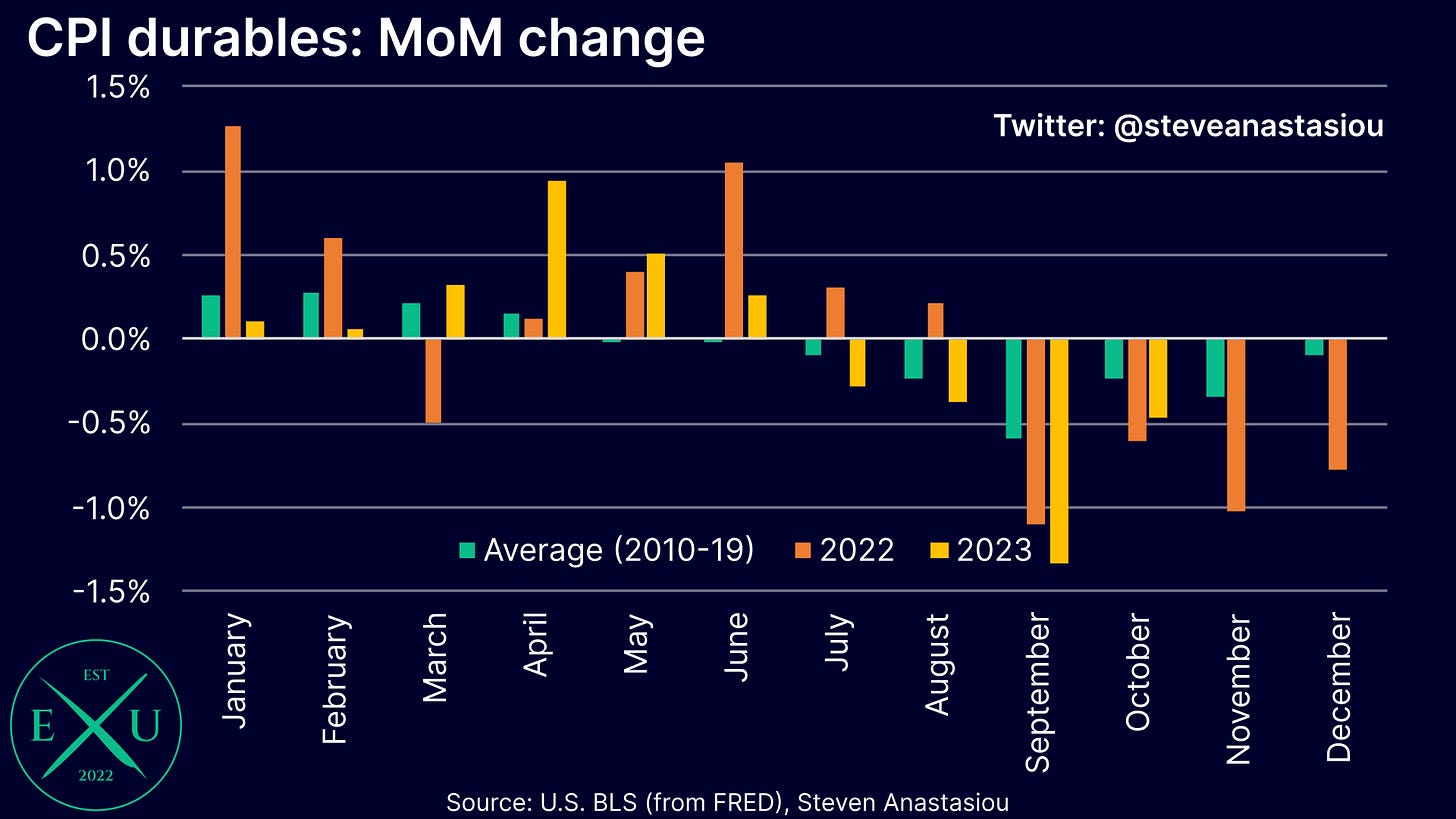
In terms of my forecast, the key driver of lower than expected CPI growth came from car prices — both new and used — and durables prices more broadly.
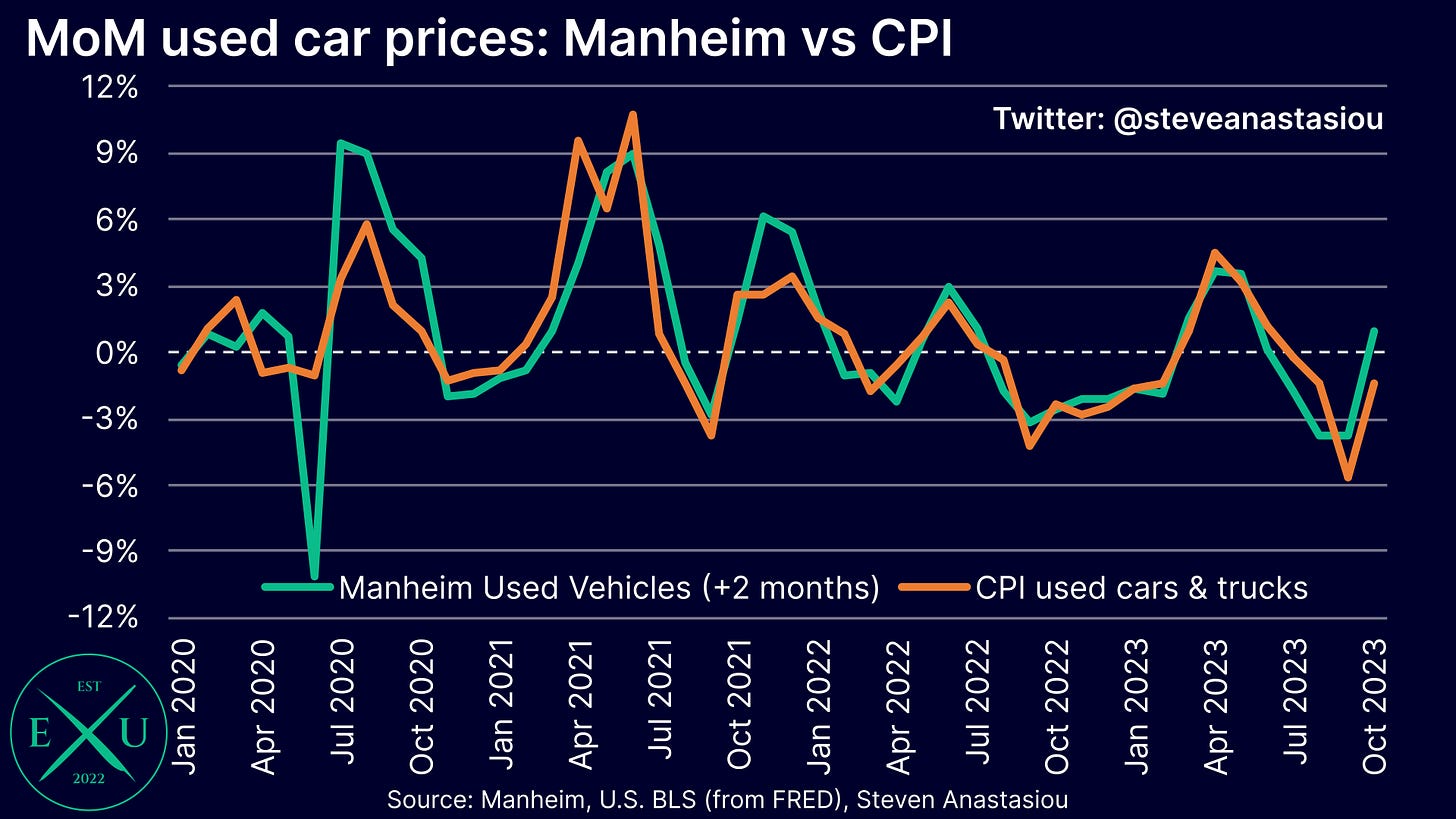
For the 2nd consecutive month, CPI used vehicle & truck prices were materially below the move implied by a 2-month lag of wholesale prices (as per Manheim): -1.4% vs 0.9% implied.
While October is an historically weak month for retail used car prices, which meant that I had forecast weaker MoM growth than the implied 0.9% (forecast of 0.5%), growth was materially weaker still.
This means that the large gap that opened up between retail and wholesale used car prices has now significantly converged, albeit with a noticeable gap still in place.
Furthermore, for the first time since February, new vehicle prices recorded MoM growth that was below the respective 2010-19 average.
The negative variation was the largest that’s been seen since March 2020.
For the fourth time in the past six months, other nondurables prices also recorded a significant relative MoM decline, falling by 0.5% MoM, which was 0.2% below its historical average. This marks four consecutive months of monthly CPI durables price growth being below its historical average.
Food prices record somewhat higher MoM growth
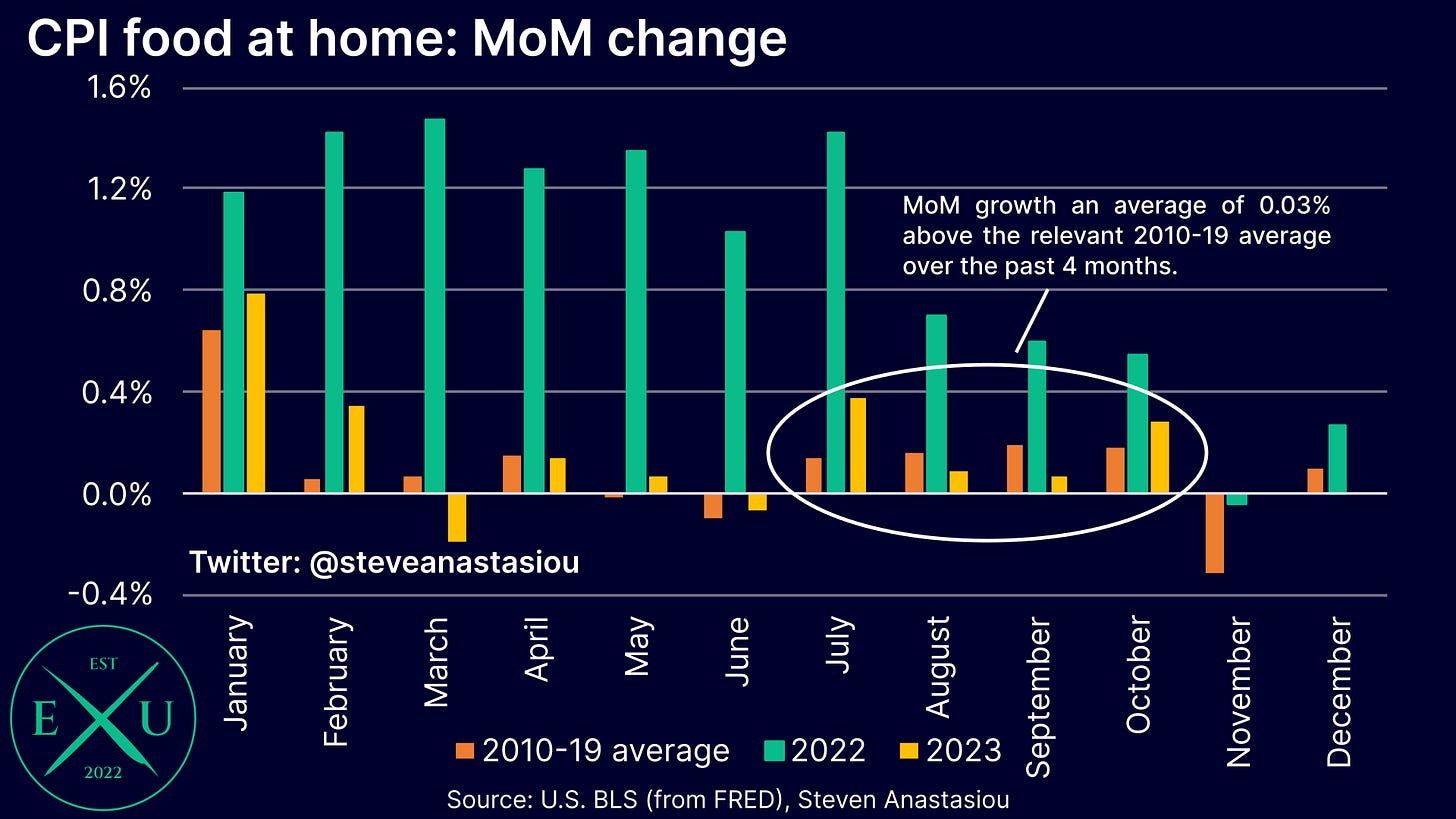
In contrast to the continued significant relatively large decline in durables prices, food prices saw their relative MoM growth increase in October.
After two consecutive months of below average MoM growth versus the relevant 2010-19 monthly average, CPI food at home price growth was 0.1% above its 2010-19 average in October. Nevertheless, the broader trend over the past several months continues to suggest that growth rates remain largely in-line with the historical average.
Somewhat more concerning, is the trend in CPI food away from home prices, which after seeing MoM growth bottom in comparison to the historical monthly average in July, has seen three consecutive months of accelerating relative MoM growth.
Therefore while it looked like CPI food away from home prices were set to return to historical average growth rates, it now appears as if relatively stronger MoM growth may continue for a while longer.
Shelter remains in a downtrend, but don’t expect quick disinflation
The CPI’s rent based measures both saw relatively softer MoM growth in October versus September, with RPR and OER both recording MoM growth that was around 0.2% above their respective historical averages in October.
While this remains materially elevated, it is well below the peak levels that were seen across much of 2022 and early in 2023.
While the shift that has occurred in underlying spot market rents has many readily anticipating a further material moderation in the CPI’s rent based measures, it’s likely to take significant additional time for price growth to return to its historical average.
The reason for this, is that for the same reason that the CPI’s rent based measures are lagging, they are also smoothed in nature, with that reason being that a majority of the underlying rental sample consists of fixed leases. With only a minority of fixed leases maturing in any given month, it thus takes a significant length of time for underlying spot market rental growth rates to be reflected in OER and RPR, whilst changes that do occur, do so in a gradual/smoothed manner.
While there is still some MoM volatility, the gradual nature of changes in price trends can better be seen when MoM growth in OER and RPR are viewed on a 3-month moving average basis.
While expected to continue decelerating, I currently expect MoM growth in OER and RPR to remain above their respective historical averages during 1H24.
Several services categories show signs of moderating, but overall services price growth remains above the historical average
Turning to services prices more broadly, CPI motor vehicle maintenance prices recorded MoM growth that was below their respective 2010-19 average for the 2nd consecutive month. The last time this occurred was in December 2021.
Should negative/relatively moderate growth be seen again in November, this would strongly suggest that a new trend of lower price growth is in place.
Also seeing below average MoM growth for the second consecutive month were CPI internet services prices. This comes after four consecutive months of relatively elevated MoM growth across May - August, including very high relative MoM growth in July and August.
As is the case with CPI motor vehicle maintenance prices, should negative/relatively more moderate growth be seen again in November, this would strongly suggest that a new trend of lower price growth is in place.
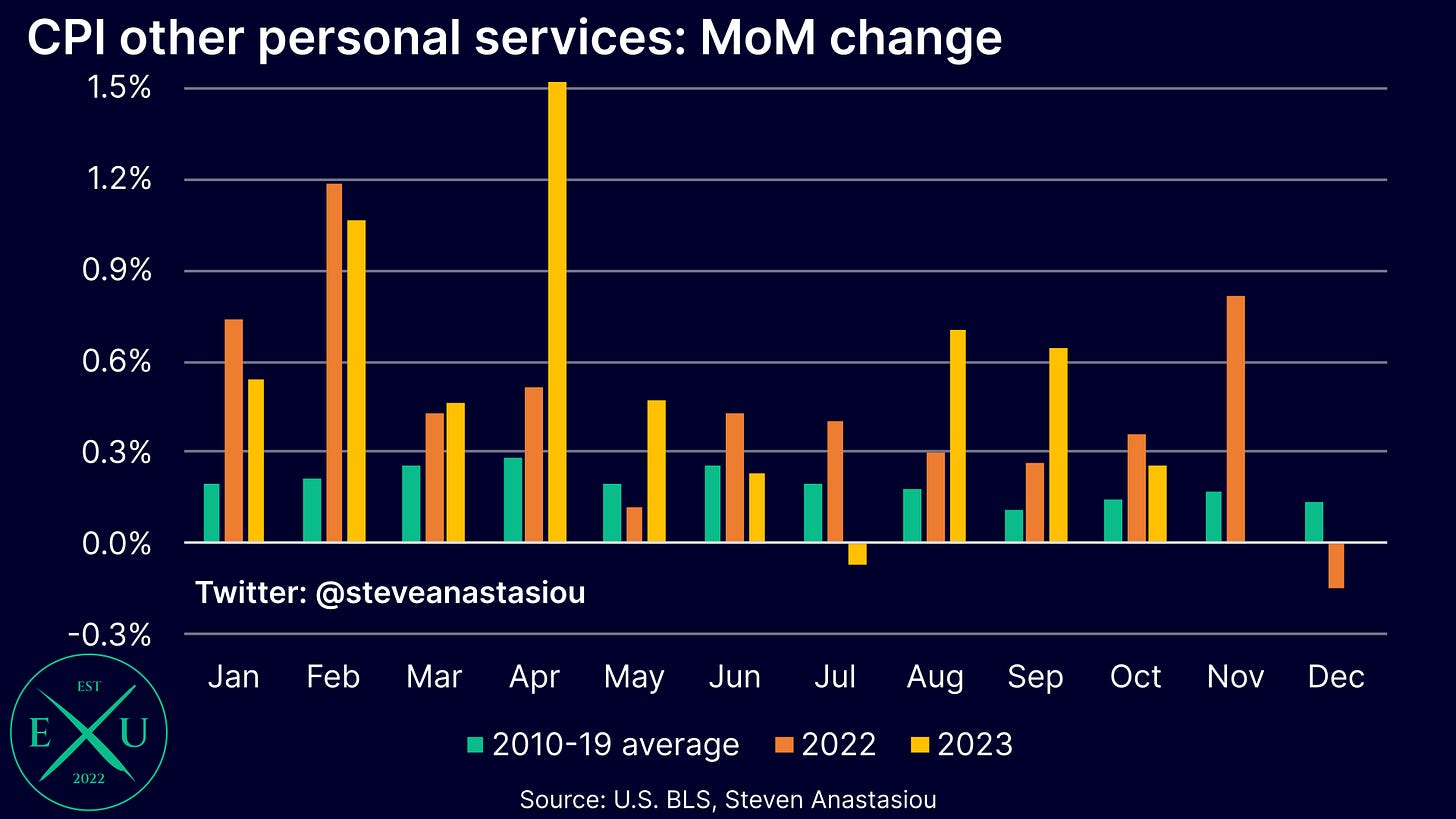
After recording very high relative growth in September, both CPI recreation services & CPI other personal services prices recorded negative/much more moderate MoM growth vs their respective 2010-19 MoM averages in October — though neither of these categories have established a clear downtrend in MoM growth, which remains volatile.
CPI recreation services prices were 0.01% below their respective 2010-19 average in October (vs +0.4% in September).
CPI other personal services prices were 0.1% above their respective 2010-19 average (vs 0.5% in September).
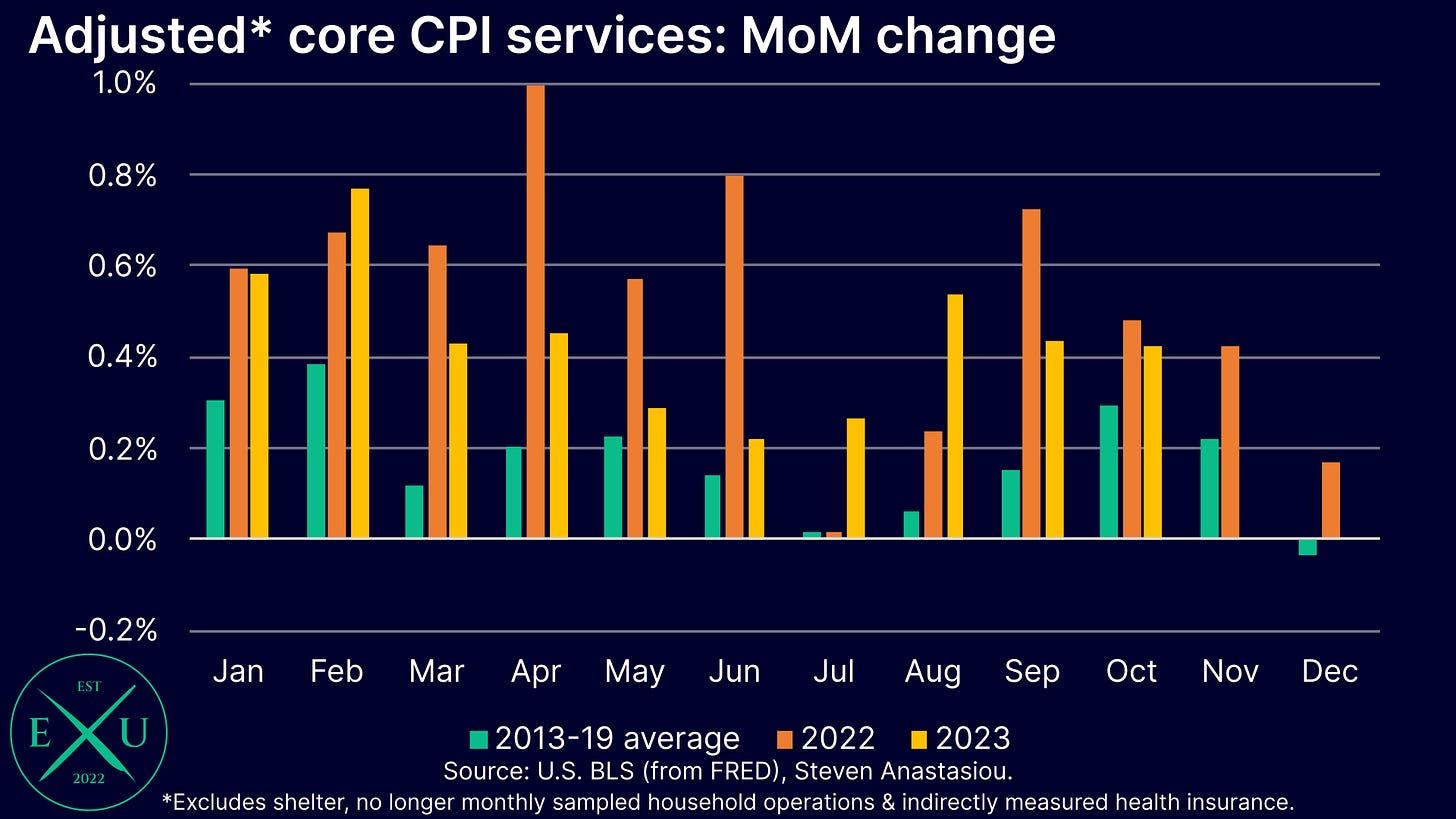
As a whole, adjusted core services price growth (i.e. excluding lagging shelter, indirectly measured health insurance & inconsistently measured household operations) moderated in October, but remained 0.1% above its 2013-19 average. This marks the 22nd consecutive month of above average MoM growth, highlighting how services prices have a ways to go before disinflating to historical average growth rates.
November flash forecasts
Currently expecting headline CPI growth of 3.2%, core CPI growth of 4.1%
In November, my provisional estimate for headline CPI growth is 3.2% YoY, unchanged from October.
For the core CPI, my provisional estimate is 4.1% YoY, up from 4.0% in October.
Summary
All in all, the latest CPI data reinforces the now long-standing disinflationary trend, but as it continues to be largely driven by durables prices (as opposed to services), the Fed is likely to remain cautious — although positive signs were seen in some services categories in October.
As outlined in my latest medium-term US CPI forecast, I continue to expect that a falling M2 money supply will lead to lower inflation & services price growth over time. Nevertheless, current trends continue to suggest that the return to 2% growth is likely to be gradual. My flash (provisional) CPI forecasts for November expect headline CPI growth of 3.2% (vs 3.2% in October), and core CPI growth of 4.1% (vs 4.0% in October).
I currently expect headline CPI inflation to fall <2% YoY in December 2024.
Thank you for reading my latest research piece — I hope that it provided you with significant value.
Should you have any questions, please feel free to leave them in the comments below!
In order to help support my independent economics research, please consider liking and sharing this post and spreading the word about Economics Uncovered. Your support is greatly appreciated and goes a long way to helping make Economics Uncovered a sustainable long-term venture that can continue to provide you with valuable economic insights for years to come.
If you haven’t already subscribed to Economics Uncovered, subscribe below so that you don’t miss an update.










as always super insightful!
Thank you very much for this interesting article.
Are you worried about second-round effects?