US CPI Review: December 2023
While slightly hotter than forecast, December's CPI report was largely in-line with my expectations, with an in-depth review of the latest inflation data pointing to further disinflation ahead.
Executive summary
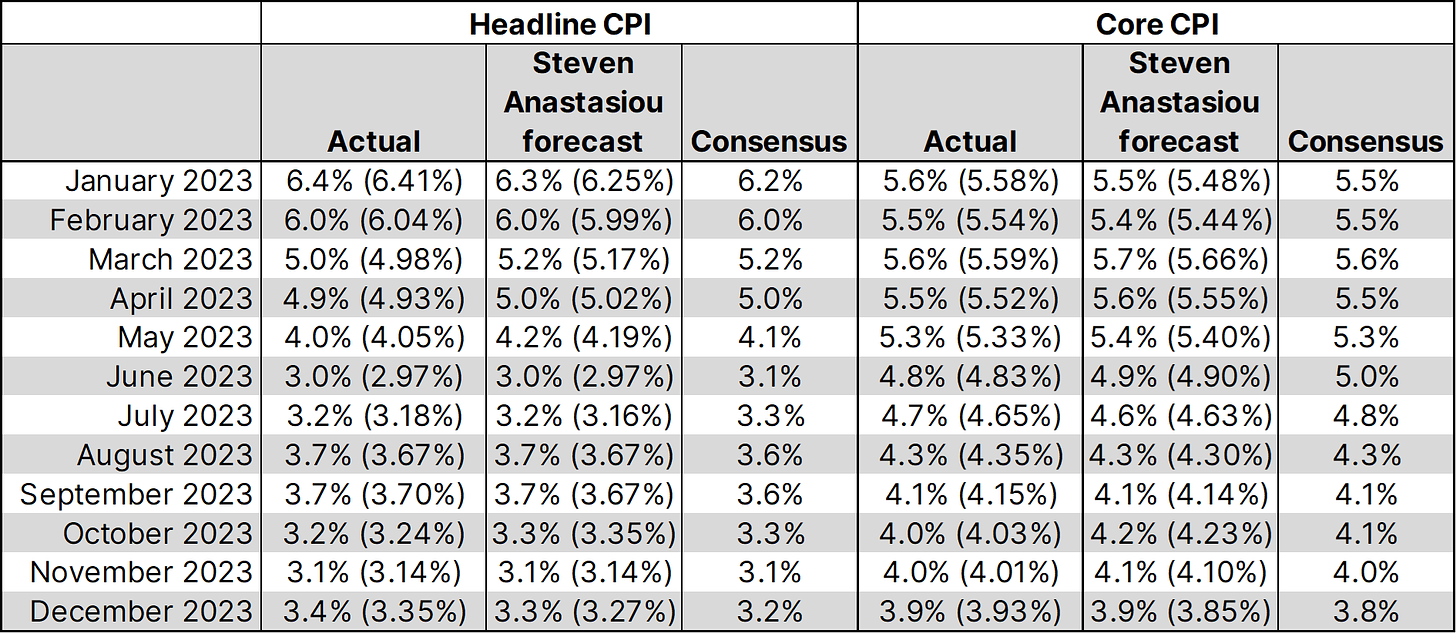
Headline and core CPI inflation came in slightly above my forecasts for December, and even further above the consensus forecasts, which had expected relatively softer growth versus my forecasts.
Nevertheless, a clear disinflationary trend remains, with the actual results not materially different to my forecasts (8bp variation for both headline and core CPI growth).
Important points to note include:
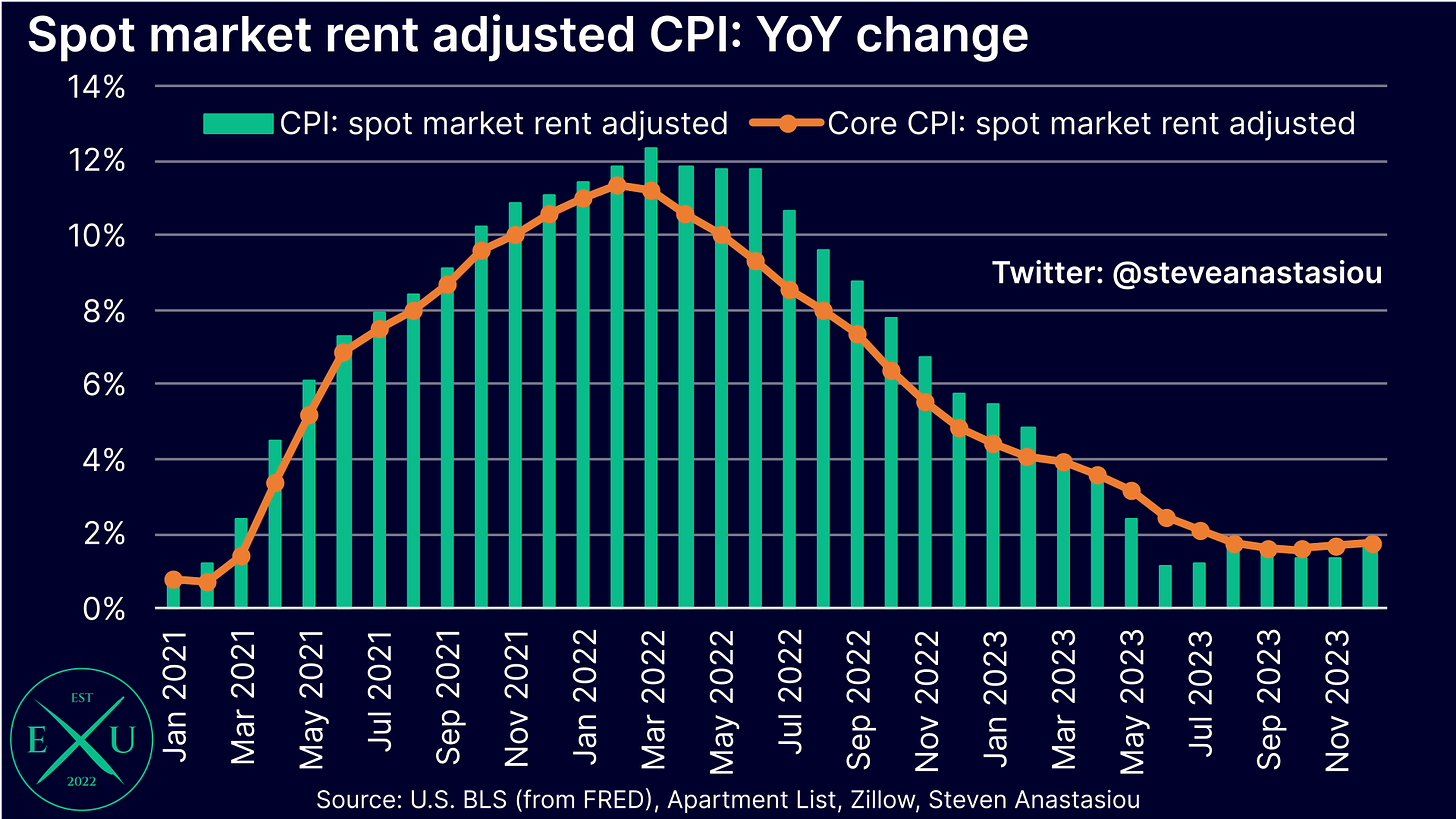
Spot market rent adjusted headline and core CPI inflation both remained below 2% YoY, as expected.
The slightly stronger relative MoM growth in December follows several consecutive months of relatively modest MoM core CPI growth and below average supercore (i.e. excluding lagging shelter) CPI growth.
Durables prices continue to record material MoM declines, as prior weakness in used car prices spreads to new car prices.
Wholesale price trends point to further material declines in used car prices over the months ahead.
Rent based measures continue to record a gradual deceleration in MoM growth.
While some services price categories saw a reacceleration of growth in December, others saw a strengthening of disinflationary trends.
With durables prices once again recording outright deflation, and nondurables price growth just 1.8% YoY, lagging services prices remain the only outstanding driver of inflation.
Breaking down the drivers of services price growth shows that only two services components are primarily responsible for persistently elevated growth, with other services components already disinflated, or having at least shown some initial signs of disinflating.
Inflation comes in slightly hotter than my forecast, but not materially so
Both headline and core CPI inflation came in slightly hotter than my forecasts on a two decimal place basis in December.
Headline CPI growth rose from 3.1% in November, to 3.4% (3.35%). This compares to my forecast of 3.3% (3.27%) and a consensus forecast of 3.2%. As outlined in my US CPI Preview, this increase was driven by base effects associated with the cycling out of the very large MoM decline (-12.4%) in the CPI energy commodities index in December 2022.
As expected, core CPI growth recorded a ninth consecutive monthly decline to 3.9% (3.93%). This was in-line with my forecast to one decimal place (3.9%), but slightly above my forecast to two decimal places (3.85%). Again, the consensus estimate was further afield, at 3.8%.
Spot market rent adjusted measures remain <2% YoY
Both headline and core CPI inflation remained below 2% YoY on a spot market rent adjusted basis.
The headline CPI adjusted for spot market rents saw growth of 1.6% (up from 1.3% in November), while the core CPI adjusted for spot market rents saw growth of 1.8% (up from 1.7% in November). Both of these results were in-line with my forecasts as outlined in my US CPI Preview.
This marks the seventh consecutive month that headline CPI growth adjusted for spot market rents has been below 2% YoY. For the core CPI, it has been below 2% YoY for five consecutive months.
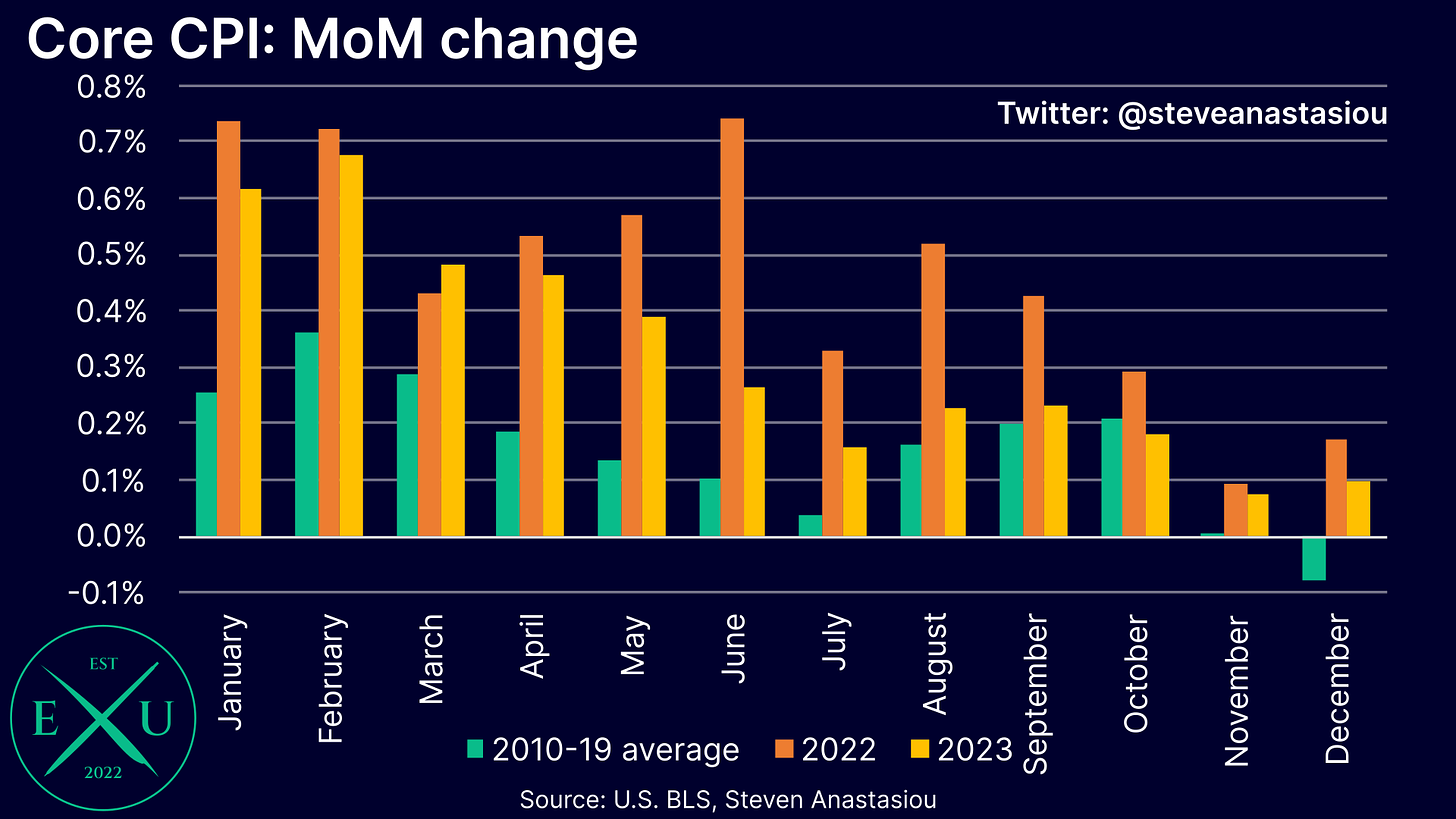
Monthly core CPI growth comes in above its historical average
Given that core CPI growth came in slightly hotter than I had expected, monthly growth was notably above its 2010-19 December average (0.10% vs -0.08% average).
Despite the increase, growth was not hugely above its historical average (0.18%), and this month of relatively higher growth follows four consecutive months of relatively modest growth. The broader trend thus remains one of disinflation.
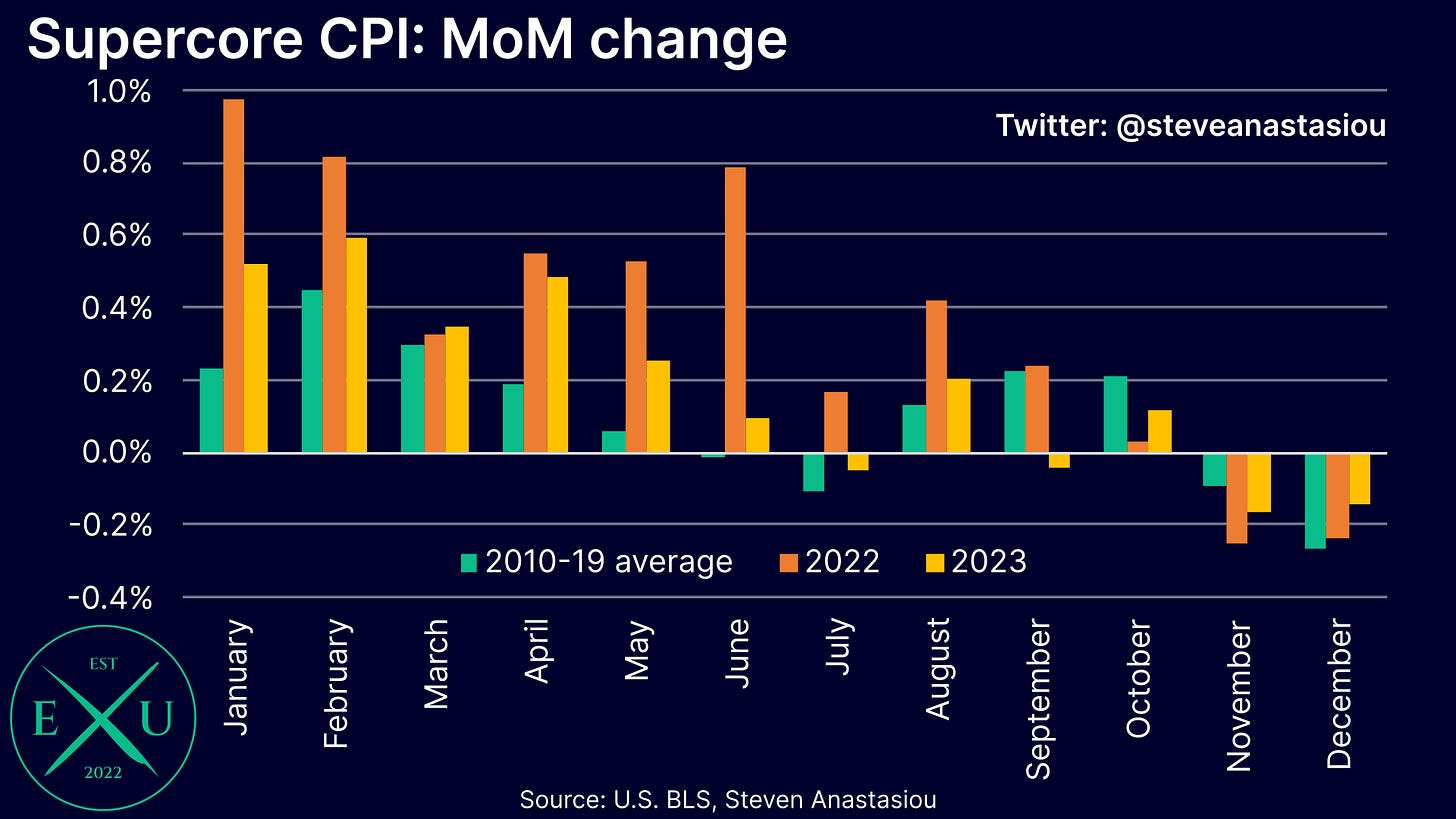
Monthly supercore CPI growth also above its historical average, but the broader trend shows a normalisation of price growth
Monthly supercore CPI growth (i.e. core CPI growth excluding lagging shelter costs), was also above its historical average, but given its exclusion of lagging shelter costs, less significantly, with MoM growth 0.12% above its historical December average.
Given that this month of relatively stronger growth follows three consecutive months of below average MoM growth, the broader trend is not only one of disinflation, but a normalisation of price growth.
Breaking down the details
Durables prices see another material fall as new vehicle prices see major weakness
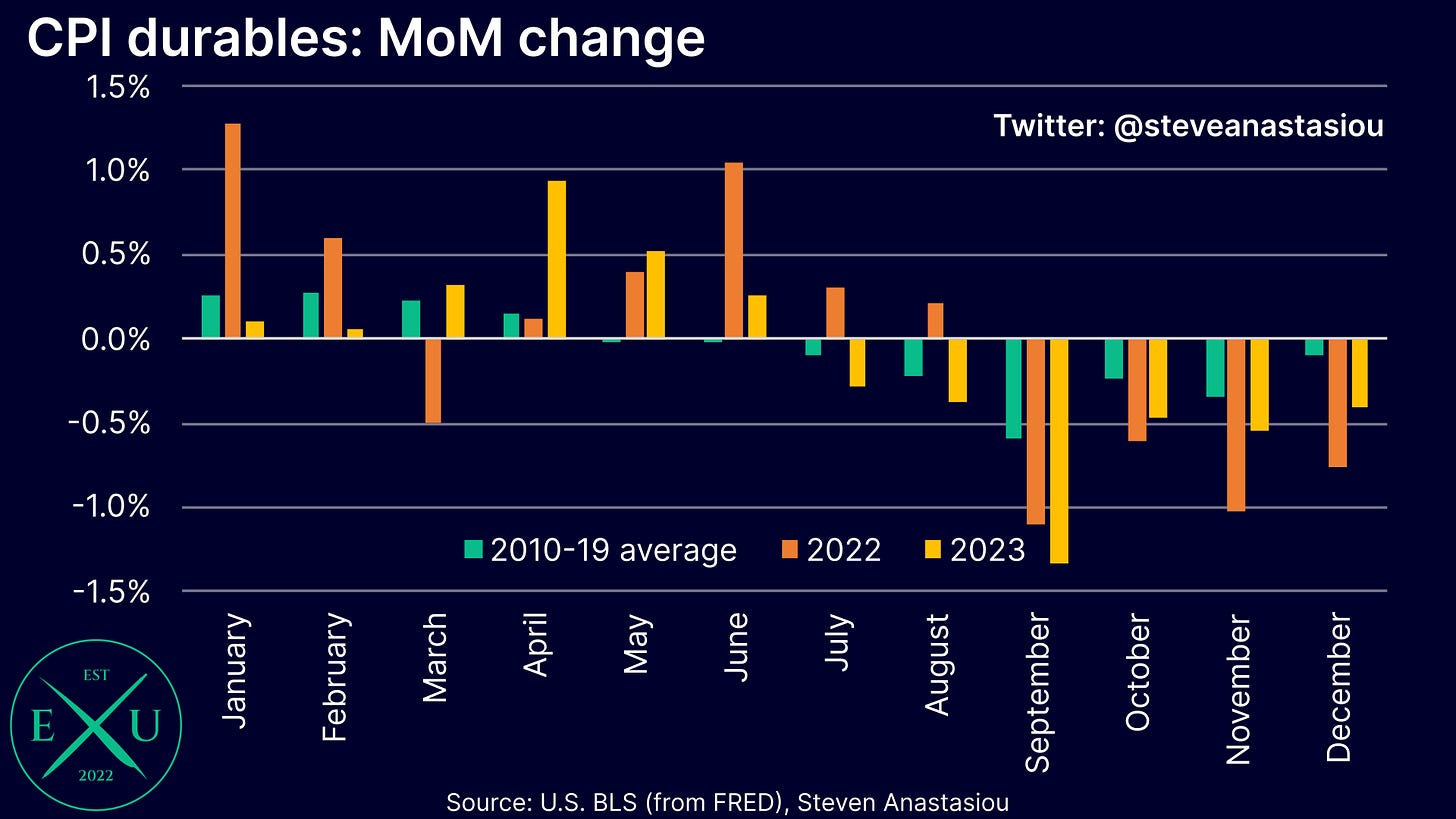
For the sixth consecutive month durables prices recorded a MoM decline that was greater than its historical average.
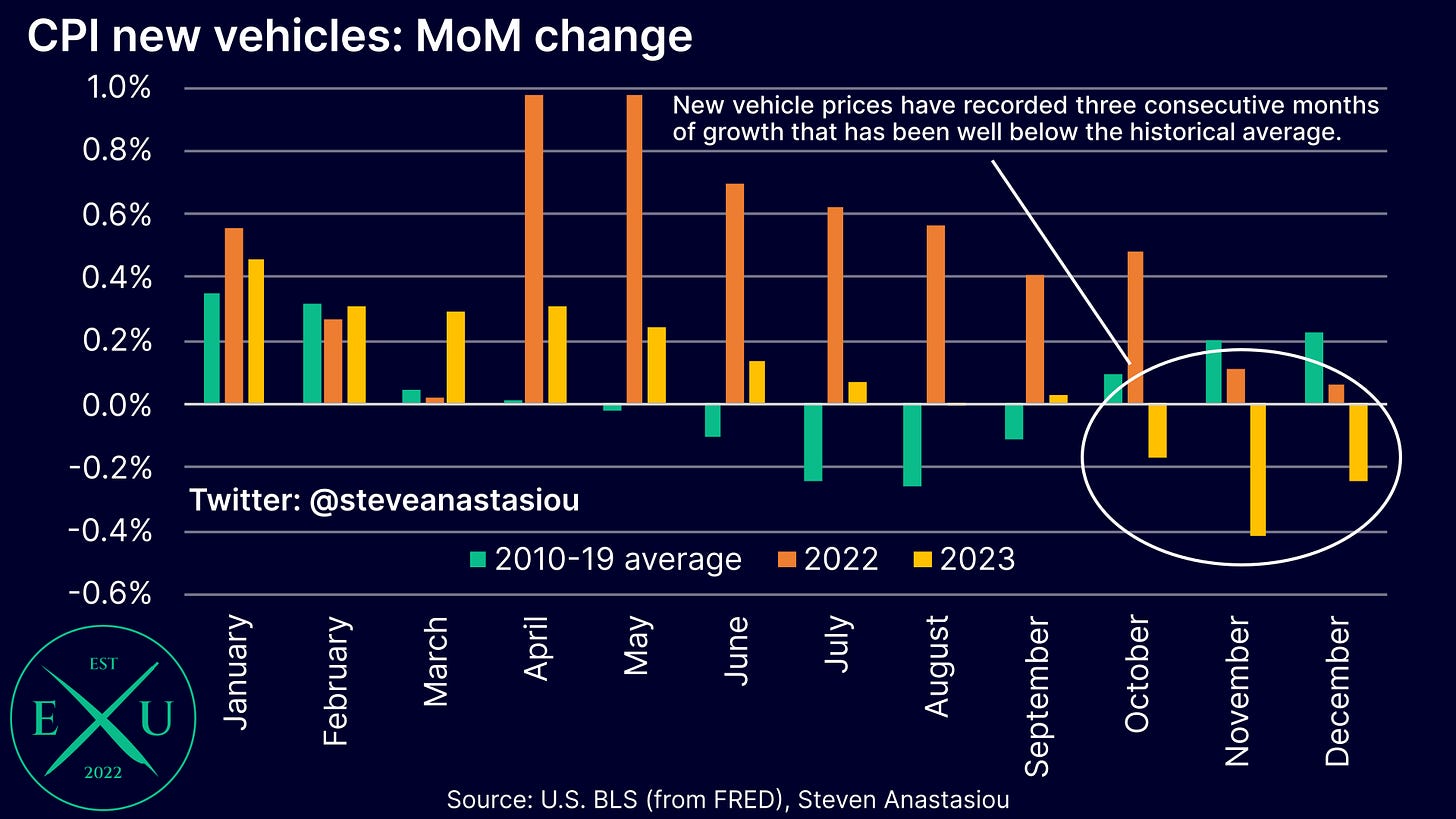
While the ongoing weakness in durables prices was expected to be driven by used car prices in December, it was instead driven by another decline in new vehicle prices, which fell for a third consecutive month.
The last three months have established a trend of major price weakness, with MoM growth an average of 0.45% below its respective historical average over the past three months.
Further downward durables price pressure likely lies ahead as resilience in used car prices is unlikely to hold
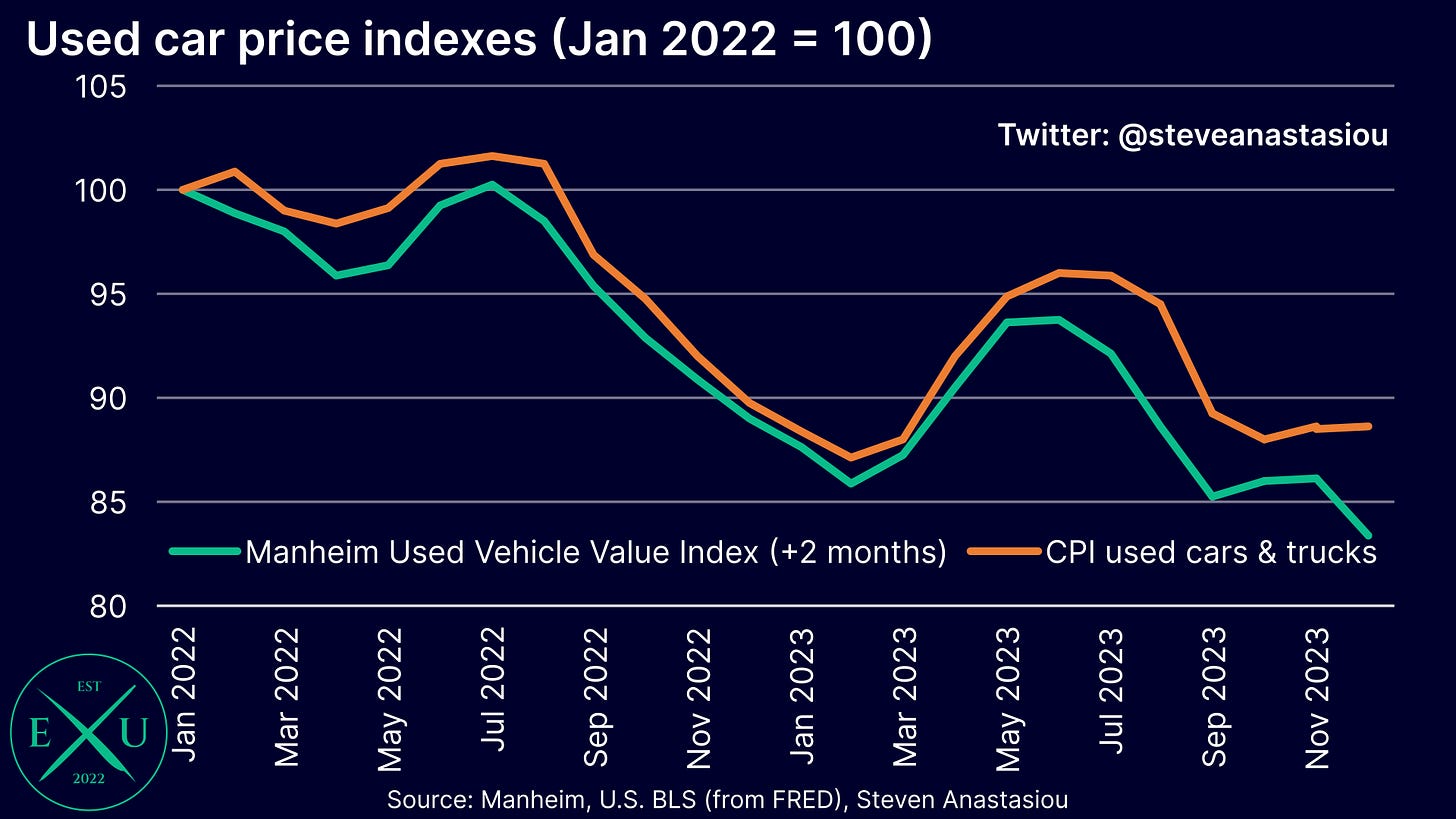
With new vehicle prices now recording significant declines, shifts in wholesale used car prices suggests that additional deflationary price pressures are likely to emerge over the months ahead.
Over the past three months, wholesale used car prices (as measured by Manheim) have fallen by 7.8%.
Given that the CPI’s used car & truck index has historically been highly correlated to retail prices on a two-month lagged basis, this implied a change of -3.1% for retail used car prices in December.
While retail prices tend to typically be relatively stronger in December (+0.8% vs a two-month lag of wholesale prices across 2010-2022), CPI used car & truck prices saw far greater relative strength than usual, rising by 0.1% MoM.
This has resulted in another major gap opening up between retail and wholesale used car prices. Given the ongoing weakness in wholesale used car prices, and the shift to material declines in new car prices (which indicates a broadening of automotive price weakness), I expect this gap to materially converge overtime, which would be expected to provide significant additional support for ongoing durables price deflation.
Energy commodities see a moderation in their YoY decline, leading to base effect pressure on the headline CPI
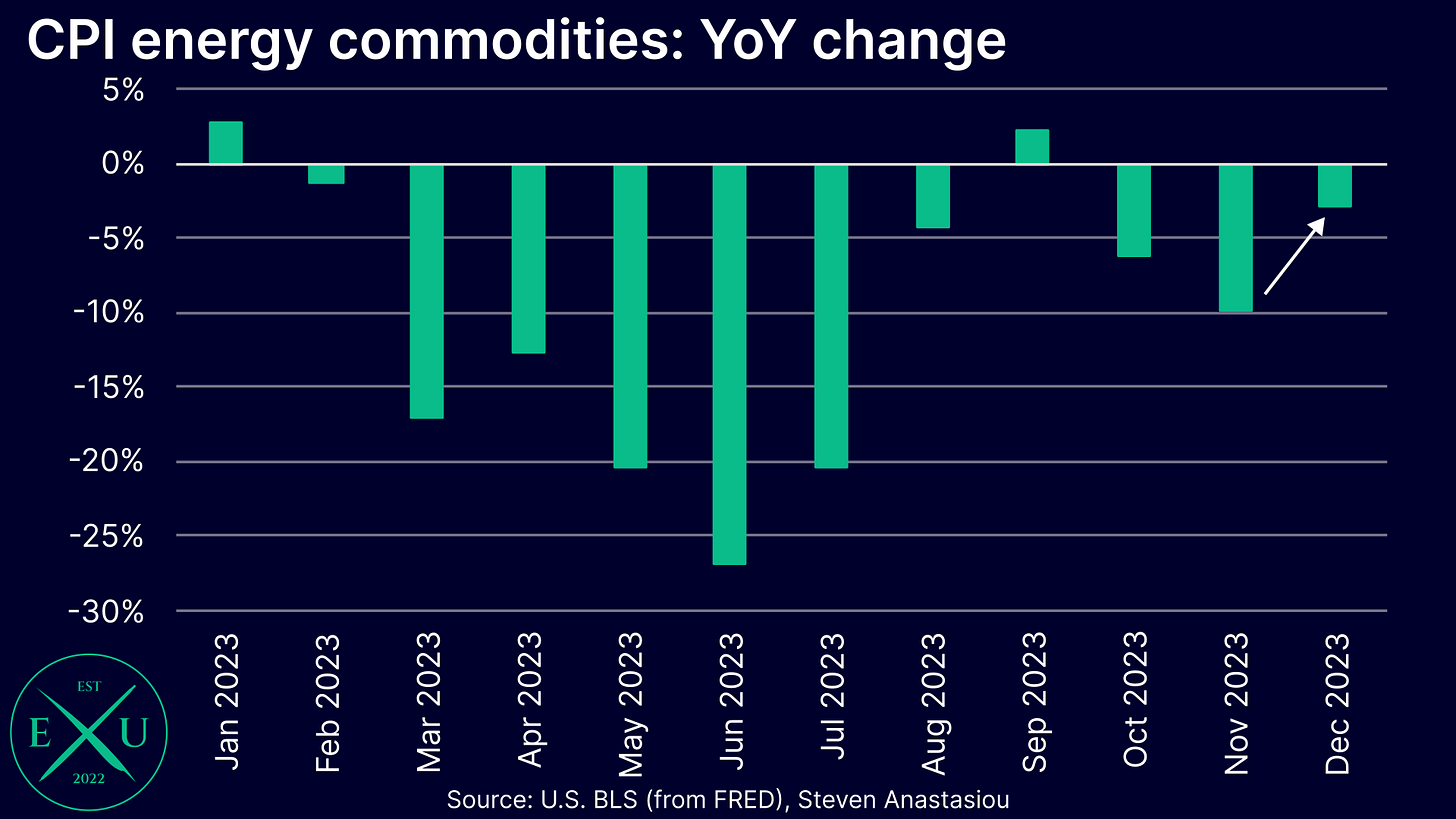
As outlined in my US CPI Preview, I had expected the headline CPI to record a significant decrease in the pace of its YoY decline on account of base effects in the CPI’s energy commodities index.
This came as a result of the very large MoM decline in the CPI energy commodities index of -12.4% in December 2022, being replaced with a still large, but much smaller decline of 5.7% in December 2023.
As a result, the YoY change of -9.8% in November, moderated to -2.9% in December.
Rent based measures decelerate slightly
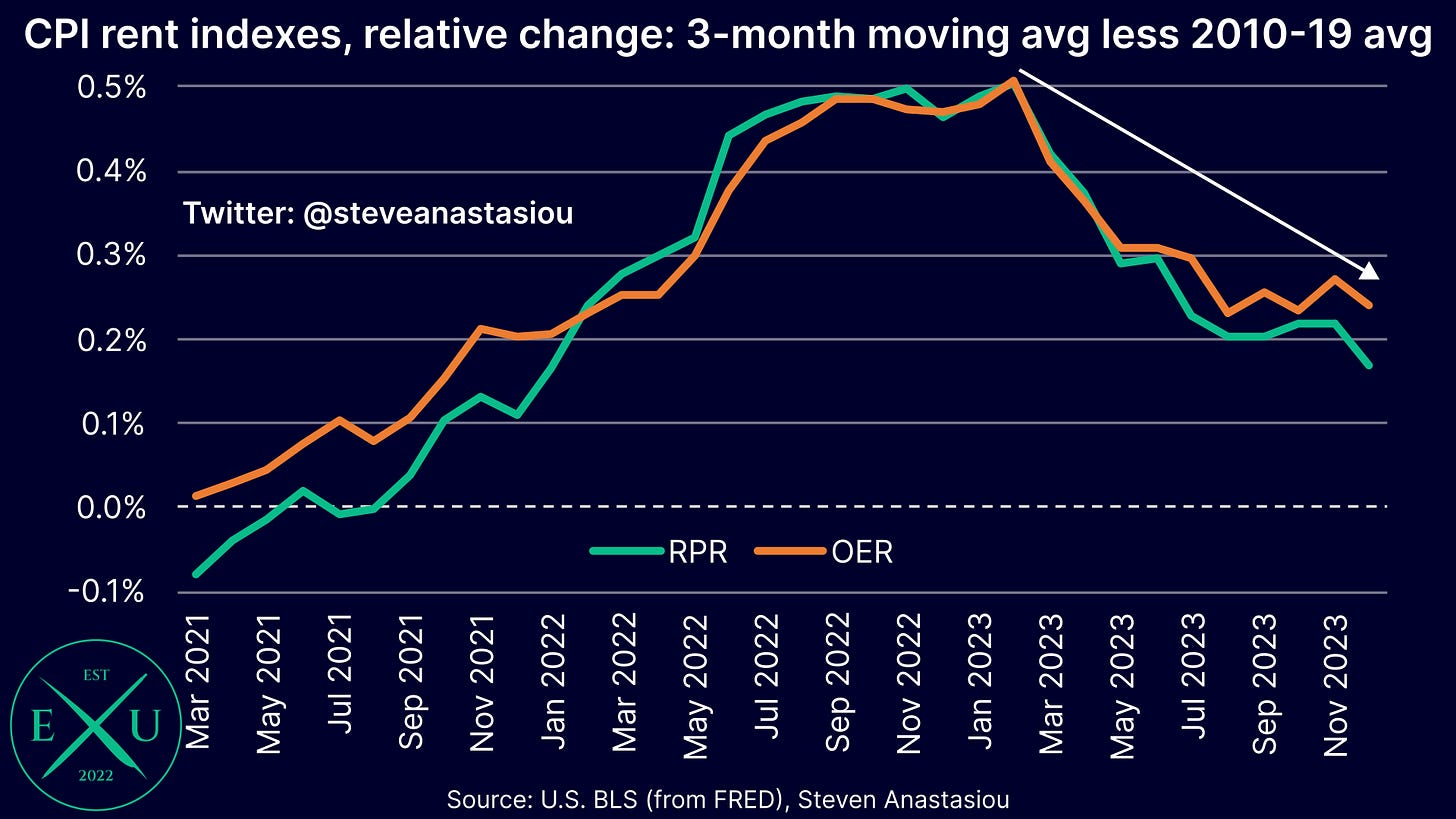
As I continue to outline, while spot market rental prices have been disinflating for well over a year, the moderation in the CPI’s rent based measures is likely to be gradual, as a result of the inherent nature of how owners' equivalent rent (OER) and rent of primary residence (RPR) are calculated.
Further evidence of this gradual moderation was seen in December, with both OER and RPR seeing a modest downshift in their relative MoM growth on a 3-month moving average basis.
While OER’s MoM growth was in-line with my forecast, RPR saw a slightly stronger deceleration. I continue to expect both measures to record growth that is above their respective historical averages over the next several months, but to continue decelerating.
Mixed signs seen in other services categories
Looking now at some other services components, shows some mixed results.
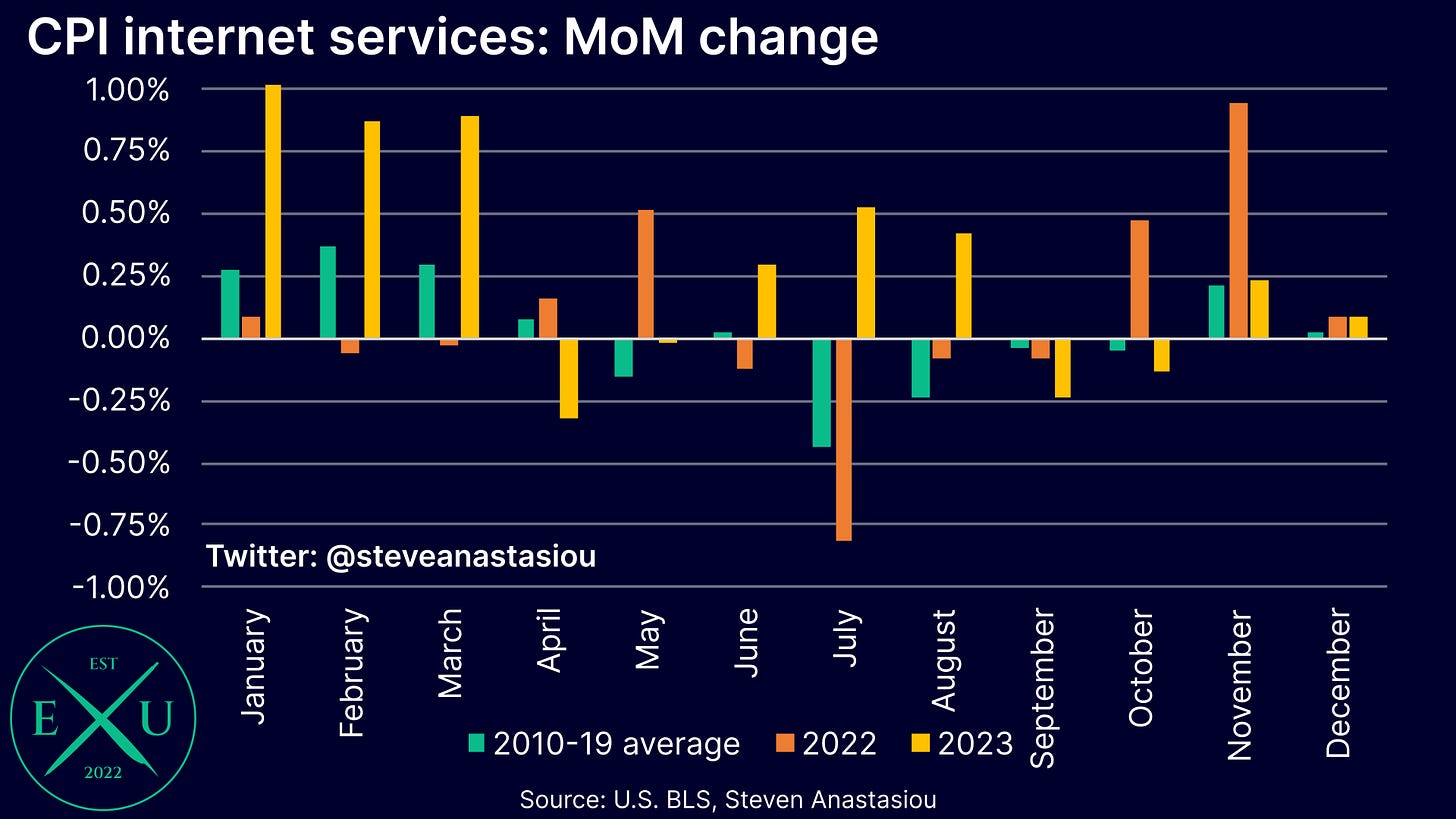
Internet services prices saw relatively moderate growth for a fourth consecutive month, providing further evidence that growth has largely normalised after a period of generally high relative MoM growth from October 2022 to August 2023.
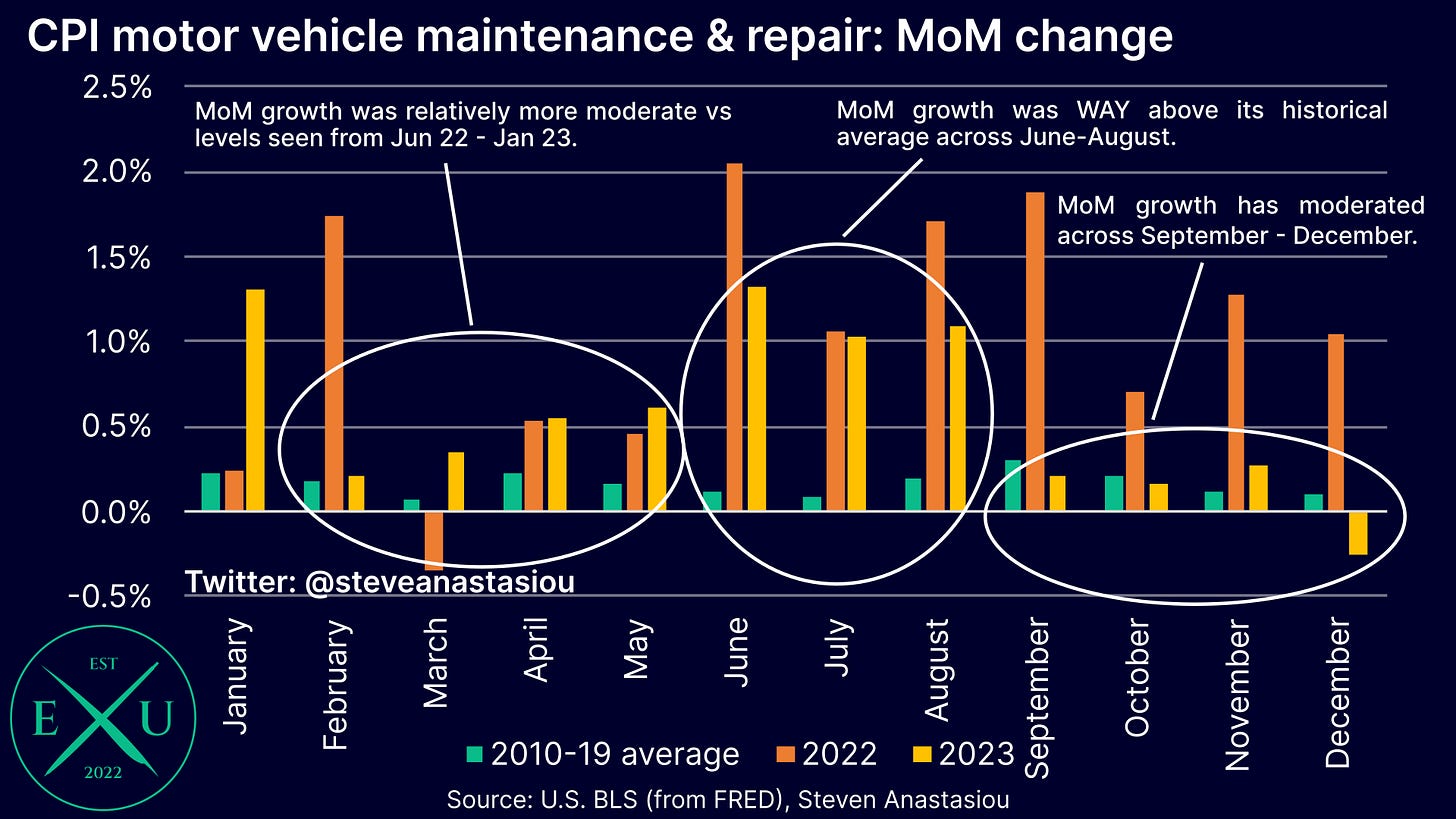
Furthermore, CPI motor vehicle maintenance & repair prices recorded a MoM decline for the first time since March 2022, providing further evidence that the long period of significantly elevated price growth is over.
This marked the third time in the past four months that MoM growth was below its historical average, which has seen annual price growth fall from a peak of 14.2% in January, to 7.1% in December.
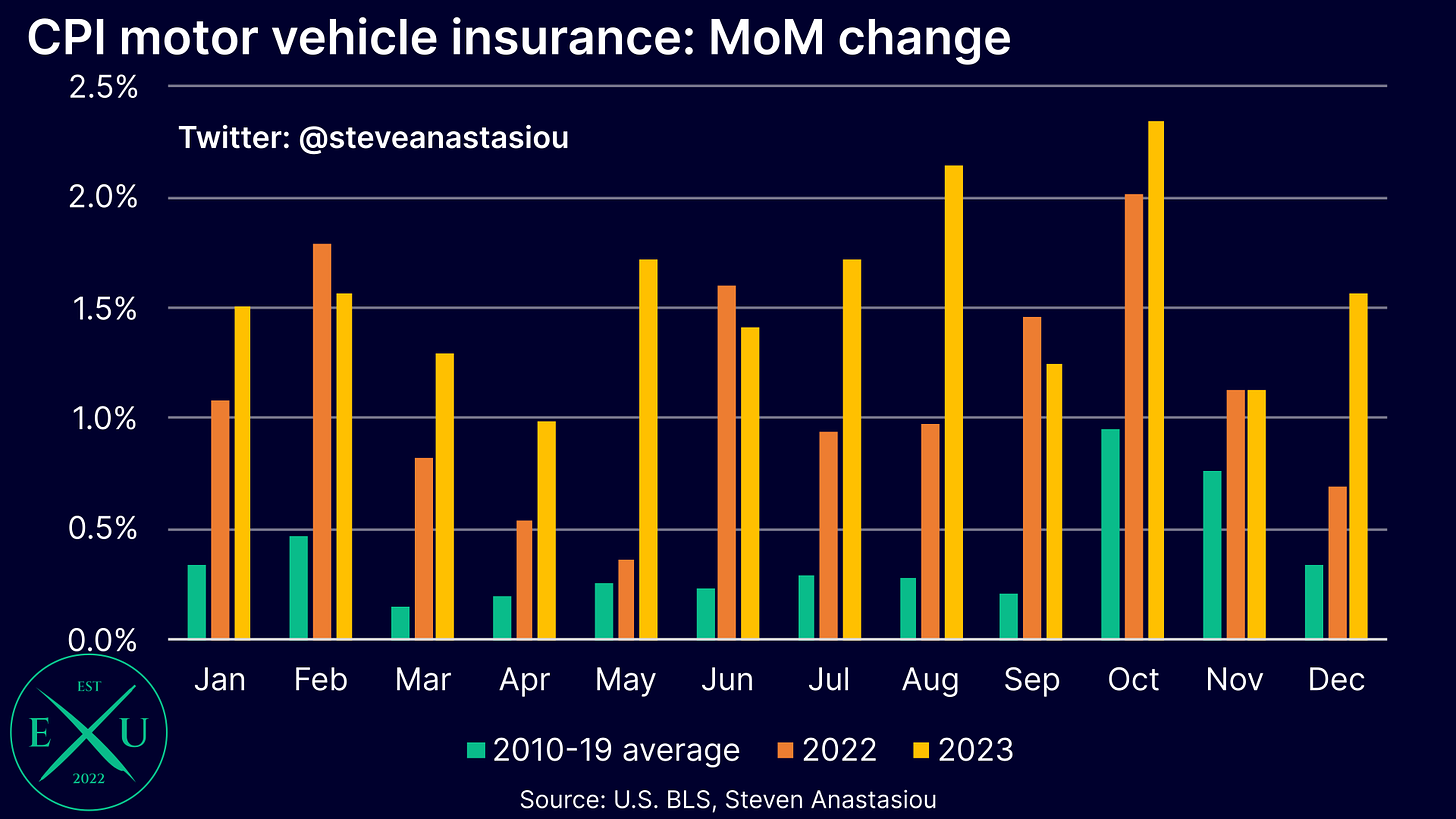
Though moving back in the other direction, was the CPI motor vehicle insurance category, which after seeing a month of relatively more modest price growth in November, once again saw extremely elevated price growth in December. This saw YoY growth rise to an enormous 20.3%.
While this category is yet to show any significant signs of disinflation, price growth should theoretically begin to moderate on the back of falling new and used car prices, and moderating growth in motor vehicle maintenance & repair costs.
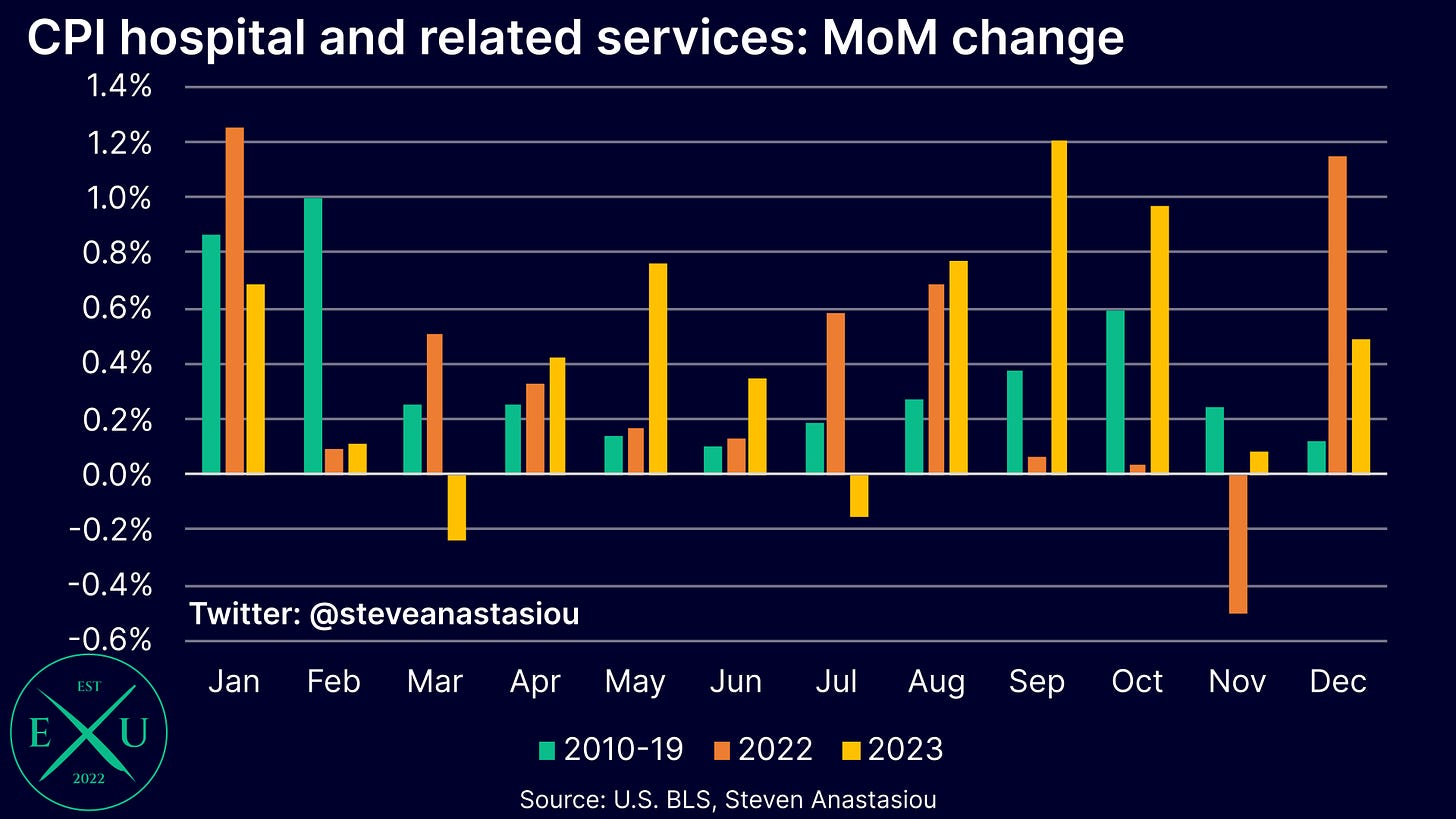
Another category that continued to see relatively high MoM growth was the CPI hospital and related services category. While not seeing growth as enormous as the CPI motor vehicle insurance category, at 5.6% YoY, it remains elevated versus its 2010-19 average of 4.3%. Recent price trends also suggest that YoY growth could rise further in 1Q24.
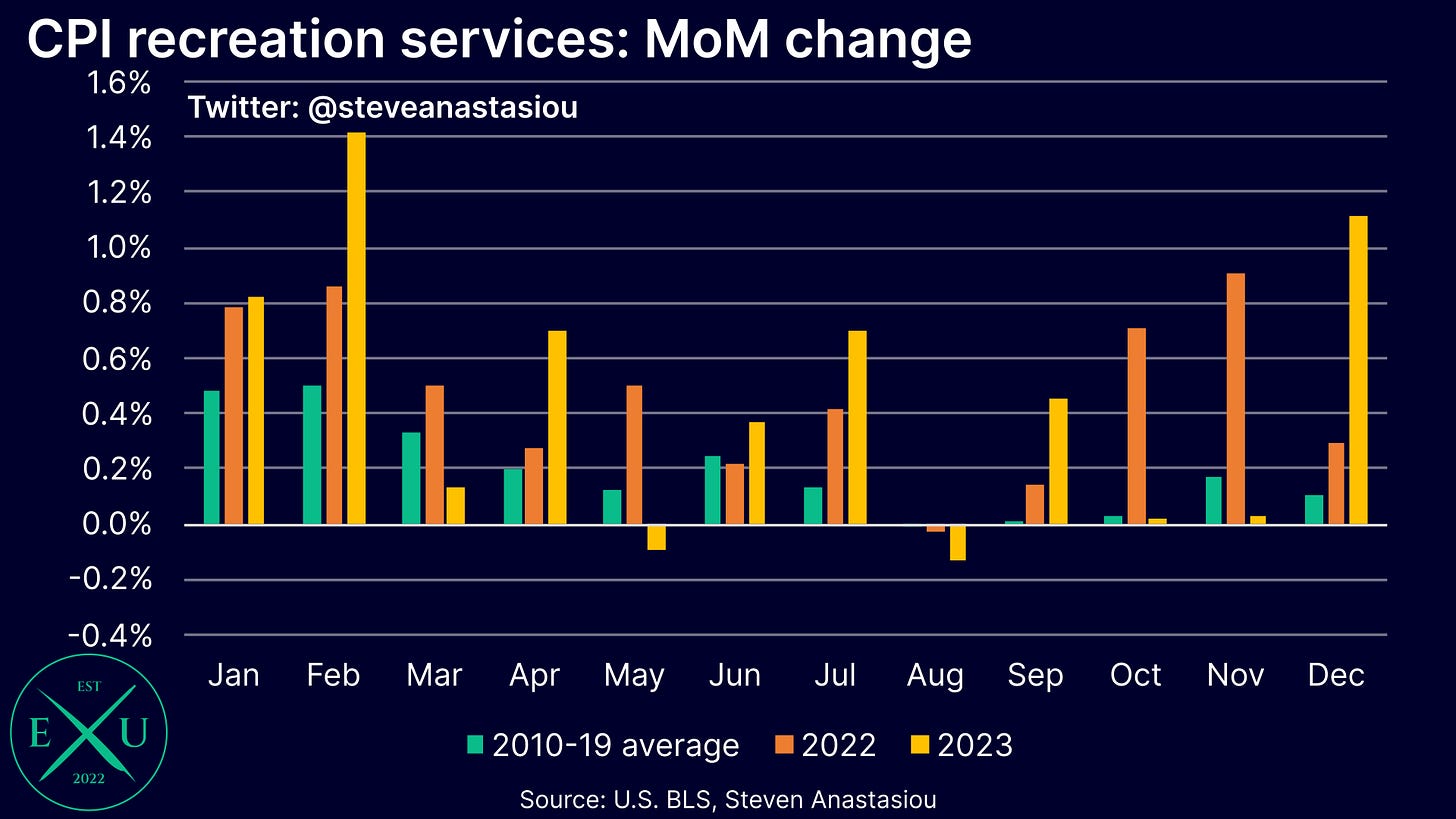
After recording relatively lower MoM price growth in three of the previous four months, the CPI recreation services category saw very strong growth in December, rising by 1.1% MoM. While previous data indicated that very high relative MoM growth may have been over, the latest data suggests that further time is needed for a normalisastion of price growth to occur.
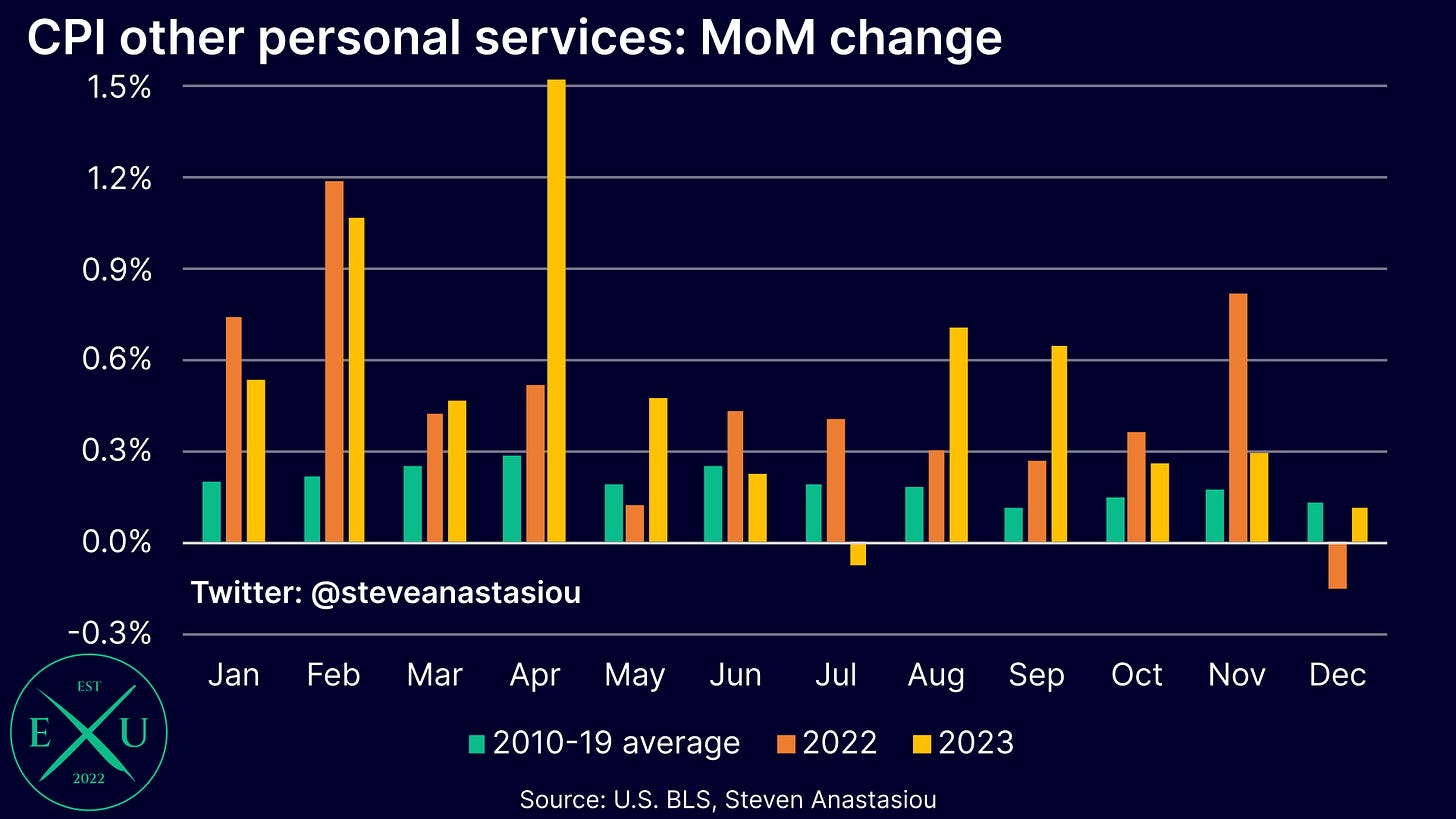
Though in contrast to the increase in price growth that was seen in CPI recreation services, the CPI other personal services category saw MoM growth that was below its historical average for the first time since July. It also marked three consecutive months of relatively more modest MoM growth.
All-in-all, inflation has broadly normalised
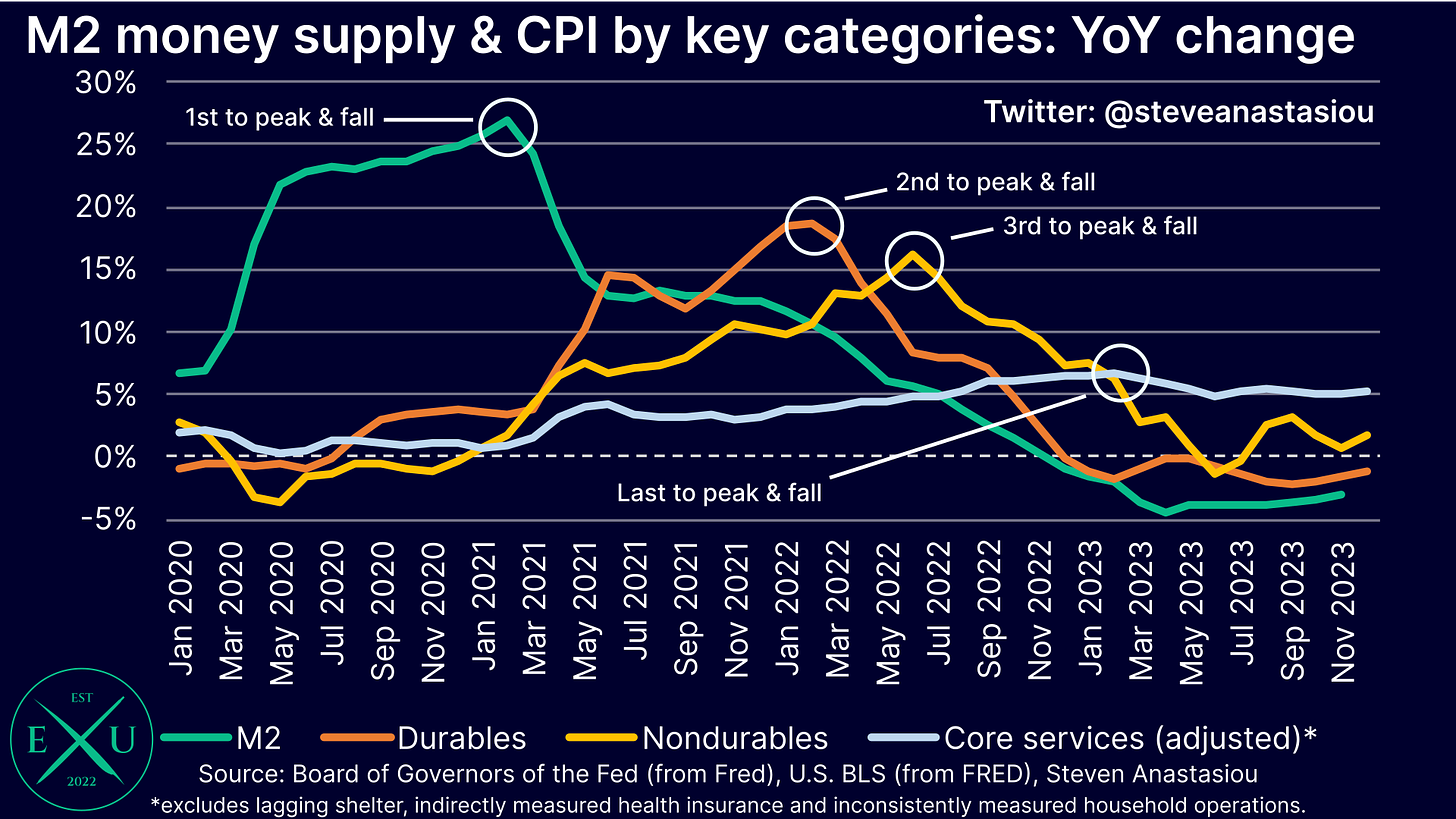
Looking at the CPI data as a whole, it’s clear that inflation pressures have materially dissipated. Given the ongoing decline in the M2 money supply, disinflationary pressure is also likely to intensify overtime.
Durables prices, which are subject to the most elastic demand and are the most responsive to changes in the M2 money supply, are back to recording persistent deflation, after being the first to rise in response to the initial increase in M2.
As noted above, trends in wholesale used car prices also suggest that deflationary pressure may increase over the months ahead.
Nondurables prices, which were the second most responsive to changes in M2 in the current cycle, have also disinflated, with YoY growth just 1.8% in December — furthermore, gasoline prices have so far recorded another MoM decline in January.
Services prices, being the most lagging component of the price equation, continue to record elevated YoY growth, with adjusted core services prices (i.e. excluding lagging shelter, indirectly measured health insurance and inconsistently measured household operations) rising by 5.2% YoY in December.
Though it’s important to remember that even most of the core services price categories have disinflated, or are showing signs of disinflating. The two key services categories that continue to show persistently elevated price pressures without any notable signs of disinflation, have been reduced to the CPI motor vehicle insurance and CPI hospital and related services categories. While the CPI recreation services and CPI other personal services categories continue to see some months of significantly elevated growth, they are also frequently recording months of relatively lower growth, providing signs that their price growth may begin to more materially disinflate at some point over the months ahead.
To illustrate this point, and the outsized influence of the 20.3% YoY increase in CPI motor vehicle insurance prices, excluding the transportation component from the adjusted core services category, shows that YoY growth was a much more modest 3.2% in December.
Thank you for reading my latest research piece. I will soon be releasing an update to my medium-term US CPI forecasts — stay tuned!
Should you have any questions, please feel free to leave them in the comments below!
In order to help support my independent economics research, please consider liking and sharing this post and spreading the word about Economics Uncovered. Your support is greatly appreciated and goes a long way to helping make Economics Uncovered a sustainable long-term venture, that can continue to provide you with valuable economic insights for years to come.
If you haven’t already subscribed to Economics Uncovered, subscribe below so that you don’t miss an update.


Thanks, interesting as always !
Love these breakdowns. 🙏🚀💯