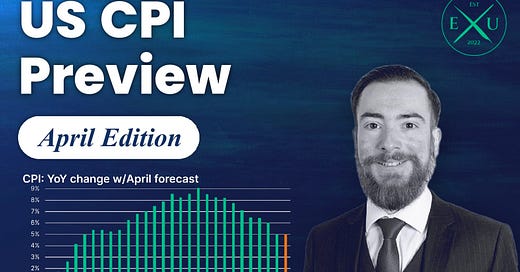
April US CPI preview: the potential for another inflation scare, but it could be one of the last
A potential pause in the CPI's disinflation may unnerve markets, but with it likely to fall sharply in May & June, April's report could be one of the last to do so for the current inflation cycle.
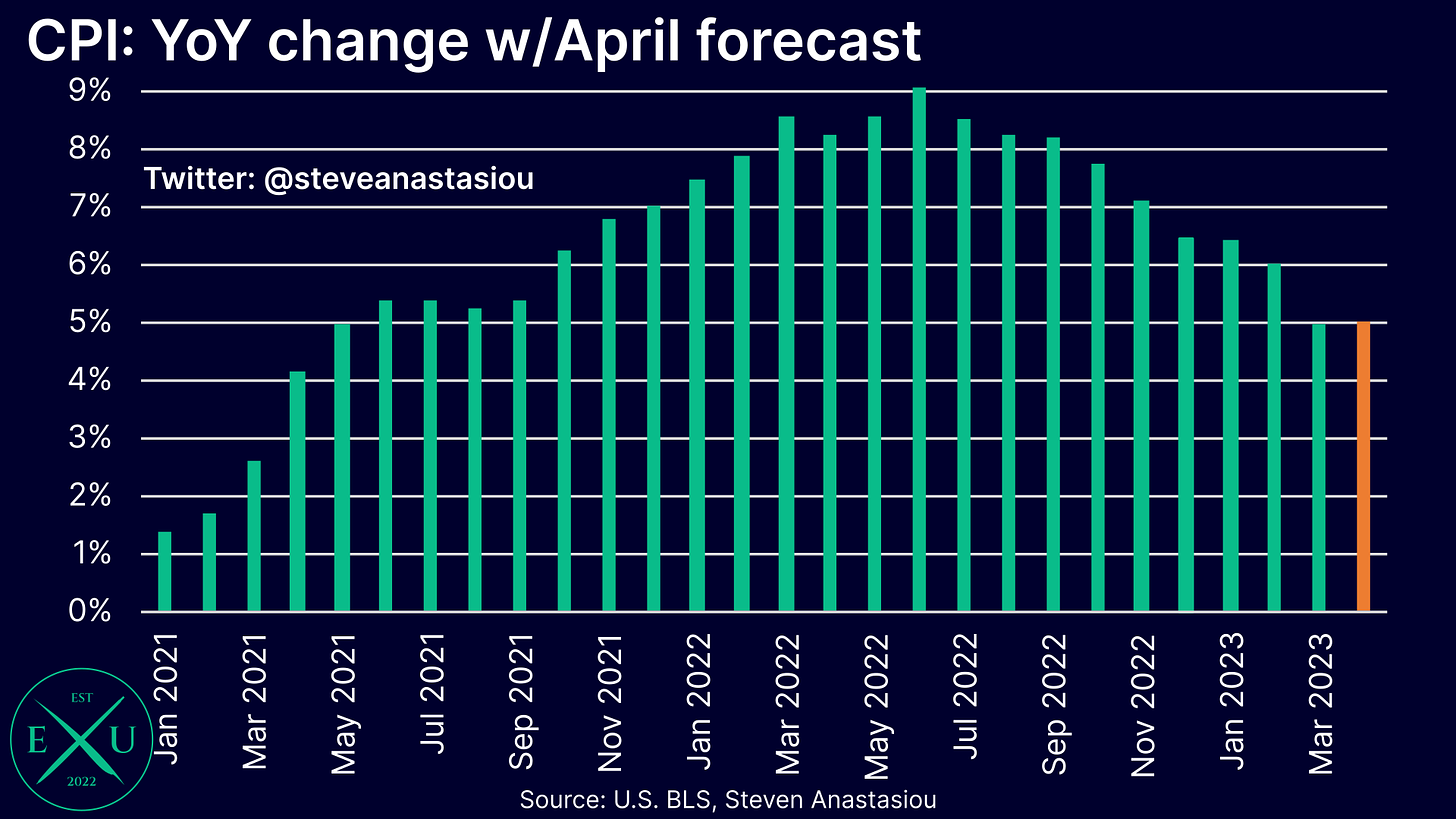
CPI and core CPI both expected to hold steady at 5.0% and 5.6% YoY respectively
In April, I forecast headline CPI growth of 5.0% — in-line with the rate recorded in March.
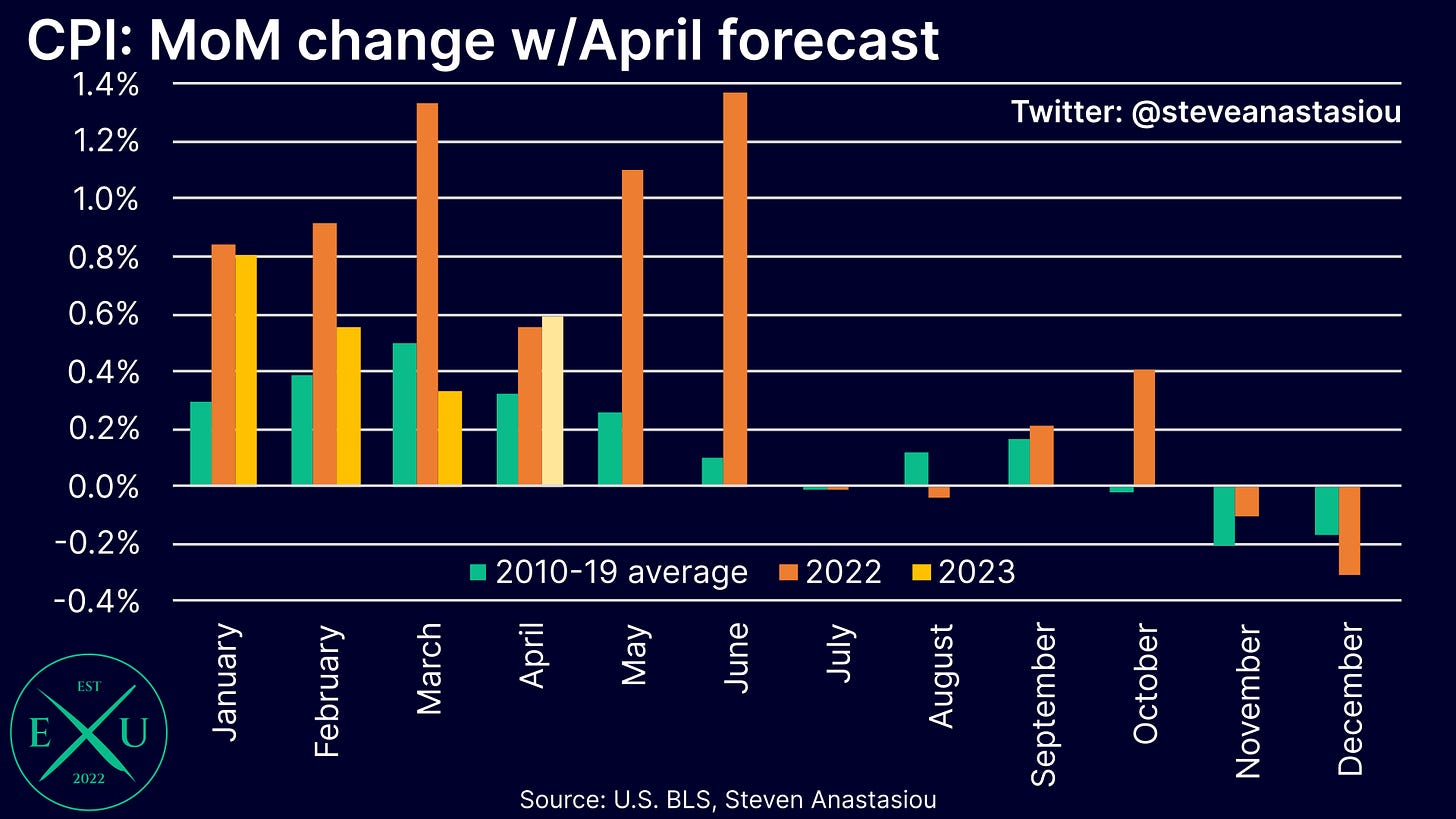
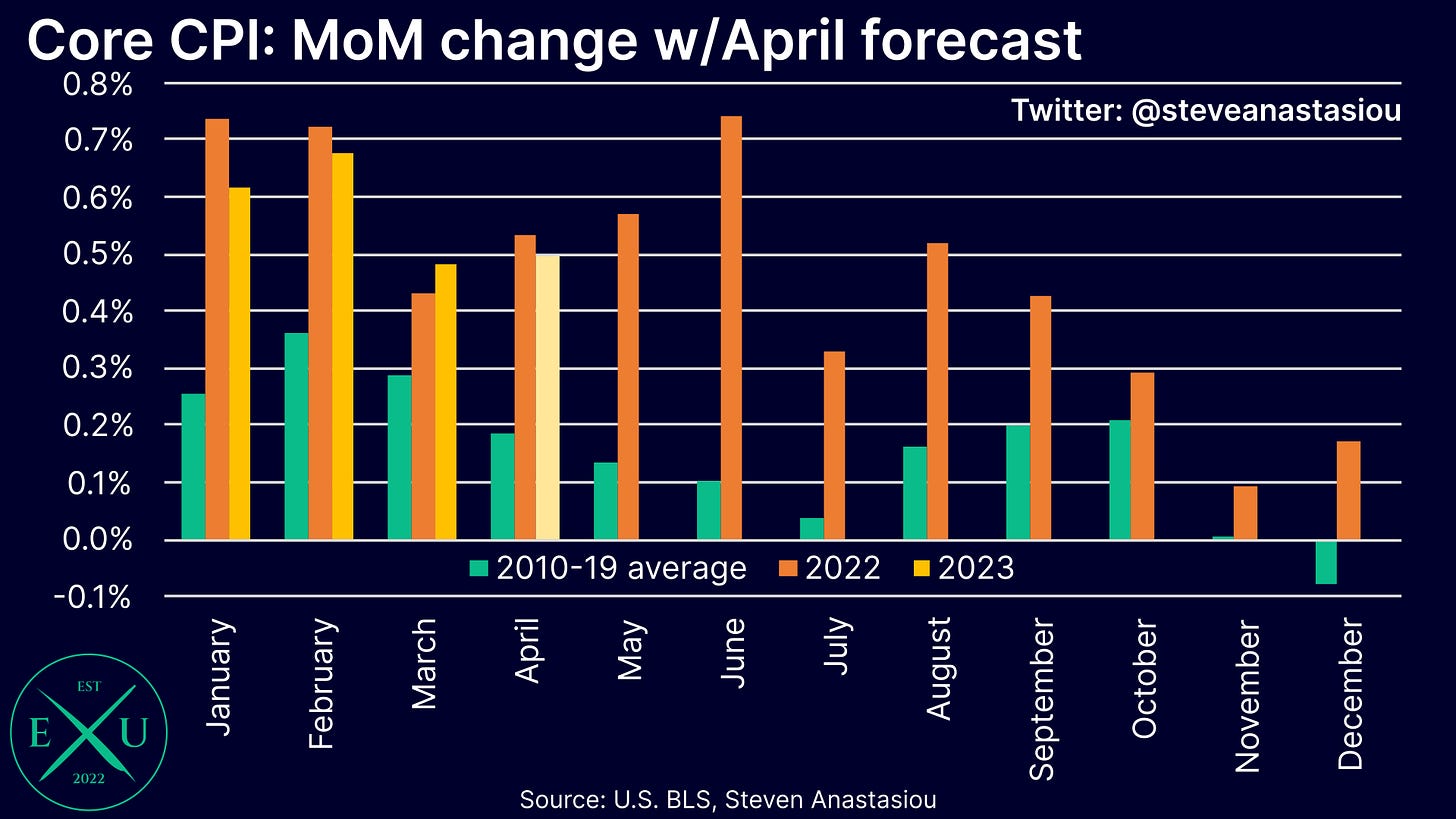
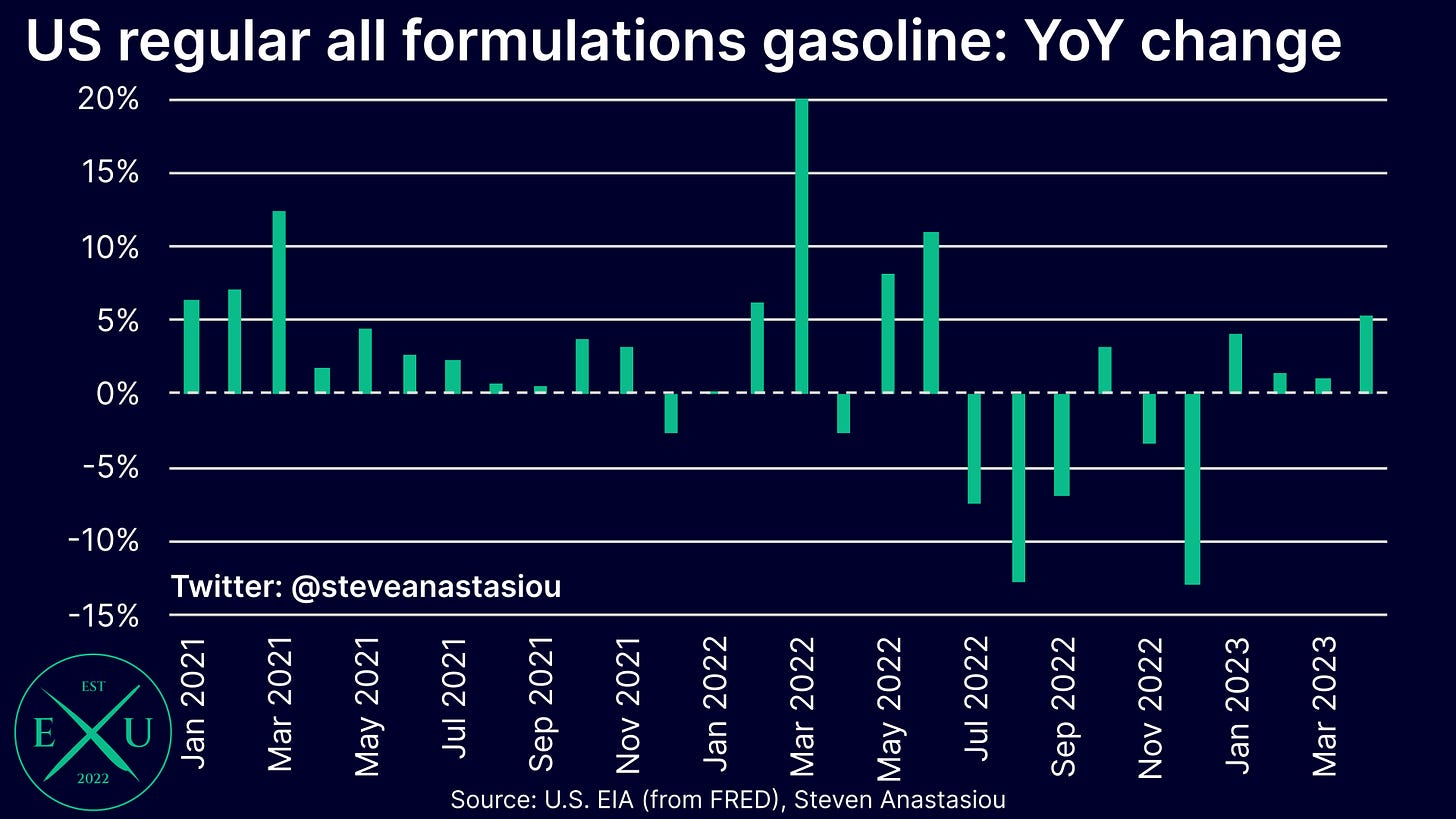
This comes on the back of expected MoM growth of 0.6%, which would represent another month of growth that is above its historical average. A big driver of this forecast is the expected increase in the CPI energy commodities component, after monthly average regular gasoline prices rose by 5.3% MoM.
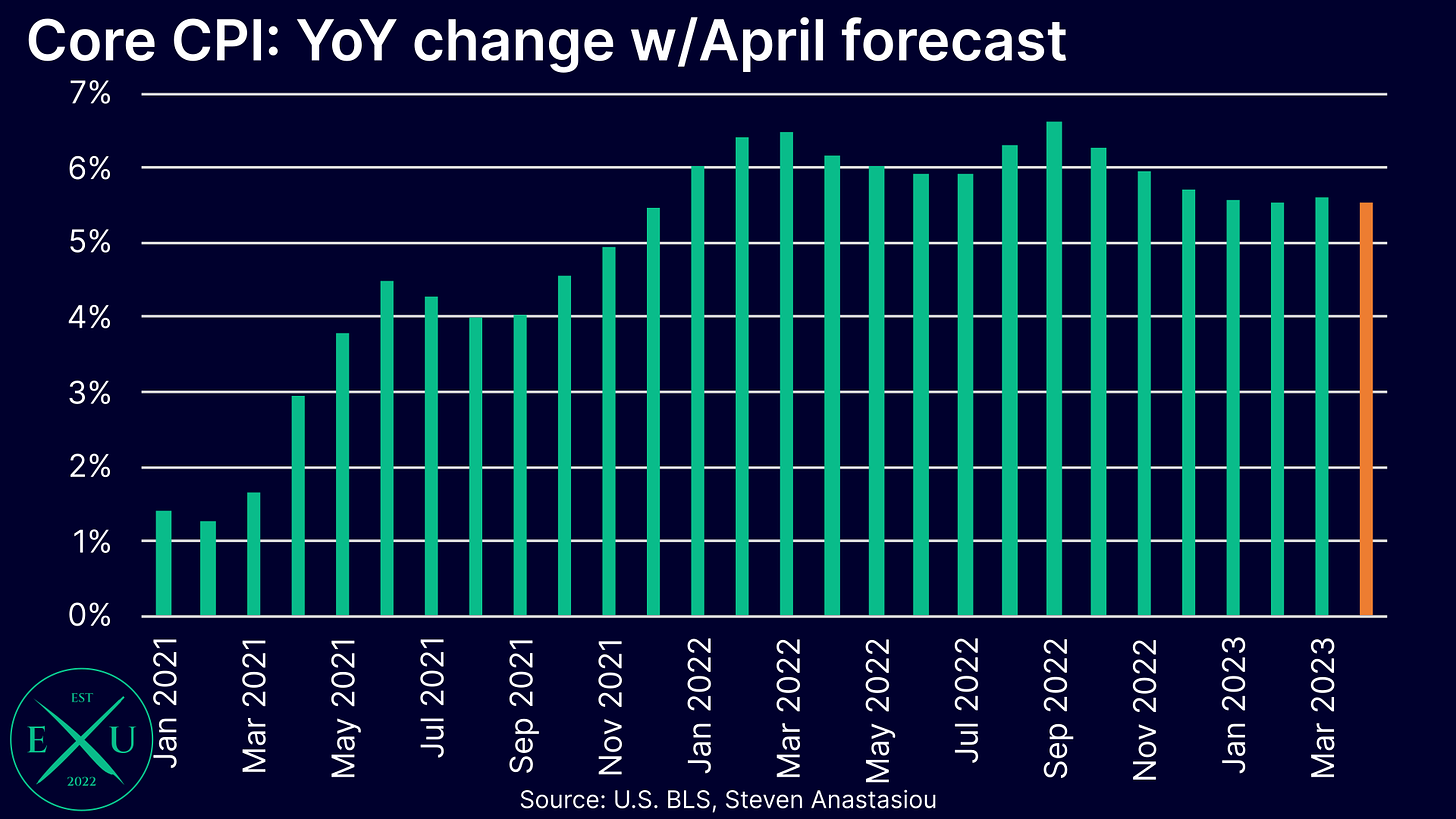
For the core CPI, I forecast YoY growth of 5.6%, which is also in-line with the rate recorded in March.
With the core CPI having a larger weighting to lagging services prices, including lagging rent based measures, MoM growth is again expected to be well above its historical average, at 0.5%.
The potential for the headline CPI to not moderate for the first time in 9 months & a hotter core CPI vs consensus, risks another bout of market nervousness
Should the headline CPI come in at 5.0% YoY (vs 5.0% consensus forecast), this would mark the first time in 9 months that CPI inflation didn’t see a MoM deceleration from the prior month, to one decimal point.
Furthermore, my core CPI forecast for YoY inflation of 5.6% is slightly above the market’s consensus expectation of 5.5%.
In the event that such a combination played out, it risks a hawkish recalibration of market expectations for the Fed’s future rate outlook and another bout of broader market nervousness.
Though with the CPI likely to moderate significantly in May & June, market concerns over inflation could taper materially
Though given that very high comparables are set to by cycled out of the YoY comparison in May and June, I expect the headline CPI to decelerate significantly over the next two months.
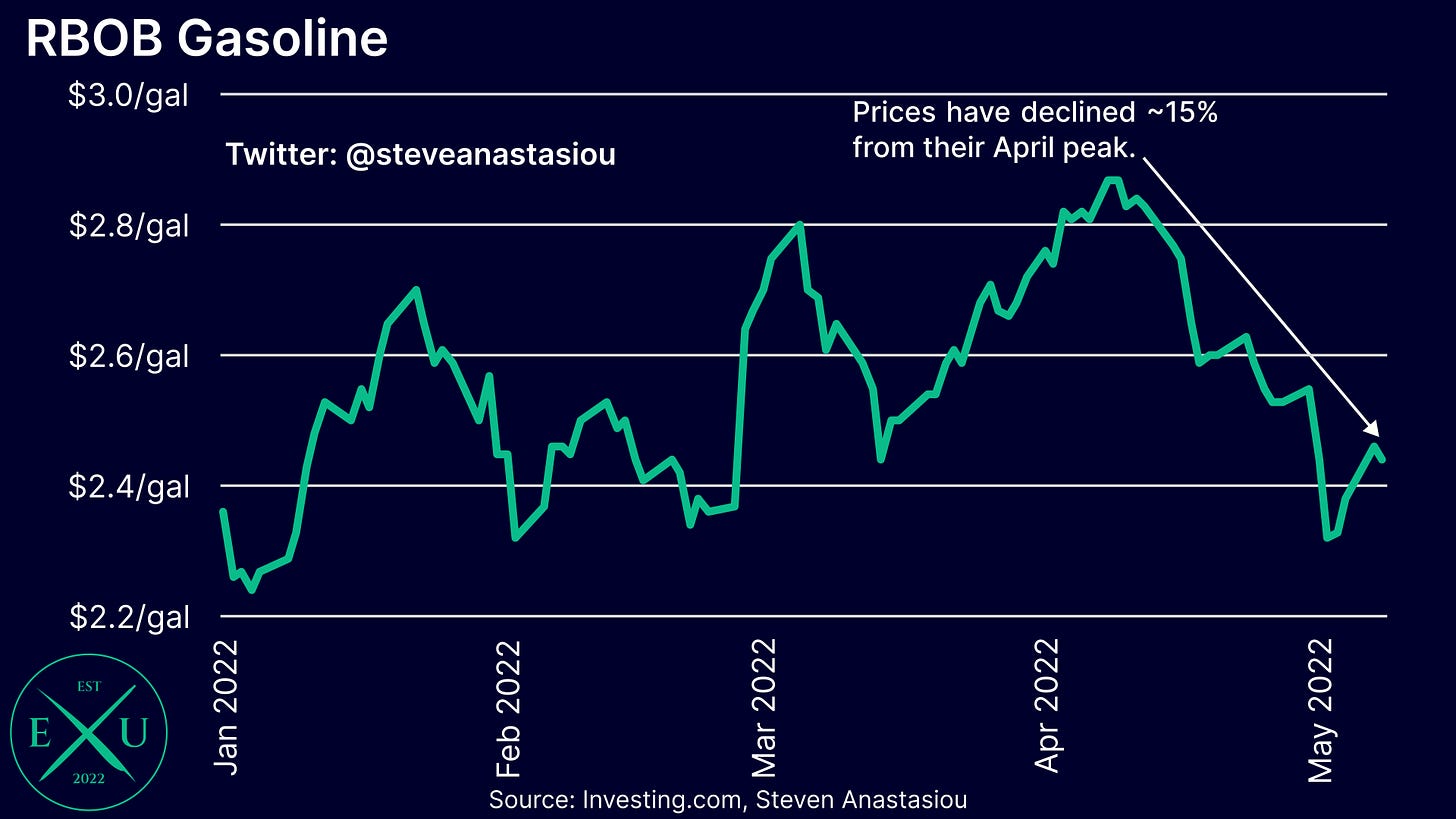
As explained amongst the detail below, future disinflation is also set to be potentially aided by Q1’s sharp rise in wholesale used car prices showing signs of coming to an end, and a sharp decline in retail gasoline prices, as foreshadowed by a current ~15% decline in RBOB gasoline prices from their April peak.
That’s the broad summary, now let’s unpack the details!
Durables prices likely to see a material MoM increase on account of used car prices — but better signs lie ahead as wholesale used car prices reverse their Q1 trend in April
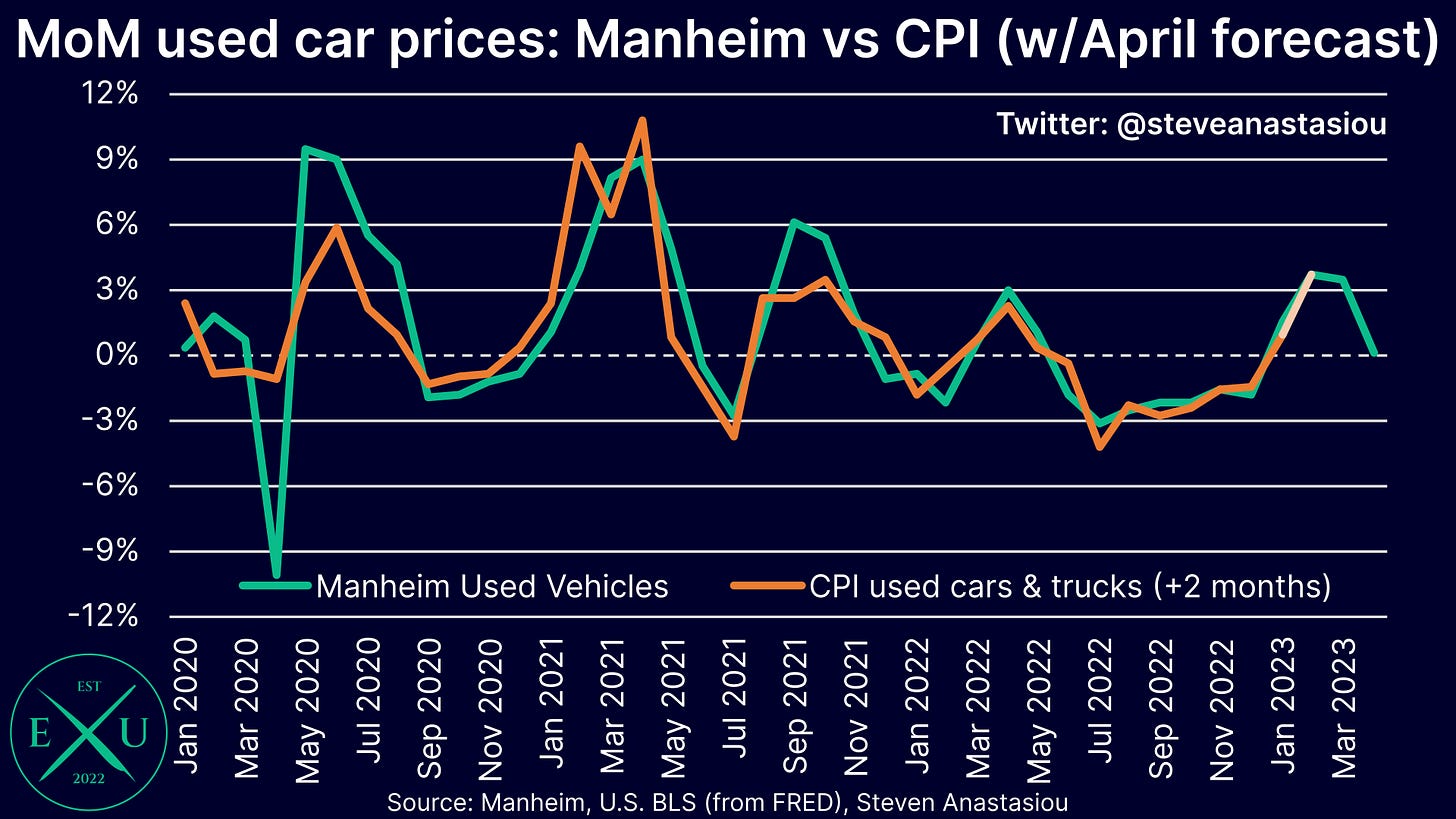
With CPI used car and truck prices (which measure retail prices) generally lagging the Manheim Used Vehicle Value Index (Manheim Index) (which tracks wholesale prices) by ~2 months, April could see a significant rise in CPI used car and truck prices.
This comes after the Manheim Index rose by 3.7% in February. With the Manheim Index rising by a further 3.5% in March, there’s also additional price pressure in the pipeline for May’s CPI.
Though in spite of the price pressure in the pipeline, it’s important to note that February’s rise in CPI used car and truck prices was 1.0% — less than the 1.5% that was implied by a two month lag of the Manheim Index. While there’s usually a deviation between the two indexes, it’s interesting that the deviation was materially to the downside, suggesting that the retail market may be less receptive to the higher wholesale prices that were being paid.
In my CPI review for last month, I wrote:
“This suggests that the strong growth that had been seen in wholesale prices is not translating as strongly to the retail level, which may suggest relatively weak consumer demand. Should this persist, wholesale price growth may moderate/decline over the months ahead, as dealers adjust how aggressively they replenish their inventory.”
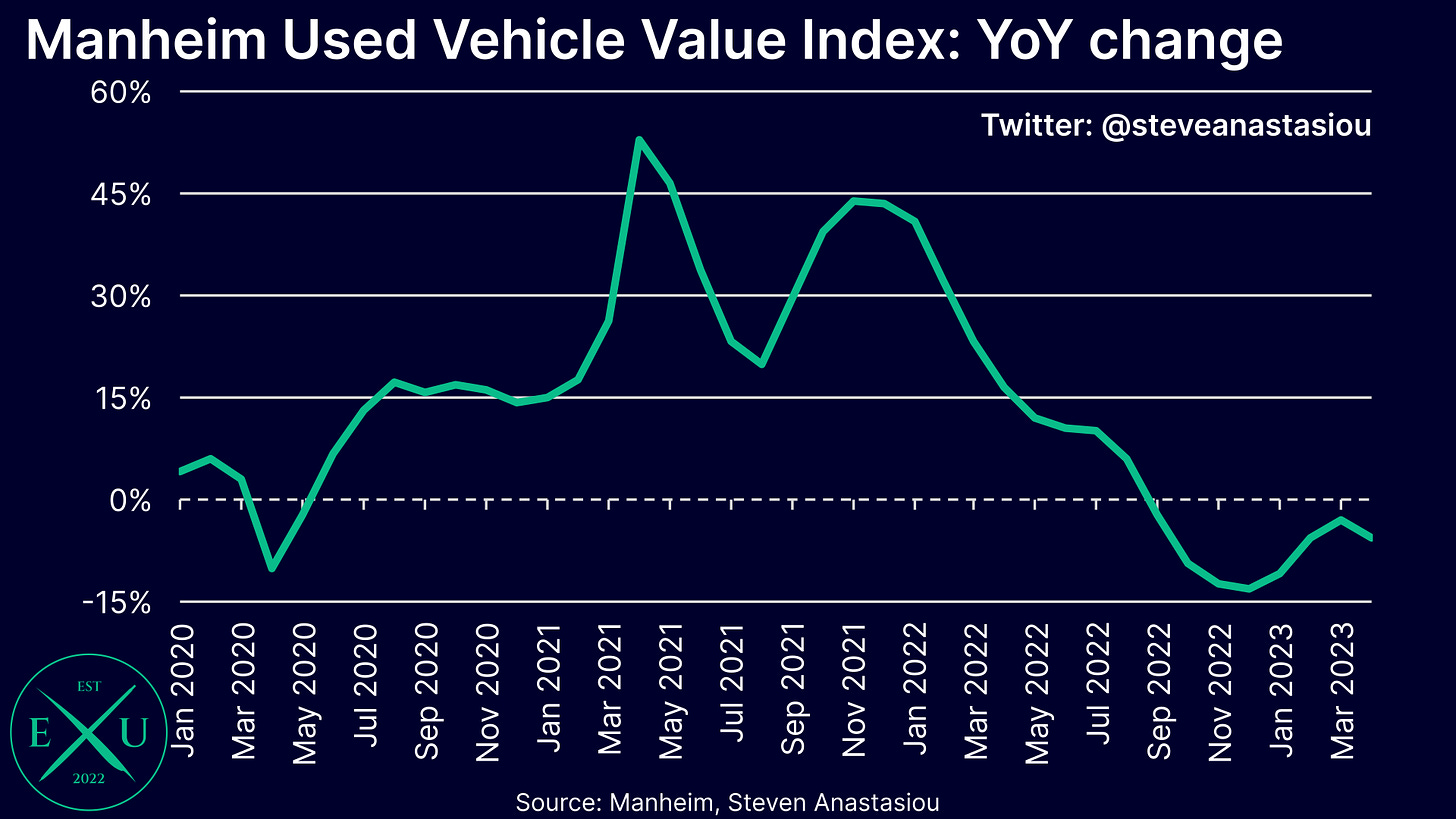
Such a hypothesis has received additional support from the Manheim data for April, which showed a 3% MoM decline in seasonally-adjusted used car prices. On a non-seasonally adjusted basis (which I utilise for the comparison to the CPI), the increase was just 0.1%. This took YoY growth back down to -5.6%, from -2.9% in March.
While I forecast April’s change in CPI used car prices to be in-line with the Manheim Index from February, it therefore wouldn’t be overly surprising for it to come in slightly softer — on the flipside, March’s smaller rise in the CPI could suggest that there’s more price pressure to flow through to retail prices in April.
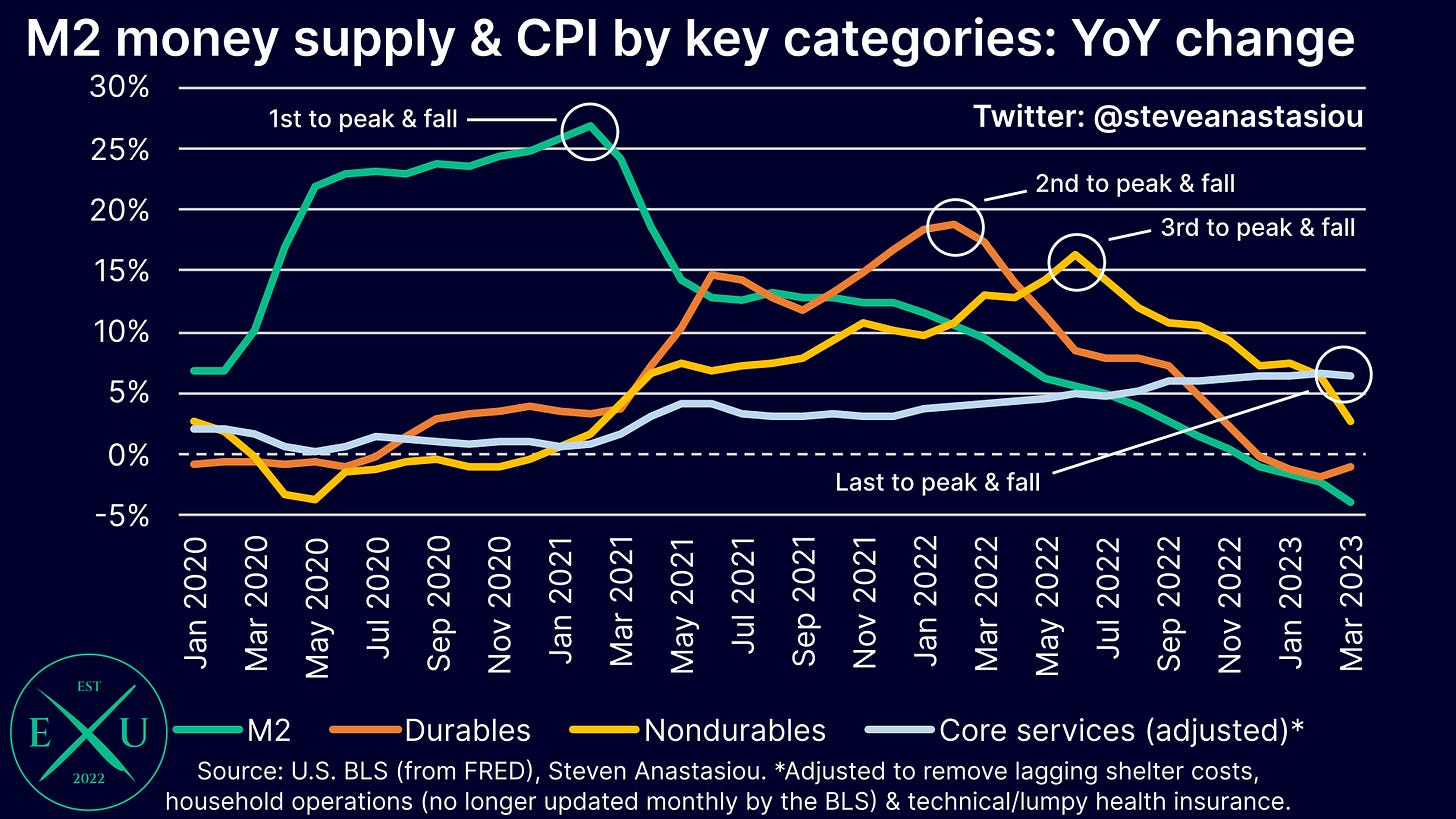
While a 3.7% MoM increase in used car prices would be expected to result in a material MoM increase in durables prices, with the M2 money supply declining, instead of a sustained increase in durables prices, the more likely medium-term trend is that of deflation. April’s Manheim Index data suggests that after Q1’s price growth, used cars could now be once again moving in that direction.
Food at home prices expected to see further YoY moderation, while food away from home prices show the lagging nature of services prices
Following their MoM price decline in March, which broke an incredible 25 months of higher than average MoM price growth, I expect a continued moderation in YoY food at home prices in April.
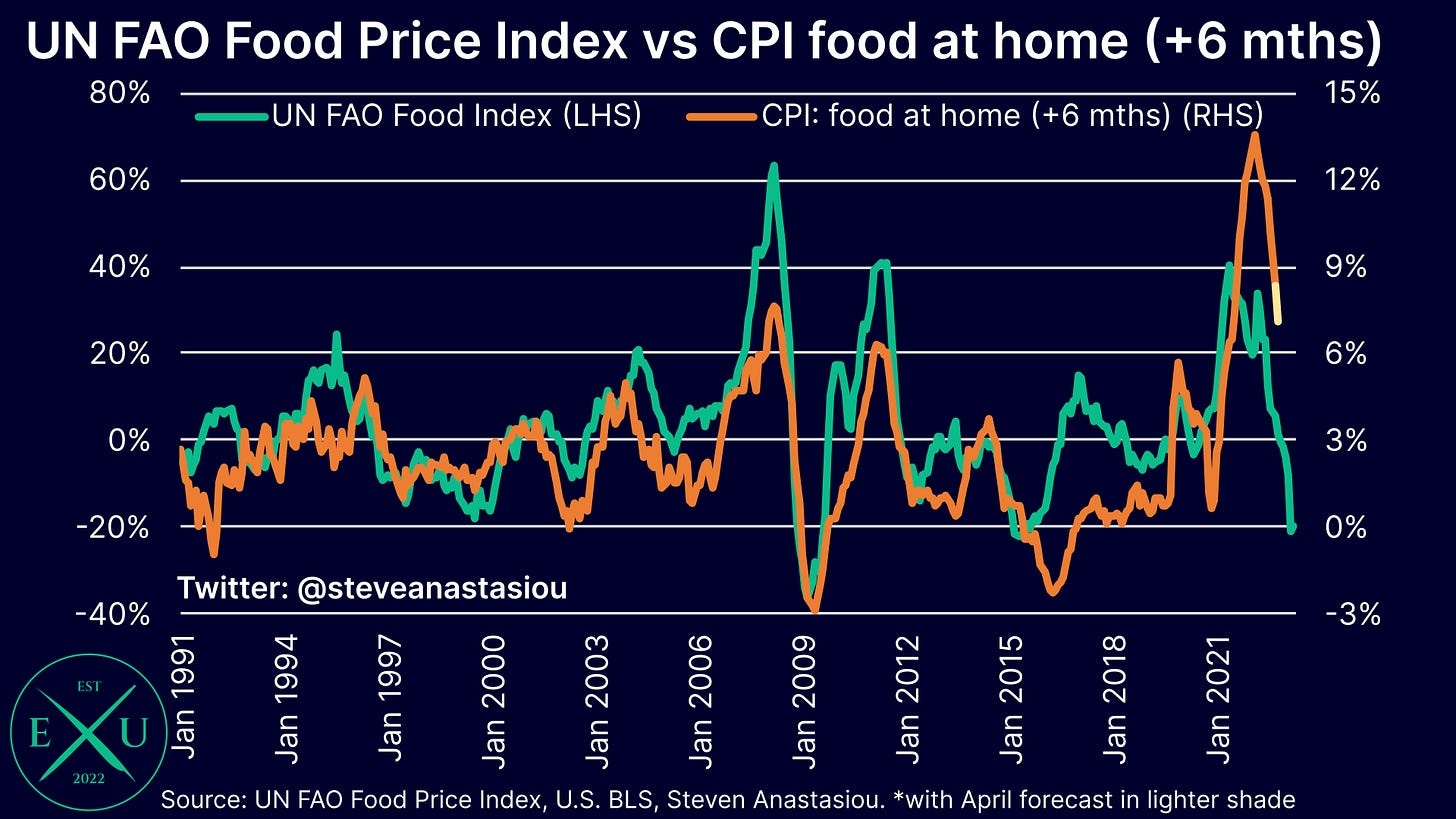
This comes as retail food at home prices are gradually reflecting more and more of the price declines that have been seen in underlying food commodities. Looking at the UN FAO Food Price Index (which measures food commodity prices), to which CPI food at home prices are generally correlated to with a 6-month lag, suggests that further declines in CPI food at home price inflation lie ahead.
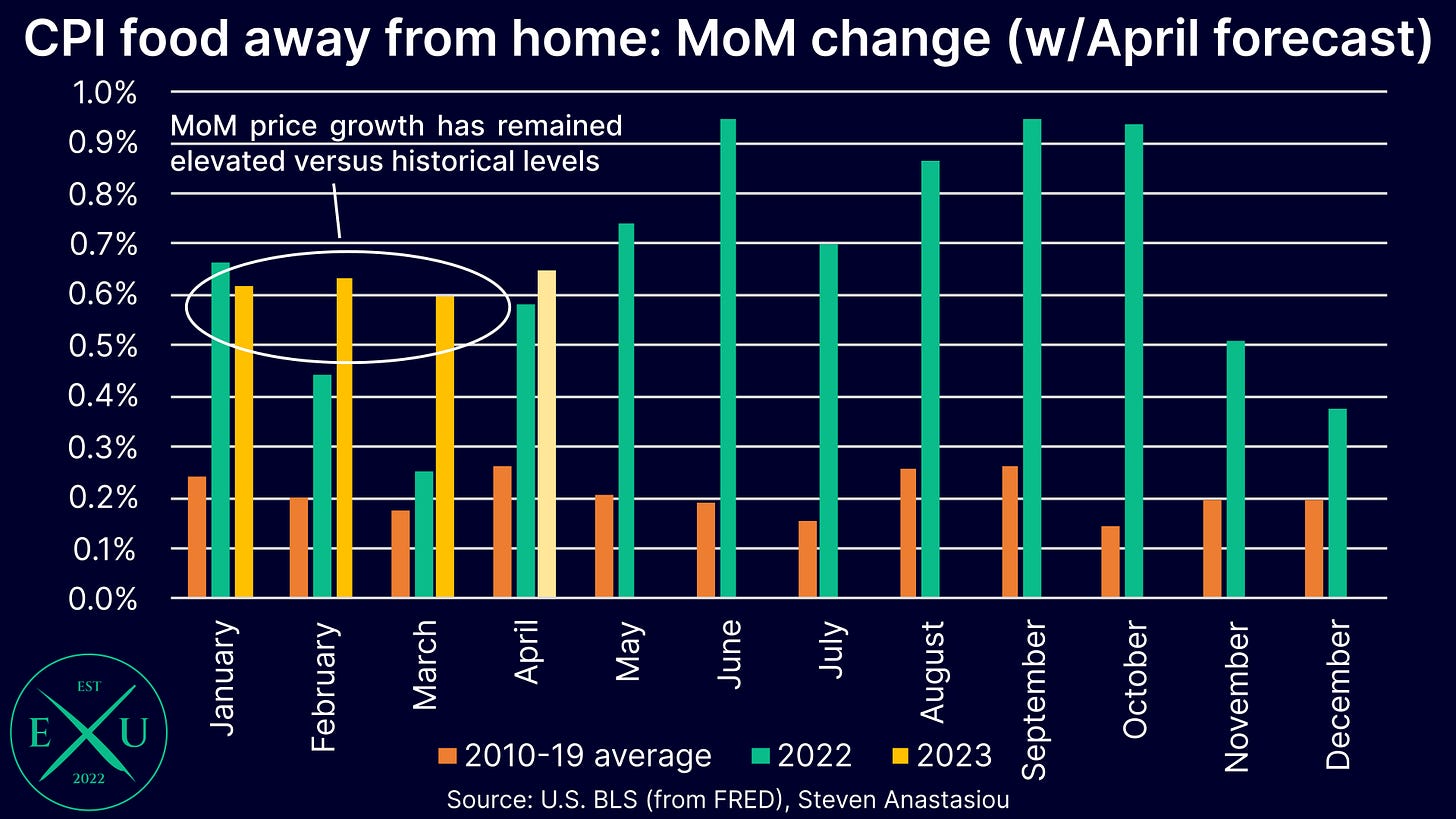
Turning our attention to CPI food away from home prices, we can instead see a continued trend of significantly above average MoM growth. While showing some tentative signs of moderating in November and December 2022, MoM price growth has remained about ~0.4% above its historical MoM average change in the first quarter of 2023. Given this trend, I forecast a similar outcome for April.
As I have explained extensively in prior reports, while prices follow the M2 money supply, not all prices move at the same time and by the same amount. Instead, the timing and proportion of price changes depend upon how the change in the money supply impacts the demand for given goods and services — which is highly variable.
On account of COVID related impacts, durables prices were the first to rise and fall in reaction to the post-COVID changes in the money supply, whilst services prices have been particularly lagging this time around.
The difference between CPI food at home prices (which are primarily commodity based and reflect the second phase of the disinflation cycle), and CPI food away from home prices, which includes services like restaurant dining, provides a fantastic example of the different price lags that are currently in place between different areas of the economy.
A jump in gasoline prices is set to push the CPI higher in April, but a reversal looks likely to occur in May
Following relatively modest increases of 1.5% and 1.0% in February and March, gasoline prices saw a much larger jump in April, rising by 5.3% — the largest increase since June 2022. If this is to transfer 1:1 into the CPI energy commodities component, this single component would add 0.2% to monthly CPI growth for April.
While adding significant upward pressure for the upcoming CPI report, its impact looks likely to reverse significantly in May’s CPI data. This comes as RBOB gasoline prices have fallen significantly over the past month, to now be down ~15% from April’s peak.
This has begun to flow through to retail gasoline prices, which have fallen 3.4% from 24 April, including a 1.9% drop in the first week of May.
Given recent movements in oil and RBOB gasoline prices, and barring an imminent spike, an ongoing moderation of retail gasoline prices would be expected during May, at least somewhat reversing April’s increase.
Rent based measures may see some MoM bounce back following their large moderation in March, but an ongoing downtrend should still be expected
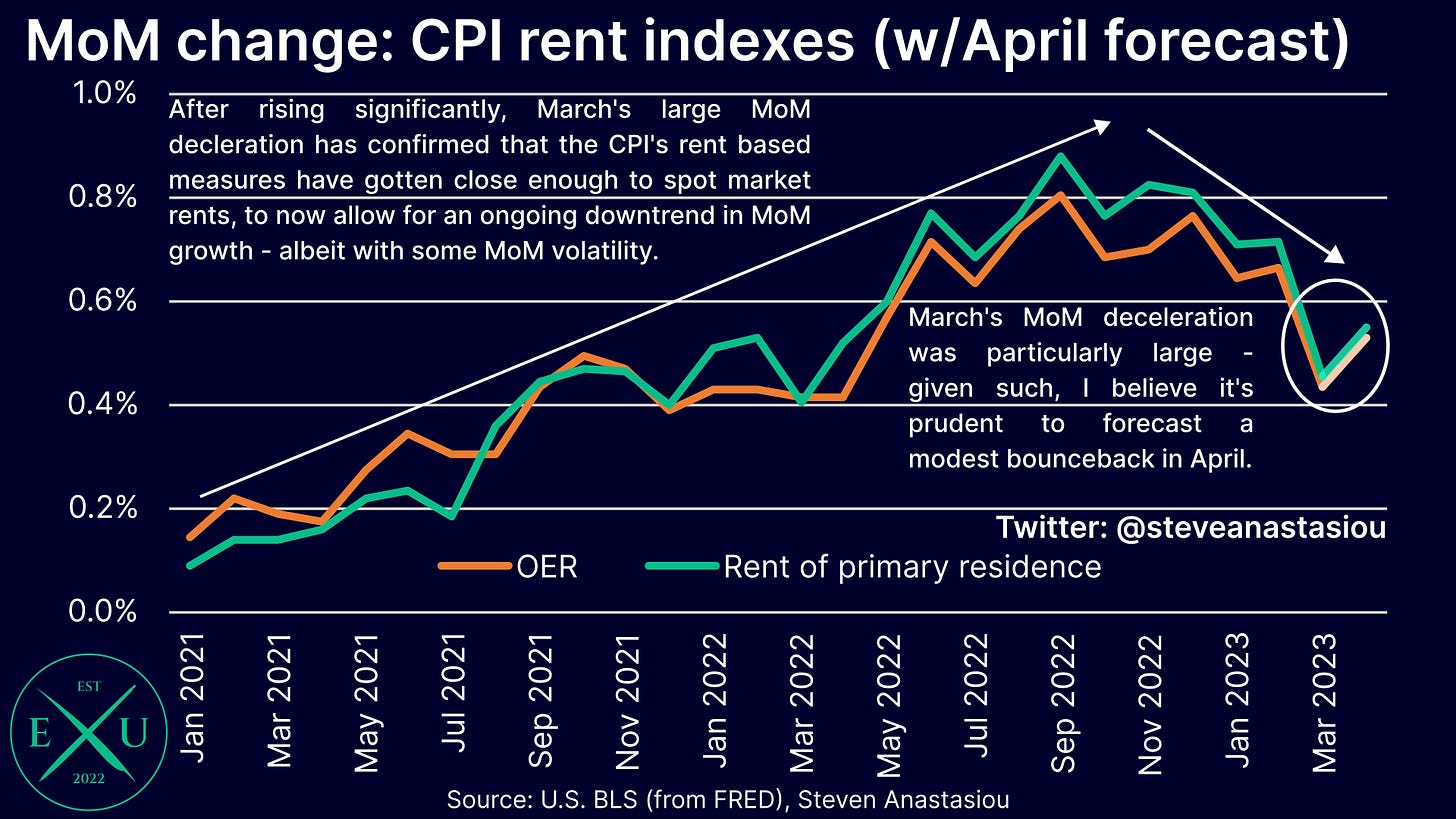
Following the large moderation in owners’ equivalent rent (OER) and rent of primary residence (RPR) in March, I am conservatively anticipating some bounce back in April.
The reason for this, is that in addition to being lagging, OER and RPR are smoothed measures. This stems from only a small portion of the rental sample consisting of new leases in any given month, with the bulk of the sample instead consisting of continuing lease agreements.
As such, the indicators tend to see modest variations in their MoM growth rates. This can be seen in the data over the past two years, with MoM price growth gradually trending upward, and more recently gradually trending downward. The move in March was easily the largest deviation from the prior month’s change since January 2021. Given such a dynamic, I believe it’s conservative to forecast a modest bounce back in April.
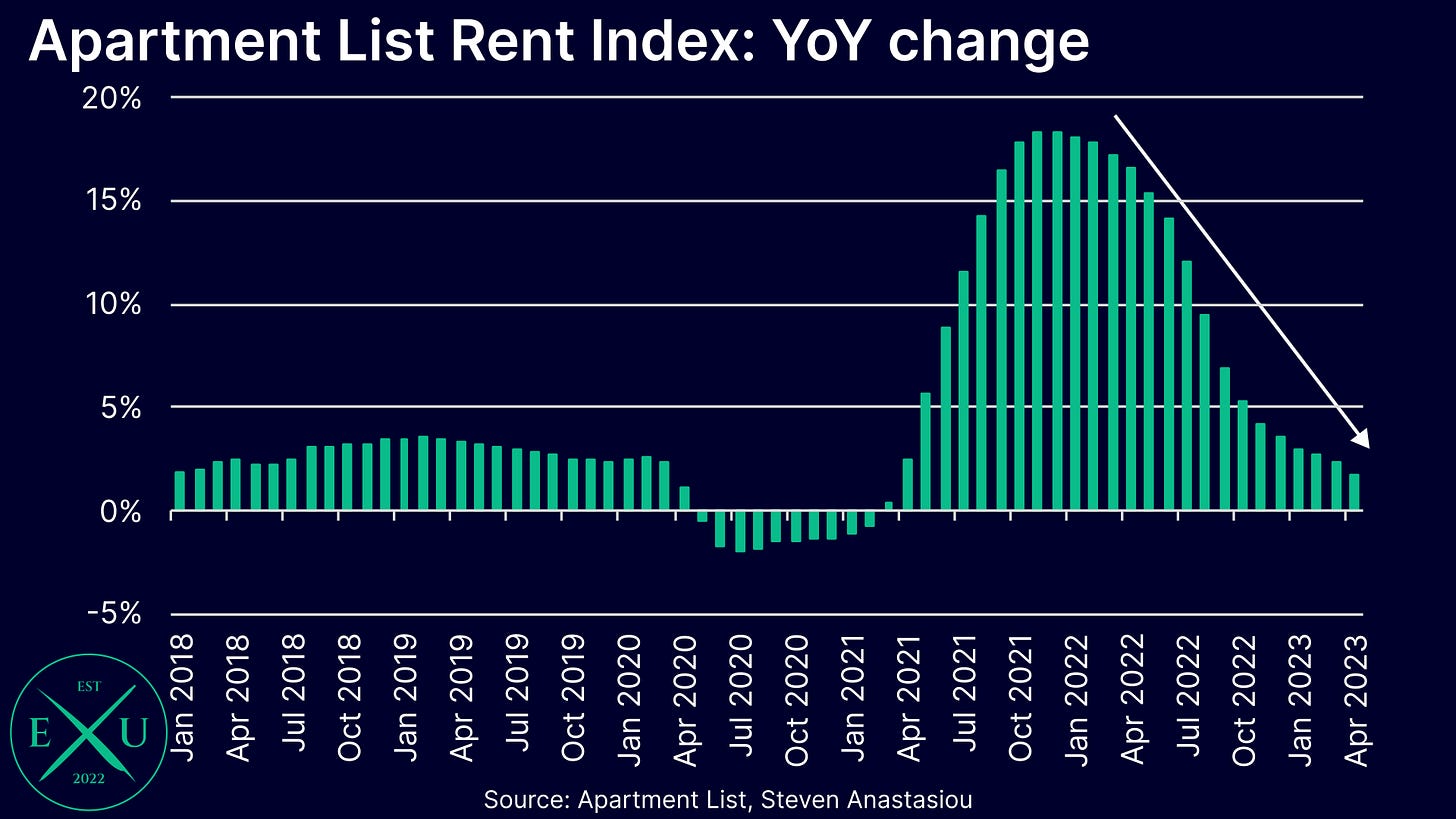
Though in terms of the medium-term trend, last month’s move only further confirmed that both OER and RPR should continue broadly trend lower over the months ahead, reflecting the ongoing moderation that is being seen in underlying spot market rents.
Lagging services prices expected to still see higher than average MoM growth, but the YoY growth rate should moderate for the 2nd consecutive month
With services prices being the most lagging price cycle component, many components are yet to have shown signs of materially disinflating.
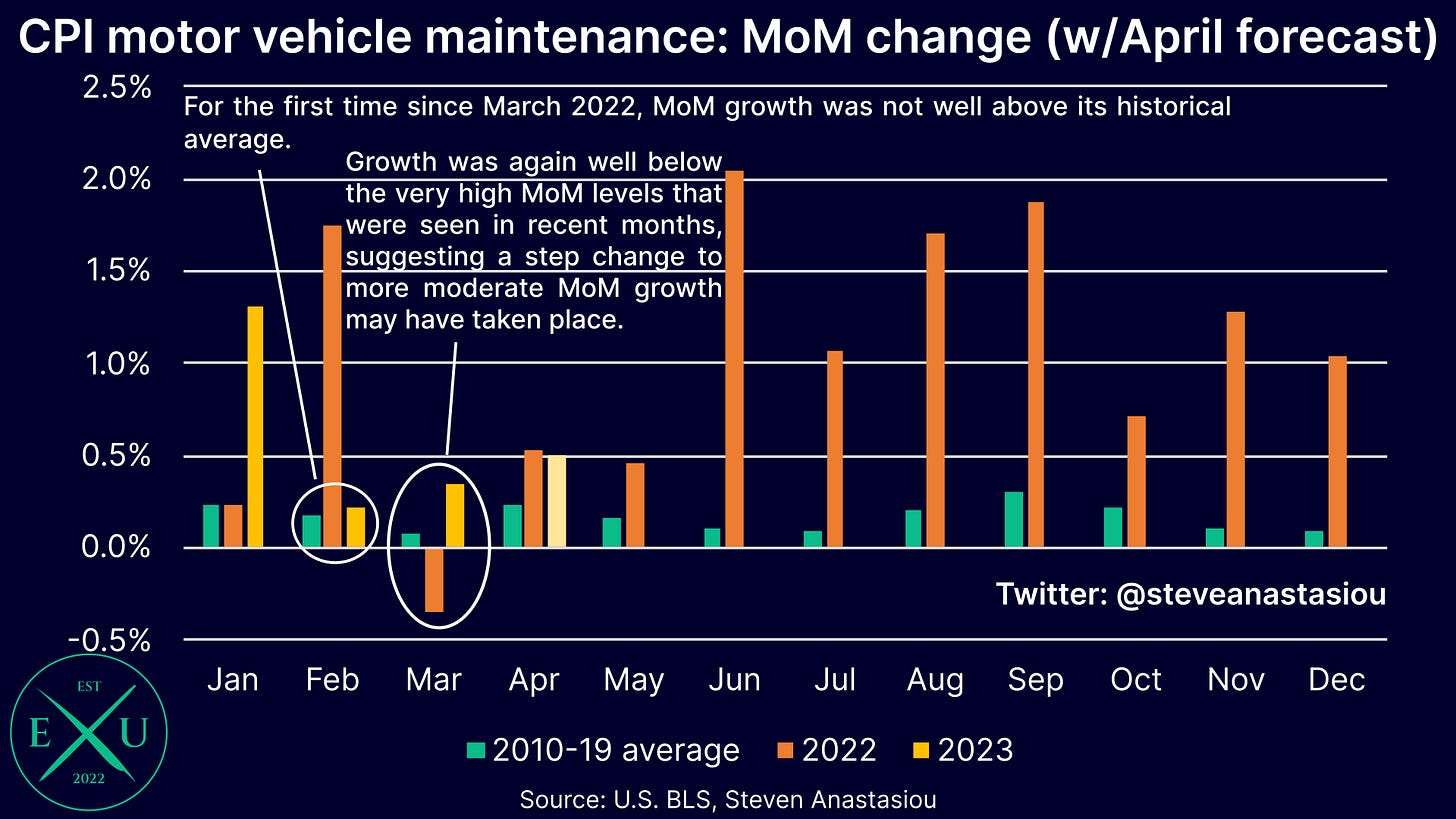
One area where disinflation appears to be showing some signs of occurring, is in motor vehicle maintenance costs, which have now seen two consecutive months of more moderate MoM growth versus their historical average than in previous months.
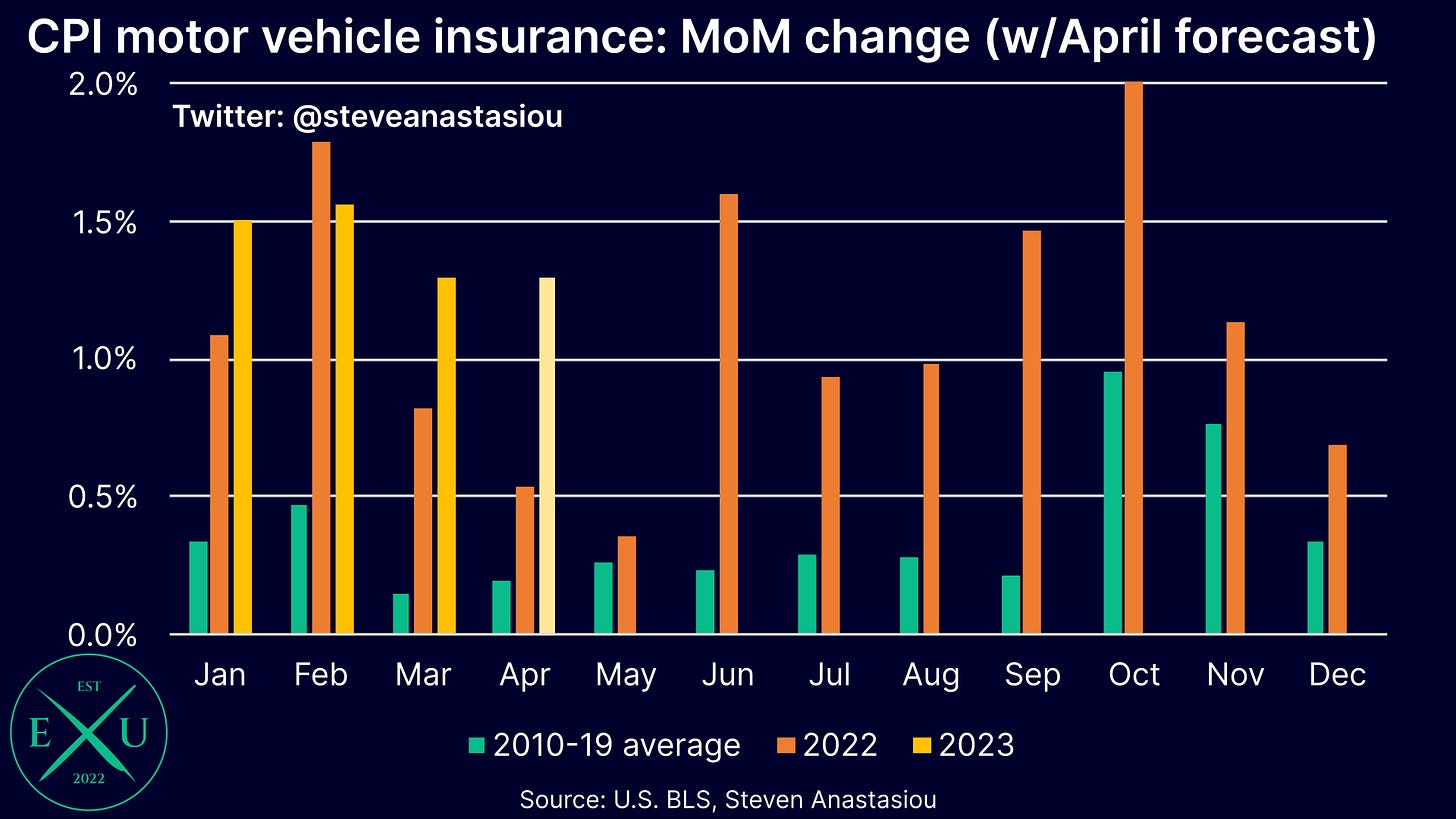
Whether this continues for a third month is important not only for the category itself, but it’s likely to also play an important role in reducing motor vehicle insurance price growth, which has been rising at an astronomical pace.
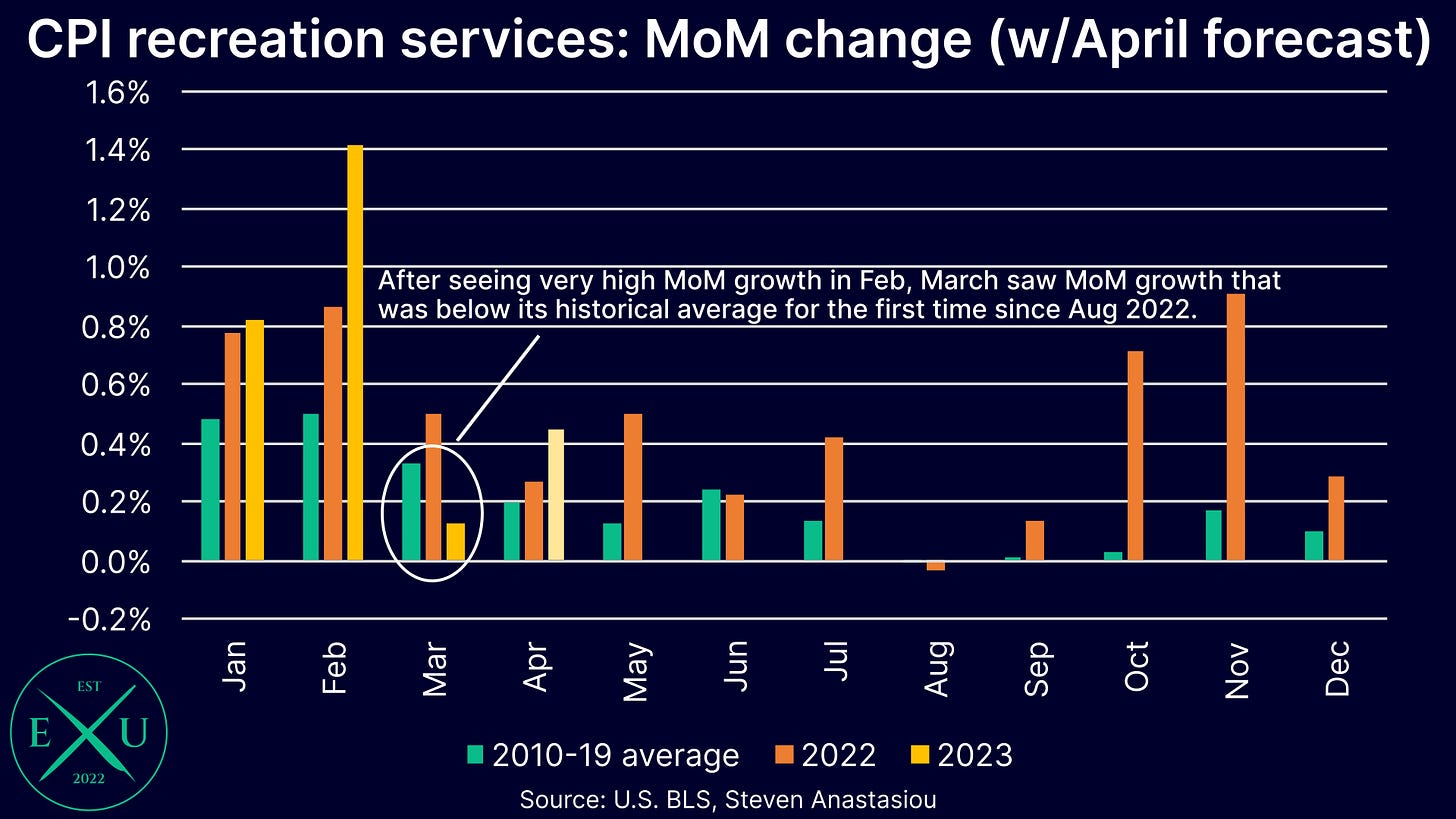
After a large increase in February, recreation services prices saw MoM price growth that was below their historical monthly average in March. Whether this simply reflects some cooling after the large rise in February, or the beginning of a moderating trend, remains to be seen.
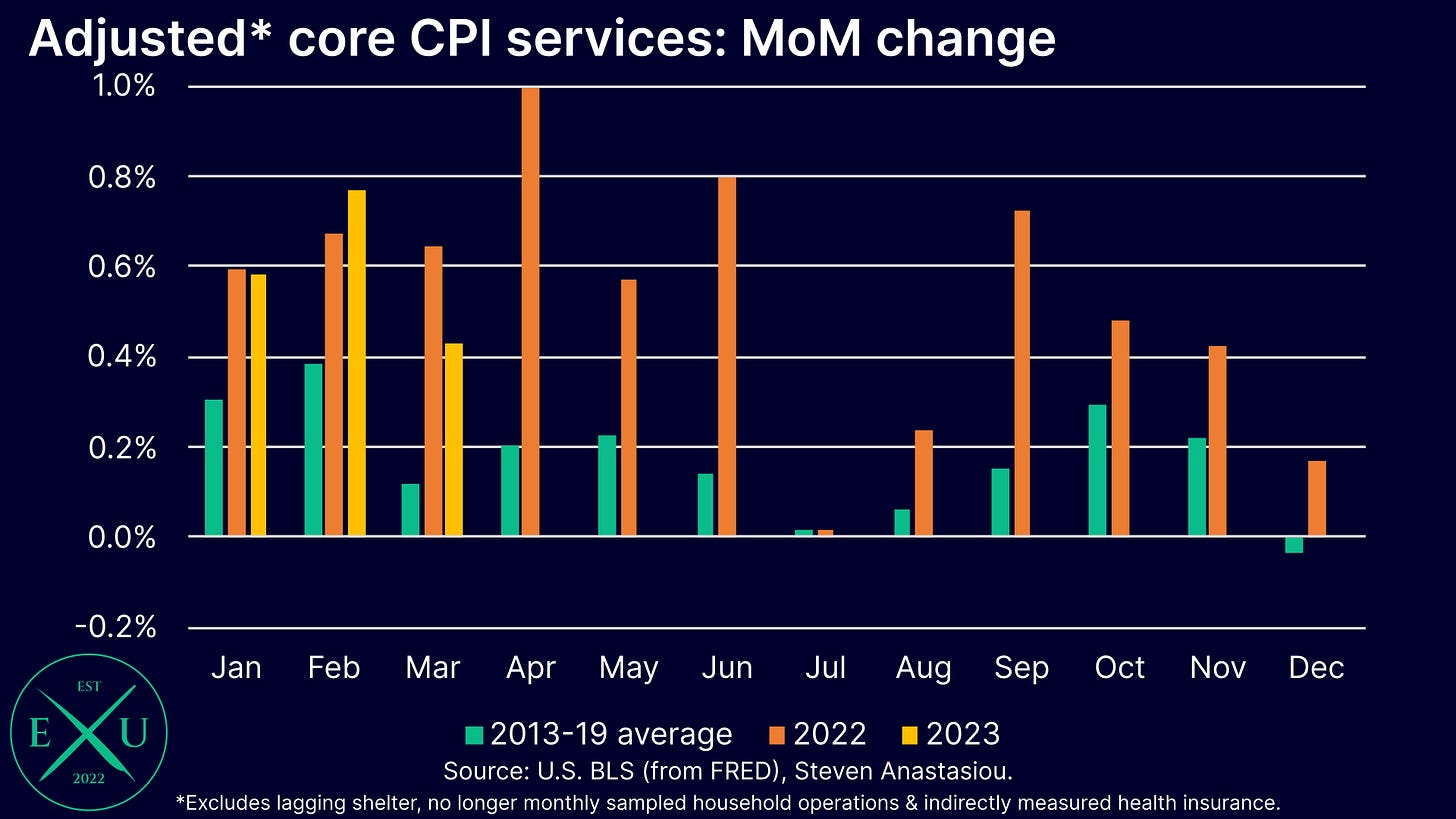
Looking at the core services category as a whole, another month of materially hotter price growth versus the historical average is expected to be seen in April, with price trends for internet services, motor vehicle insurance, public transportation, and other personal services, remaining materially above their historical average (2010-19 average) over the past few months.
Note that in the below chart, shelter is excluded on account of its lagging nature, while health insurance is excluded due to the lumpy, indirect measurement approach that has seen high levels of volatility since COVID.
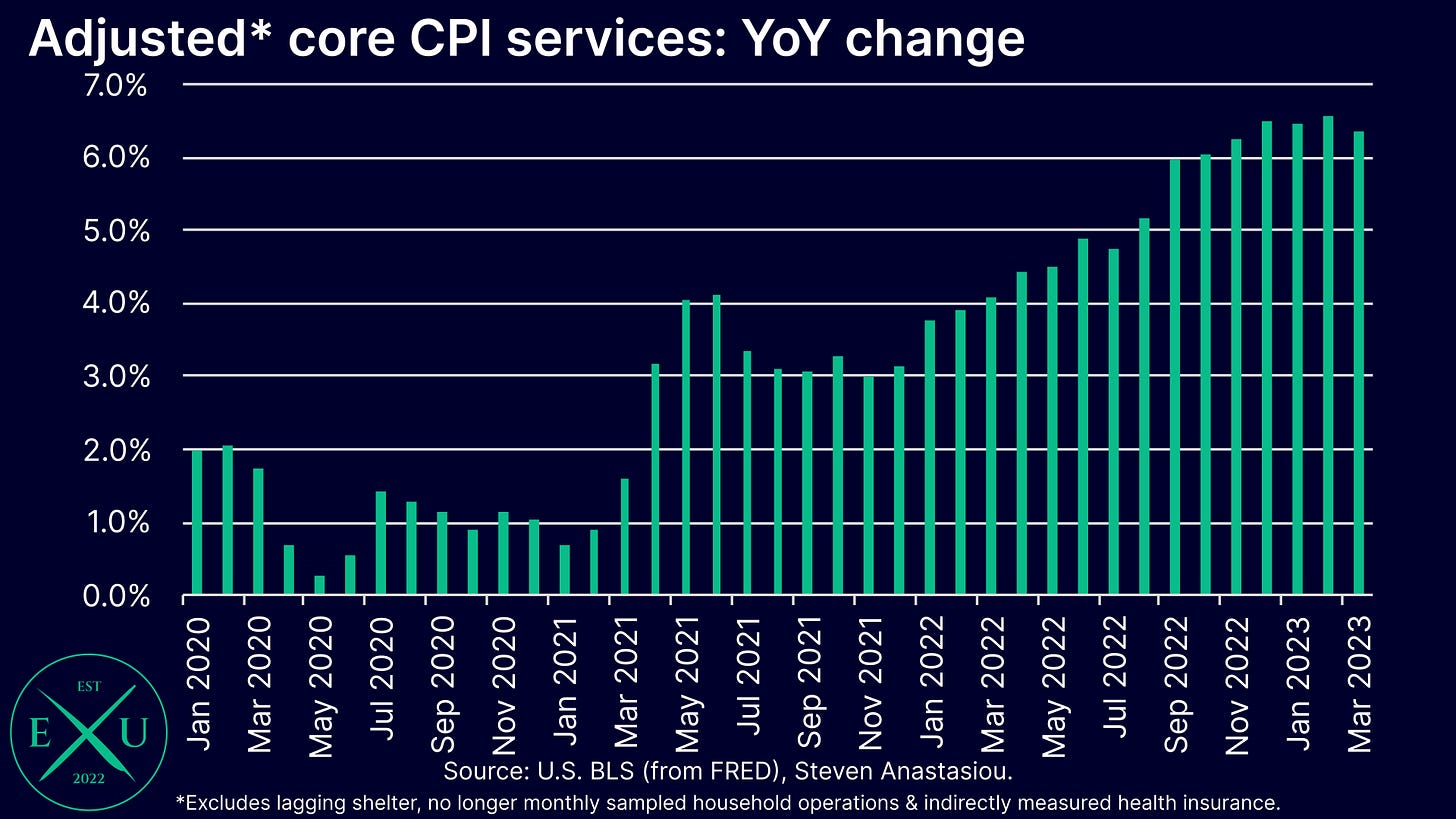
In spite of the higher than historical MoM price growth, there was still a moderation in the YoY growth rate in March. Given that there was a large 1.0% MoM increase in adjusted core services prices in April 2022, I anticipate another moderation in the YoY growth rate of core services ex-shelter and health insurance prices in April.
Thank you for reading!
I hope you enjoyed my latest research piece. In order to help support my independent economics research (with further reports, including the next US CPI review installment on the way post the US CPI report), please consider liking and sharing this post. Please feel free to also leave any comments below, to which I will endeavour to respond.
If you haven’t already subscribed to Economics Uncovered, subscribe below so that you don’t miss an update.



Appreciate the insight and detail that goes into these. 🙏